
G
Selected Supporting Information
LABORATORY BUDGETS
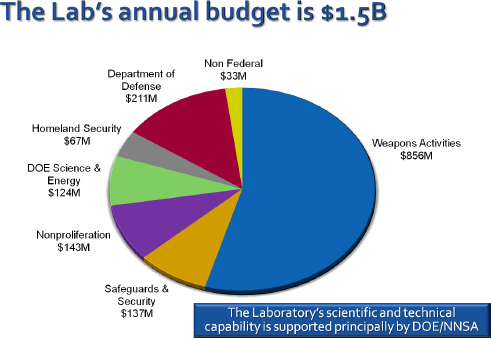
FIGURE G.1 Lawrence Livermore National Laboratory (LLNL) FY2010 Annual Budget. SOURCE: George Miller, LLNL Director, presented to the committee by on April 26, 2011, at Lawrence Livermore National Laboratory, Livermore, California.
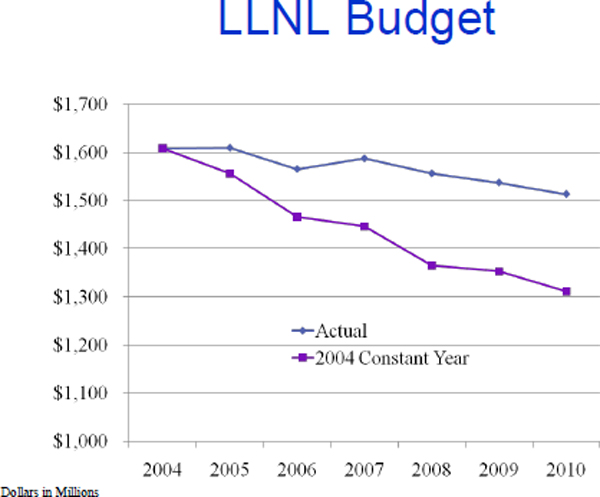
FIGURE G.2 LLNL Budget for FY2004-FY2010. SOURCE: Alice Williams, Livermore Site Office Manager, presented to the committee on April 27, 2011, at Lawrence Livermore National Laboratory, Livermore, California.
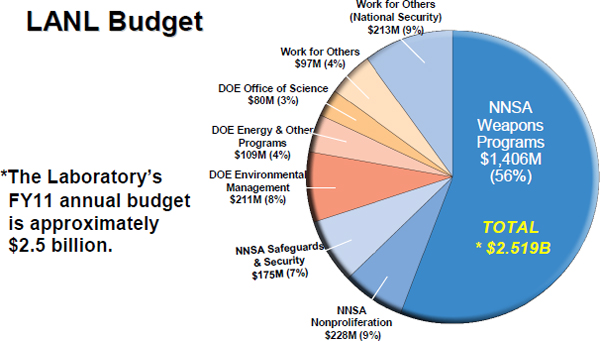
FIGURE G.3 Los Alamos National Laboratory (LANL) FY2011 Annual Budget. SOURCE: Michael Anastasio, LANL Director, presented to the committee by on April 11, 2011, at Los Alamos National Laboratory, Los Alamos, New Mexico.
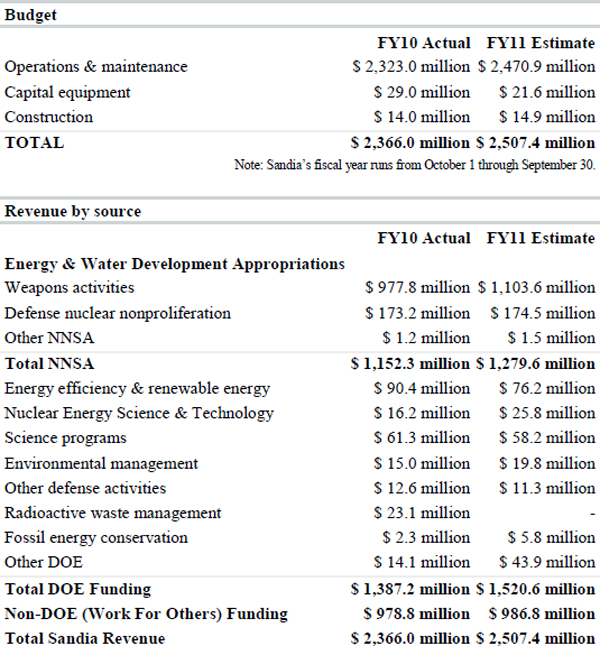
FIGURE G.4 Sandia National Laboratory (SNL) Annual Budget. NOTE: Data shown is for SNL’s FY2010 actual expenditures and FY2011 estimated expenditures. SOURCE: Data from Sandia National Laboratories website, available at http://www.sandia.gov/about/faq/
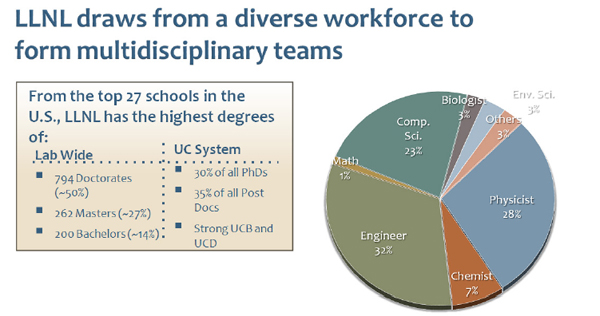
Recruiting and retaining a quality workforce critical to continued success of laboratory and stewardship
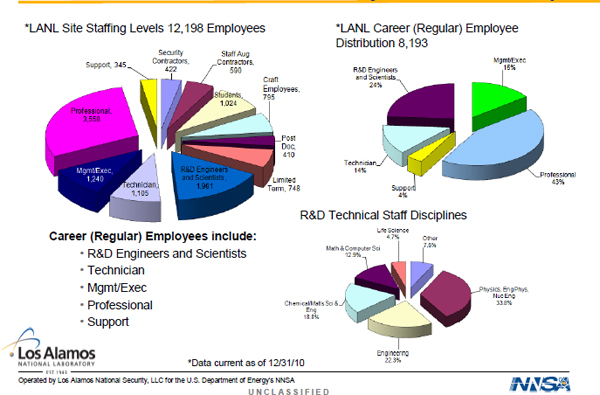
For Fiscal Year 2011, LANL reported:
- 2,079 peer-reviewed publications which was the highest since 2006
- LANL won three R&D 100 Awards
- The number of post-doctorial candidates was an all-time high
FIGURE G.6 Los Alamos National Laboratory’s workforce. SOURCE: Michael Anastasio, LANL Director, presented to the committee on April 11, 2011, at Los Alamos National Laboratory, Los Alamos, New Mexico.
LABORATORY SITE OFFICE STAFF NUMBERS
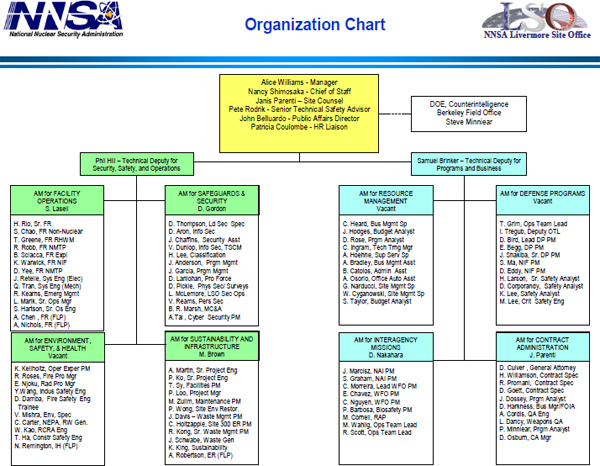
FIGURE G.8 Livermore Site Office (LSO). NOTE: This figure gives the organizational structure of the Livermore Site Office. Listed under each Assistant Manager (AM) position are the names of the individuals that the respected AM manages. According to the data in this figure, the size of the Livermore Site Office totals 106 employees, which includes all Assistant Managers (vacant and non-vacant positions), the staff they supervise, the Technical Deputies, and the positions located in the Manager’s Office: Site Office Manager, Chief of Staff, Site Counsel, Senior Technical Safety Advisor, Public Affairs Director, and HR Liaison. SOURCE: Alice Williams, Livermore Site Office Manager, presentation to committee on April 27, 2011, at Lawrence Livermore National Laboratory, Livermore, California.
The LASO Team
Authorized 107 NNSA and 28 EM employees:
| 10% Facility Representatives | 10% Mission | ||
| 10% Project Management | 20% Nuclear Safety | ||
| 20% Environmental | 10% Management | ||
| 10% Security | 10% Support |
About 85 percent possess BA, MA, or PhD and several qualify as subject matter experts in their fields
FIGURE G.9 Los Alamos Site Office Team. SOURCE: Kevin Smith, LASO Manager, data from presentation to committee on April 12, 2011, at Los Alamos National Laboratory, Los Alamos, New Mexico.
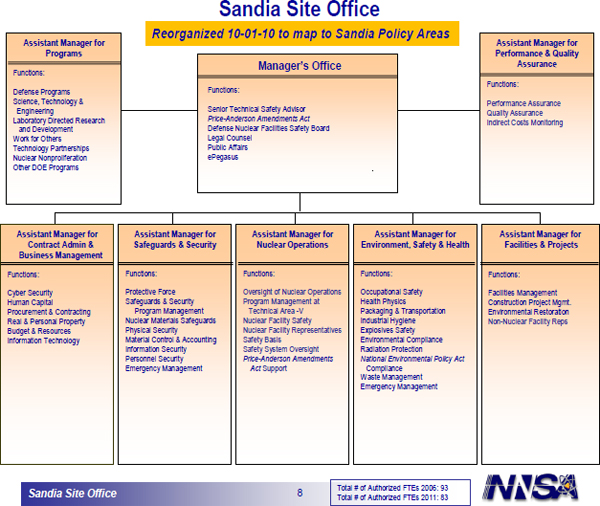
FIGURE G.10 Sandia Site Office’s (SSO) Organizational Structure. NOTE: According to this data, as of 2011, the total number of authorized full time employees at the Sandia Site Office totaled 83.
SOURCE: Sandia Site Office presentation to committee on March 23, 2011, at Sandia National Laboratories, Albuquerque, New Mexico.
LABORATORY CONTRACT TERM FEES
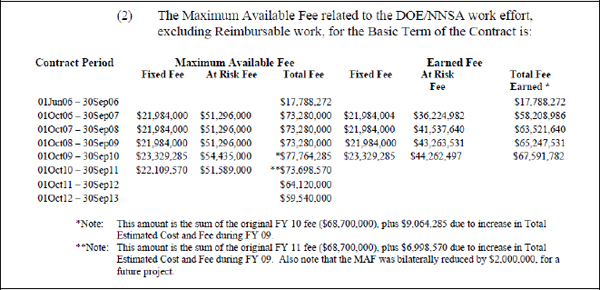
FIGURE G.11 Los Alamos National Security (LANS) Contract Fee Structure. SOURCE: Excerpted from the Management & Operating Contract for the Los Alamos National Laboratory National Nuclear Security Administration, Unofficial Conformed Copy as of 9/16/11. Part I, Section B-2 “Contract Type and Value,” p. 6, available at http://www.lanl.gov/orgs/pcm/pdfs/conformed_prime_contract.pdf.
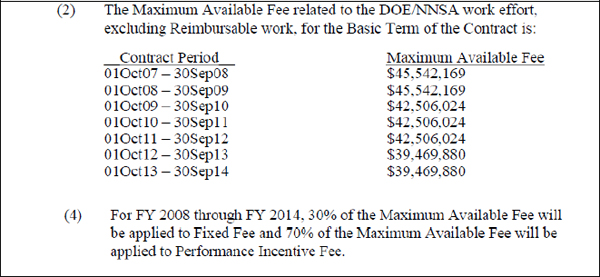
FIGURE G.12 Lawrence Livermore National Security (LLNS) Contract Fee Structure. SOURCE:
Excerpted from the LLNS Management and Operating Contract, Part I, Section B-2 “Contract Type and Value,” p. 5.
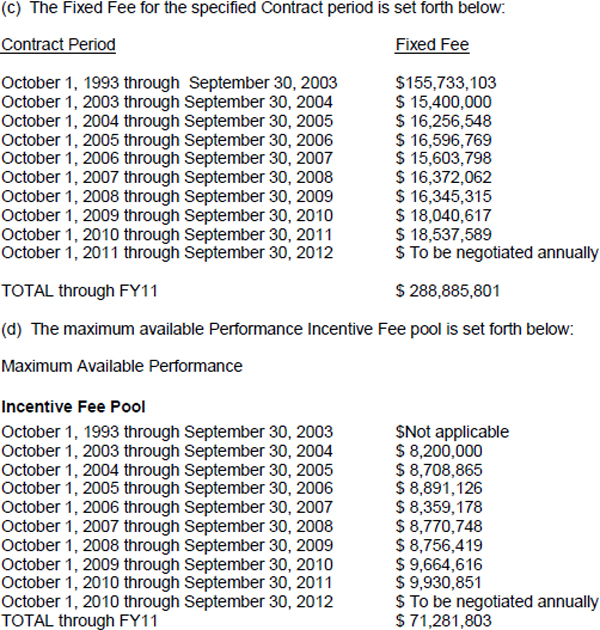
FIGURE G.13 Sandia Corporation Contract Fee Structure. SOURCE: Excerpted from the Sandia Corporations Management and Operating Contract, Part I, Section B-2.
TABLE G.1 Approximate Annual Fee Structures (in millions of dollars)
| Laboratory | Fixed Fee | Maximum Award Fee |
| SNL | 16 | 9-10 |
| LANL | 22 | 52 |
| LLNL | 12.5 | 29.5 |
COSTS ASSOCIATED WITH LANL AND LLNL CONTRACT CHANGES
When the contracts changed at LANL and LLNL, cost changes were incurred. Some of these were savings, and others were additional costs. Some were one-time charges or savings (or transfers), while others affect each year’s budget. Many of the changes were changes in the cost to the government of running the laboratories that do not affect the budgets of the laboratories directly because they are paid directly by the government to some other entity without going through the laboratory.
Of particular concern to the laboratories are those additional costs and expenses that must be borne out of the laboratory budget. These affected operations at the laboratories because they caused net reductions in the overall money available to pay for laboratory activities.
Specifically, three categories are of major concern: (1) increases in the management fees; (2) changes in personnel costs due to changes in health and pension benefit plans as laboratory personnel transitioned from being U Cal employees to being employees of their respective LLCs (LANS, LLNS); and (3) changes in state and local tax obligations associated with the transition from a public institution (U Cal) to a private corporation. This last was much more significant at LANL and at LLNL.
At each of these two laboratories, the annual cost of doing business increased by very roughly$100 million per year.
• LANL
— The annual fee increased from less than $10 million to about $60 million, as shown in the contract excerpt in the preceding section. The actual amount varies by year and by performance. This increase is typically $40 million to $50 million
— State and local tax obligations increased by $65 million
— Pension plan changes necessitated a $30 million contribution to the new defined contribution plan.
The total increase is therefore on the order of $140 million per year.
• LLNL
— The annual fee increased from less than $10 million to about $45 million, as shown in the contract excerpt in the preceding section. The actual amount varies by year and by performance. This increase in typically $30 million.
— Pension plan changes necessitated a $30 contribution
— Healthcare costs increased about $10 million.
— There were no substantial tax changes at LLNL; taxes decreased by about $2 million.
The total increase is therefore on the order of $70 million per year.
At both labs, there were also large decreases in costs to the government. Since these amounts were not part of the laboratory budgets, they are not included in this accounting, and the laboratories did not benefit directly from them.
TENURES OF LABORATORY DIRECTORS
TABLE G.2 Tenures of Laboratory Directors
| LLNL | LANL | SNL | |||||||||
| Director | Start Year | End Year | Tenure (years) | Director | Start Year | End Year | Tenure (years) | Director | Start Year | End Year | Tenure (years) |
| York | 1952 | 1958 | 6 | Oppenheimer | 1943 | 1945 | 2 | Landry | 1949 | 1952 | 3 |
| Teller | 1958 | 1960 | 2 | Bradbury | 1945 | 1970 | 25 | Quarles | 1952 | 1953 | 1 |
| Brown | 1960 | 1961 | 1 | Agnew | 1970 | 1979 | 9 | McRae | 1953 | 1958 | 5 |
| Foster | 1961 | 1965 | 4 | Kerr | 1979 | 1986 | 7 | Molnar | 1958 | 1960 | 2 |
| May | 1965 | 1971 | 6 | Hecker | 1986 | 1997 | 11 | Schwartz | 1960 | 1966 | 6 |
| Batzel | 1971 | 1988 | 17 | Browne | 1997 | 2003 | 6 | Hornbeck | 1966 | 1972 | 6 |
| Nuckolls | 1988 | 1994 | 6 | Nanos | 2003 | 2005 | 2 | Sparks | 1972 | 1981 | 9 |
| Tarter | 1994 | 2002 | 8 | Kuckuck | 2005 | 2006 | 1 | Dacey | 1981 | 1986 | 5 |
| Anastasio | 2002 | 2006 | 4 | Anastasio | 2006 | 2011 | 5 | Welber | 1986 | 1989 | 3 |
| Miller | 2006 | 2011 | 5 | Narath | 1989 | 1995 | 6 | ||||
| Robinson | 1995 | 2005 | 10 | ||||||||
| Hunter | 2005 | 2010 | 5 | ||||||||
LABORATORY PRODUCTIVITY
Laboratory productivity can be measured in a number of ways, including number of peerreviewed journal articles published each year, and through the various awards earned by laboratory scientists. Several of the laboratories’ key achievements from recent years are highlighted below.
Los Alamos National Laboratory
In FY2011:
• LANL had 2,079 peer-reviewed publications, the highest since 2006.
• The laboratory’s number of post-doctoral candidates was at an all-time high.
• LANL won three R&D 100 Awards.1
• The E.O. Lawrence Award, which recognizes exceptional contributions in R&D that support the DOE and its missions, was awarded to two LANL scientists.2
TABLE G.3 LANL Peer-Reviewed Publications
| CY2007 | CY2008 | CY2009 | |
| LANL publications 1,928 | 1,780 | 1,743 | |
| LDRD-supported publications | 401 | 452 | 376 |
| Percent due to LDRD | 21% | 25% | 22% |
SOURCE: FY2010 LANL LDRD Annual Report, available at
http://www.lanl.gov/science/ldrd/docs/LANL-LDRD-FY10-AR.pdf.
Lawrence Livermore National Laboratory
In FY2011:
• LLNL won two R&D 100 Awards.3
• LLNL researchers received Secretary of Energy Achievement Awards.4
TABLE G.3 Journal Papers Resulting from LDRD-Funded Research as a Percentage of Total Articles for the Past 5 Years
| Journal Articles | 2006 | 2007 | 2008 | 2009 | 2010 |
| All LLNL articles | 1,237 | 1,162 | 1,097 | 1,001 | 910 |
| LDRD articles | 223 | 237 | 212 | 161 | 186 |
| LDRD articles as percentage of total | 18% | 20% | 19% | 16% | 20% |
SOURCE: FY2010 Laboratory Directed Research and Development Annual Report, Lawrence Livermore National Laboratory https://ldrd.llnl.gov/pdfs/LLNL_10LDRD.pdf
_______________________________
1 Provided by the LASO Site Manager from the FY2011 LANL Self-Assessment.
2 See News Release, available at http://www.lanl.gov/news/releases/lanl_scientists_win_two_prestigious_eolawrence_awards_from_the_doe.html.
3 See News Release at https://www.llnl.gov/news/newsreleases/2011/Jun/NR-11-06-05.html.
4 See News Release at https://www.llnl.gov/news/aroundthelab/2011/Nov/ATL-112211_awards.html.
TABLE G.4 Journal Papers Resulting from LDRD-Funded Research as a Percentage of All LLNL Papers from 2004 to 2008
| Journal Articles | 2004 | 2005 | 2006 | 2007 | 2008 |
| All LLNL articles | 1,158 | 1,296 | 1,237 | 1,162 | 1,097 |
| LDRD articles | 210 | 250 | 247 | 237 | 211 |
| LDRD articles as percentage of total | 18% | 19% | 20% | 20% | 19% |
SOURCE: FY2008 LLNL Laboratory Directed Research and Development Annual Report, available at https://ldrd.llnl.gov/pdfs/LLNL_08LDRD.pdf.


