
GLACIOLOGICAL MASS BALANCE
MEASUREMENT
In the glaciological method, a network of stakes and pits are placed on the glacier surface and used to measure the change in surface level while taking into account snow/firn/ice density. Comparing measurements between two fixed dates yields an annual mass balance, while comparing measurements at the end of the ablation and accumulation seasons yields a seasonal mass balance (Racoviteanu et al., 2008). The mass balance for the glacier is then estimated by multiplying the changes in mass balance at each sampling point with the area that point represents, and summing the product over the entire glacier. This method provides detailed information on the mass balance spatial variation and is considered more accurate than other methods (Kaser et al., 2003).
The glaciological method may achieve the greatest accuracy and provides the investigator insight for the field conditions, it is based on repeated field measurements, which have to be carried out under sometimes rather challenging conditions. These challenges include logistical constraints in remote areas, inclement weather conditions including cold temperatures and high winds, crevasses, avalanches and icefalls, and rockfall from surrounding terrain. The rate of data acquisition is slow and the process expensive (Kaser et al., 2003). Thus, only a few dozen such records in the world exist that cover significant periods of time (i.e., decades; WGMS, 2008; Zemp et al., 2009), and there are currently no such long-term records for the HKH region (Kaser et al., 2006).
GEODETIC MASS BALANCE
MEASUREMENT
The geodetic method measures elevation changes of the glacial surface over time from various digital elevation models (DEMs) constructed over the entire glacial surface (Racoviteanu et al., 2008). This method can be applied using topographic maps, DEMs obtained by aircraft and satellite imagery, and by airborne laser scanning (Kaser et al., 2003). The accuracy of this method depends on (1) the interpolation method used to derive a DEM, (2) errors introduced by any change in spatial resolution, (3) biases inherent in the remote sensing—derived DEMs, and (4) density assumptions (Racoviteanu et al., 2008). Errors in the original DEMs propagate with each calculation and may introduce large errors in the end result. Because of these issues, it is recommended that the geodetic method only be used for mass balance measurements on decadal or longer timescales (Kaser et al., 2003; Racoviteanu et al., 2008).
HYDROLOGICAL MASS BALANCE
MEASUREMENT
The hydrological mass balance can also be used to estimate the glacial mass balance. The hydrological method uses a water-balance approach to compute glacial mass balance. The estimated net precipitation in the basin is subtracted from the net runoff to compute the water storage within the basin, which is then interpreted as due to changes in glacial mass balance (Braithwaite, 2002). Although this approach is con-
sidered to provide only a crude approximation and is not generally recommended (Barry, 2006), it was used for many years for the basin of the Grosse Aletsch in Switzerland (PSFG, 1967, 1973). The hydrological approach is difficult to use in the HKH area because of limited precipitation and discharge measurements. However, the approach does hold promise as more basins become instrumented with automatic weather stations and automated measurements of discharge height, as demonstrated for the Langtang Basin in Nepal by the recent International Centre for Integrated Mountain Development (ICIMOD) field class on glacial mass balance measurements.
REMOTE SENSING MEASUREMENTS
Remote sensing measurements are based on information gained by aerial sensing technologies installed on aircraft and satellites. Scientists are increasingly able to measure glacier properties over larger areas and longer time spans because of the increased availability of imagery from remote sensing platforms. Remote sensing yields information about glacier properties including glacier area, length, surface elevation, surface flow fields, accumulation/ablation rates, albedo, equilibrium line altitude (ELA), accumulation area ratio, and the mass balance gradient. The ELA, accumulation area ratio, and mass balance gradient respond to annual changes in temperature, precipitation, and humidity and are therefore important for mass balance monitoring. Changes in glacier area and terminus positions over timescales of several decades, which are relatively easy to determine from remote sensing imagery, have been used as indicators of a glacier’s response to climate forcing (Barry, 2006).
Remote sensing uses sensors that detect solar energy reflected by Earth’s features as well as the emission of the Earth’s own thermal energy (Figure C.1). Wavelength ranges (or bands) of interest to remote sensing of glaciers generally include visible light (VIS ranging from about 0.45 to 0.75 µm), near-infrared (NIR ranging from 0.75 to 1.4 µm), short-wavelength infrared (SWIR ranging from 1.4 to 3 µm), and thermal infrared (TIR ranging from about 8 to 15 µm). Sensors record the brightness temperature within a defined band that depends on the characteristics of the specific sensor, as illustrated for two different sensors in Figure C.1. For example, Band 2 of Landsat1 7 records the brightness temperature from 0.53 to 0.61 μm, often mapped as the blue band.
Snow and ice are characterized by (1) high reflectivity in the visible wavelengths, (2) medium reflectivity in the near-infrared, (3) low reflectivity and high emissivity in the thermal infrared, and (4) low absorption and high scattering in the microwave (Racoviteanu et al., 2008). Increasing amounts of black carbon quickly reduce the albedo of snow and ice.
The spatial resolution of a remote sensing image is critical to obtaining glacial properties in mountainous terrain, such as the ELA. A pixel size of 500 m on a side (e.g., MODIS)2 means that, in general, the remote sensing information can only detect changes that occur in lengths greater than 500 m.
Newer sensors can acquire data at medium spatial resolutions (5 to 90 m in multispectral mode), with larger swath widths (185 km for Landsat and 60 km for ASTER)3 and short revisit times (16 days for ASTER). These capabilities allow regular glacier mapping over extensive areas. The thermal band of Landsat Enhanced Thermal Mapper Plus (EMT+)4 (10.4 to 12.5 μm, at 60-m pixel size) and the multispectral thermal bands of ASTER (8.125 to 11.65 μm, at 90 m pixel size) could potentially distinguish debris cover on glaciers. The ASTER, SPOT5,5 IRS-1C,6 and CORONA KH-4, KH-4A and KH-4B7 can acquire stereoscopic images, which in turn provide elevation data that can be used for geodetic mass balance estimates (Racoviteanu et al.,
_________
1 Landsat is a series of Earth-observing satellite missions jointly managed by the National Aeronautics and Space Administration and the U.S. Geological Survey. More information about the pro gram is available at http://landsat.gsfc.nasa.gov/.
2 The Moderate Resolution Imaging Spectroradiometer is an instrument aboard the Terra (EOS AM) and Aqua (EOS PM) satellites. More information about the instrument is available at http://modis.gsfc.nasa.gov/.
3 The Advanced Spaceborne Thermal Emission and Reflection Radiometer is an instrument aboard the Terra (EOS AM) satellite. More information about the instrument is available at http://asterweb.jpl.nasa.gov/.
4 More information about this instrument is available at http://landsat.gsfc.nasa.gov/about/etm+.html.
5 A fifth-generation Earth observation satellite launched in 2002, the series of SPOT satellites were initiated by the French space agency and are run by Spot Image base in Toulouse, France.
6 India’s second generation remote sensing satellite.
7 A series of U.S. reconnaissance satellites launched between 1959 and 1972.
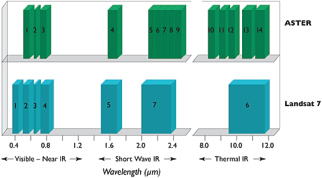
FIGURE C.1 Wavelength regions and bandwidths for two remote sensing satellites, Landsat 7 and ASTER. SOURCE: NASA Goddard Space Flight Center and U.S. Geological Survey.
2008). Thus, newer sensors with pixel sizes on the order of 3 to 30 m provide more accurate representations (and changes over time) of such parameters as glacial area, location of the glacier terminus, and location of the ELA.
Snow and ice are distinct from surrounding terrain in clear weather. Thick cloud cover can complicate such distinction. However, measurements of the 1.6 to 1.7 μm wavelengths (wavelength band 4 of ASTER) can overcome this issue. At these wavelengths, clouds are reflective but snow and ice are absorbing (Racoviteanu et al., 2008). Techniques including single-band ratios and the normalized difference snow index (NDSI) use the high brightness values of snow and ice in the visible wavelengths to distinguish them from darker rock, soil, or vegetation (Racoviteanu et al., 2008).8 The single-band ratio and NDSI techniques are also fast and robust, making them relatively easy to automate over extensive areas. Challenges to automatic mapping of glaciers using band ratios include (1) the presence of proglacial and supraglacial lakes, (2) the presence of fresh snow on surfaces other than a glacier, and (3) debris cover on glaciers (Racoviteanu et al., 2008). Lakes are misidentified as glacial ice because liquid water and ice have similar bulk optical properties in the visible and near-infrared wavelength. Glaciers always have snow above the ELA. However, surrounding bedrock, moraines, tundra, and other surfaces may also have snow. These snow-covered surfaces can easily be misclassified as part of a glacier. Care must be taken to discriminate snow on surrounding areas from snow on glaciers. Often multiple years of imagery are needed to do so.
Debris cover is one of the greatest challenges in remote sensing of glaciers. In the visible and near-infrared wavelengths, debris cover has optical properties very similar to the surrounding moraines. Automated methods of analyzing spectral information are ineffective in mapping ice covered by debris. However, manual digitization is time-consuming and subject to human error. Thus, debris on glaciers may result in underrepresenting glacial area and overcalculating rates of glacial retreat.
_________
8 NDSI is calculated as (VIS - SWIR)/(VIS + SWIR), where VIS is band 1 of ASTER (0.52-0.6 µm) at 15 m and SWIR is band 4 of ASTER (1.6-1.7 µm) at 30 m.


