
Functionalization of a Protosynaptic Gene Expression Network
![]()
CECILIA CONACO,*† DANIELLE S. BASSETT,‡§ HONGJUN ZHOU,*† MARY LUZ ARCILA,*† SANDIE M. DEGNAN,![]() BERNARD M. DEGNAN,
BERNARD M. DEGNAN,![]() AND KENNETH S. KOSIK*†#
AND KENNETH S. KOSIK*†#
Assembly of a functioning neuronal synapse requires the precisely coordinated synthesis of many proteins. To understand the evolution of this complex cellular machine, we tracked the developmental expression patterns of a core set of conserved synaptic genes across a representative sampling of the animal kingdom. Coregulation, as measured by correlation of gene expression over development, showed a marked increase as functional nervous systems emerged. In the earliest branching animal phyla (Porifera), in which a nearly complete set of synaptic genes exists in the absence of morphological synapses, these “protosynaptic” genes displayed a lack of global coregulation although small modules of coexpressed genes are readily detectable by using network analysis techniques. These findings suggest that functional synapses evolved by exapting preexisting cellular machines, likely through some modification of regulatory circuitry. Evolutionarily ancient modules continue to operate seamlessly within the synapses of modern animals. This work shows that the application of network techniques to emerging genomic and expression data can provide insights into the evolution of complex cellular machines such as the synapse.
______________
*Neuroscience Research Institute, †Department of Molecular, Cellular and Developmental Biology, ‡Department of Physics, and §Sage Center for the Study of the Mind, University of California, Santa Barbara, CA 93106; and ![]() School of Biological Sciences, University of Queensland, Brisbane, Queensland 4072, Australia. #To whom correspondence should be addressed. E-mail: kosik@lifesci.ucsb.edu.
School of Biological Sciences, University of Queensland, Brisbane, Queensland 4072, Australia. #To whom correspondence should be addressed. E-mail: kosik@lifesci.ucsb.edu.
In the tree of life, sponges (Porifera), generally recognized as the oldest surviving metazoan phyletic lineage (Fig. 1.1B), occupy a highly informative position for understanding the evolution of features that uniquely characterize animals (Srivastava et al., 2010). The synapse, a cellular machine formed through the dynamic assembly of multiple proteins that together perform a specific biological function, is one such metazoan specialization. The synaptic machinery delivers a chemical signal via vesicle fusion at the presynaptic neuronal membrane to postsynaptic receptors, which convert that signal back to an electrical impulse in the postsynaptic neuronal cell. Surprisingly, the genome of the Poriferan demosponge, Amphimedon queenslandica, contains an almost complete set of genes homologous to those found in mammalian synapses (Fig. 1.1A), although the organism does not assemble any structure morphologically resembling a synapse (Sakarya et al., 2007; Srivastava et al., 2010). Although limited gene innovation and the invention of new protein interaction sites can partially explain how preexisting genes came together to form the synaptic complex (Sakarya et al., 2010), the multiple evolutionary steps involved in building a cellular machine through the assembly of an interaction network that can operate as a unit with a discrete biological function remains unknown.
Changes in conserved transcriptional programs arising from modification of instructions encoded in the genome have contributed to our understanding of animal evolution (Barabási and Oltvai, 2004; Oldham et al., 2006, 2008; Brawand et al., 2011). Specific patterns of expression can define discrete tissues, cell types, and even functional protein complexes. Genes with similar expression patterns often have similar function (Eisen et al., 1998). Furthermore, when comparing orthologues across divergent species, highly conserved coexpression is a strong predictor of shared function in similar pathways (Quackenbush, 2003; Stuart et al., 2003; van Noort et al., 2003). These results suggest that functionally related genes might be under similar expression constraints (Carlson et al., 2006). Thus, changes in coexpression relationships for any group of genes may contain information on the assembly and evolution of cellular machines. To understand the evolutionary transition leading to the emergence of a functional synapse, we used network analysis to identify unique patterns of synaptic gene coexpression in representative species from diverse phylogenetic positions. We show that “protosynaptic” genes have an inherent modular structure and that the coregulatory links between these modules characterize species with functional synapses. In contrast, ancient eukaryotic cellular machines, such as the proteasome and nuclear pore, already operate in early metazoans, and their associated genes display highly correlated expression patterns over development. These findings
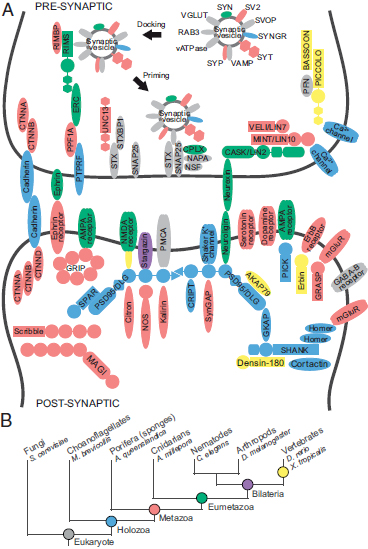
FIGURE 1.1 Origins of synaptic genes. (A) Homologues of genes in the human synaptic complex were identified in the genomes of selected organisms representing key phylogenetic steps in animal evolution. Colors indicate the inferred ancestor of origin for each gene, as indicated in B. (B) Evolutionary relationships among animal phyla. The names of representative species are shown. [Note: Figure can be viewed in color in the PDF version of this volume on the National Academies Press website, www.nap.edu.]
suggest that reorganization of gene expression, most likely through the modification of transcriptional regulation, was a key factor in the evolution of cellular machines such as the synapse.
To study functionalization of the synaptic gene network [Fig. 1.2A; Conaco et al. (2012, Fig. S1A)], we obtained the expression profiles of sponge synaptic gene homologues by sequencing the A. queenslandica transcriptome at four developmental stages from larva to adult. For comparison, expression data were also obtained for the same set of synaptic genes from five representative animals with varying complexities in tissue organization (Fig. 1.1B). Animal species included in this study were the cnidarian coral, Acropora millepora; invertebrate bilaterians, Caenorhabditis elegans (nematode) and Drosophila melanogaster (arthropod); and vertebrates,
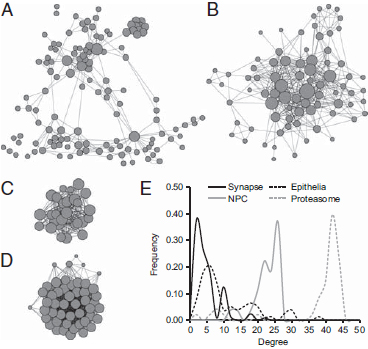
FIGURE 1.2 Structure of protein interactions within the (A) synaptic, (B) epithelial, (C) NPC, and (D) 26S proteasome networks. Each node represents a gene. Node size represents the number of interactions formed by a protein, and edge length is proportional to the strength of evidence for a functional link between two proteins. Network structures are based on the human interactome annotated in STRING (Snel et al., 2000) and visualized by using Cytoscape (Shannon et al., 2003). (E) Degree distribution patterns of gene networks based on the human interactome. The frequency of nodes that exhibit the indicated number of connections (degree) is shown.
Danio rerio (zebrafish) and Xenopus tropicalis (frog) (Hillier et al., 2009; Domazet-Lošo and Tautz, 2010; Graveley et al., 2011; Meyer et al., 2011; Yanai et al., 2011). The correlation matrix for synaptic gene homologues from each species was constructed by computing the Pearson correlation coefficient between all pairs of gene expression profiles across development (Fig. 1.3A). The correlation matrix represents a network in which the genes are nodes and the correlations between gene expression patterns are edges. We averaged all elements of the correlation matrix to obtain a measure of connectivity or coregulation, R (Fig. 1.3B, D, F, and H). By using a community detection algorithm (Girvan and Newman, 2002; Blondel et al., 2008; Porter et al., 2009), the modularity, Q, of each network was computed by determining the optimal partition of the network into communities whose nodes were more connected to other nodes inside of their own community than expected in a random null model (Fig. 1.3C, E, G, and I). The modularity, Q, can be interpreted as a measure of the cohesiveness of coregulation: higher Q values indicate more segregation between coregulated groups. To determine the statistical significance of our results, we computed the same properties (R and Q) for various random control models.
The synaptic gene expression profiles were more highly correlated in eumetazoan species than in the sponge (Fig. 1.3B). This is apparent in the cnidarian coral, A. millepora, which possesses nerve cells organized into a simple diffuse net. The bilaterian synaptic gene networks showed even greater coregulation compared with sponge or coral. Synaptic genes showed significantly increased correlation compared with permuted and random controls in all species [Fig. 1.3B; Conaco et al. (2012, Table S1)]. To verify the observed differences in expression coregulation, we performed pairwise comparisons of subsets of synaptic genes common between species. Comparison of genes found in sponge and the other five species showed that the increased correlation in eumetazoans was significant [P < 1 × 10⁻⁵, two-tailed t test; Conaco et al. (2012, Table S2)]. Pairwise comparison of average coregulation for genes common between coral and each of the other species further revealed significantly greater correlation in bilaterian organisms (P < 1 × 10⁻¹⁰, two-tailed t test). These pairwise correlation values were significantly greater than coregulation within three separate random control models (P < 0.05, two-tailed t test; Materials and Methods). However, Q values for most of the synaptic gene networks did not show the consistent decrease relative to controls that would be expected in a set of genes that were coherently coregulated. This suggests that the synaptic gene network is composed of subsets of genes with distinguishable differences in their developmental expression patterns, similar to what we would expect from a random collection of genes taken from the transcriptome. These distinct modules may be performing
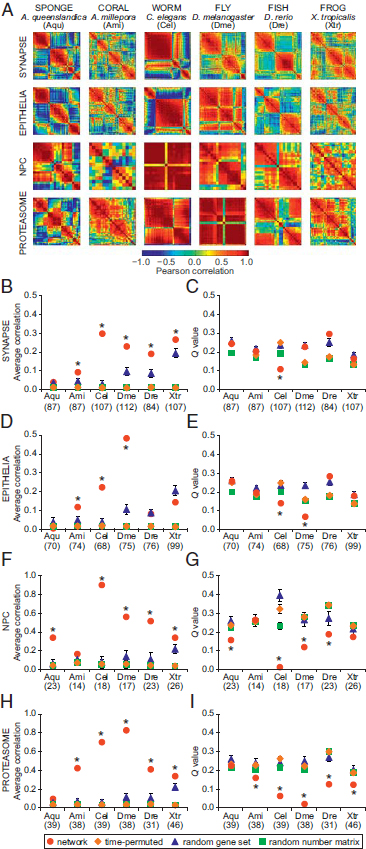
disparate activities that are necessary for the overall function of the synaptic machinery [Fig. 1.3C; Conaco et al. (2012, Table S1)].
The detection of coregulated gene communities is a data-driven process that is not biased by any prior knowledge of function. We sought to determine whether functionally defined subsets of synaptic proteins corresponded to the gene communities found in the coregulation modules. Nodes in the synaptic protein interaction network of each species were colored according to the coregulation module from which they were derived (Fig. 1.4A). Module composition (i.e., node colors) of the three largest functional complexes were tabulated (Fig. 1.4B). Those genes that comprise the postsynaptic density tended to fall within a single module for most eumetazoans. This same tendency was also true for the synaptic vesicle genes in most bilaterians. In contrast, sponge synaptic genes in these functional complexes showed a more heterogeneous expression pattern that appeared to follow a different regulatory logic than that of functional synaptic networks, as reflected by the greater diversity in module composition within each biological complex. One striking exception is the vacuolar ATPase complex (vATPase), which is tightly coregulated even in sponge, suggesting a gain of functionality long before animal divergence (Finnigan et al., 2012). It should be noted, however, that, although we did not see similar module enrichment patterns for these functional complexes in the frog, we did observe a strong correlation of synaptic gene expression in this species (Fig. 1.3A).
FIGURE 1.3 Correlation and modularity analysis for gene networks in six organisms. (A) The strength of genetic coregulation for any two genes in a network was estimated by computing the Pearson correlation coefficient of their expression across developmental stages. Heat maps represent N×N correlation matrices for genes in each network in each species (red, positive correlation; blue, negative correlation). (B, D, F, and H) Average correlation, R, was computed from the matrices in A. (C, E, G, and I) The presence of distinct coregulated modules was estimated by the Q value (Blondel et al., 2008). The computations for each true network (red circles) were also performed on control datasets: time-permuted (1,000 randomly scrambled versions of the correlation matrix, orange diamonds), random gene set (100 gene sets of size N randomly sampled from the entire transcriptome, blue triangles), and random number matrix (100 matrices generated with the same gene number and developmental stages as the true network, green squares). The number of genes included in the analysis for each network in each species is shown in parentheses. Error bars represent SD of R and Q; some SDs are smaller than the marker size. Asterisks indicate a significant difference from the random gene set control (P < 0.05, two-tailed t test). [Note: Figure can be viewed in color in the PDF version of this volume on the National Academies Press website, www.nap.edu.]
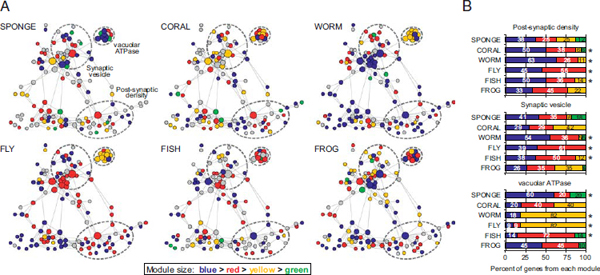
FIGURE 1.4 Functionally defined protein complexes correspond to detected coregulation modules. (A) Genes in the synaptic network of each species were assigned to coregulation modules by modularity optimization. Genes were colored according to the module from which they are derived (module size: blue > red > yellow > green). Genes in gray are not represented in the organism or have no available expression data. Dashed circles represent the approximate boundaries of the postsynaptic density, synaptic vesicle, and vATPases. (B) Percent of genes in each functional complex that belong to coregulation modules detected by modularity optimization. Colors correspond to the gene modules in A. Asterisks indicate complexes for which ≥50% of genes belong to the same coregulation module. Only genes with available expression data in each species were included in the analysis. [Note: Figure can be viewed in color in the PDF version of this volume on the National Academies Press website, www.nap.edu.]
Like the synaptic network, the epithelial network also lacks a morphological correlate in the sponge. In epithelial cells, the adherens junction links to apical-basal polarity genes and Wnt/planar polarity genes [Fig. 1.2B; Conaco et al. (2012, Fig. S1B)]. Although A. queenslandica expresses many orthologues of epithelial genes, the sponge exhibits only rudimentary features of a functional epithelium (Adams et al., 2010; Fahey and Degnan, 2010). As in the synaptic gene set analysis, we extracted the expression patterns of epithelial genes from six species and calculated the average correlation, R, and modularity, Q, of the coregulation network (Fig. 1.3D and E). The epithelial network in all species that were tested showed significantly greater R when compared pairwise vs sponge [P < 1 × 10⁻⁸, two-tailed t test; Conaco et al. (2012, Table S2)]. As in the synaptic network, the modularity of epithelial networks was not consistently lower compared with random controls for most of the species tested.
Neurons and epithelial cells and their defining cellular machines appear in eumetazoans after sponges diverged from other animals. We asked whether genes drawn from more ancient machines present in all eukaryotes might show a different pattern of expression characteristic of machines that were functionalized before the origin of animals. We performed a similar modularity optimization on transcriptome data for homologues of genes in the nuclear pore complex (NPC) and the 26S proteasome [Fig. 1.2C and D; Conaco et al. (2012, Fig. S1C and D)]. These networks are highly interconnected and exhibit a negatively skewed degree distribution, which differs from the relatively large hubs and positively skewed degree distribution observed in mammalian synaptic and epithelial networks (Fig. 1.2E).
The nuclear envelope is a defining feature of eukaryotic cells (Wente and Rout, 2010). Transport of molecules between the nucleus and cytoplasm is mediated by the NPC, which is made up of approximately 30 nucleoporin genes. Coregulation analysis of nucleoporin homologues represented in the transcriptome set revealed higher average correlation and generally lower modularity compared with the synaptic or epithelial networks in the same species (Fig. 1.3F and G). Most of the NPC networks showed consistently greater R and lower Q compared with permuted or random size-matched data, suggesting that the components of the NPC act as a single functional unit (Conaco et al., 2012, Table S1). In contrast, greater modularity of the synaptic and epithelial polarity networks suggests a requirement for some modularity in the operation of these machines, perhaps as a result of the presence of ancient submachines, such as the vATPase community.
The 26S proteasome is a well-conserved protein degradation machine composed of products from more than 31 genes (Voges et al., 1999). Coregulation analysis of homologues of proteasomal genes revealed that, like the NPC, the proteasome has higher average correlation and lower modularity
compared with the synaptic or epithelial networks within each species (Fig. 1.3H and I). All eumetazoans showed significantly higher correlation when compared pairwise vs. sponge (P < 1 × 10-52, two-tailed t test; Conaco et al., 2012, Table S2). Coregulation and modularity of proteasomal genes differed significantly from permuted or random data, except in the sponge (Conaco et al., 2012, Table S1). Nevertheless, in all species tested, including the sponge, the proteasome gene set emerged as a distinct community when analyzed together with NPC genes (Fig. 1.5) and is therefore likely to represent a functionally significant module.
In a unicellular eukaryote, like the yeast, Saccharomyces cerevisiae, the NPC and proteasome gene networks exhibit high correlation and low modularity that are quite similar to the average values observed for the metazoans (Conaco et al., 2012, Table S1). These findings further support the hypothesis that gene networks that establish their modern function long before the origin of metazoa exhibit significantly higher correlation and lower modularity, consistent with a greater and more homogeneous connectivity between genes.
These results show that data-driven detection of transcriptional expression patterns can reliably reveal a reorganization of gene networks in association with the emergence of their modern collective function from the unknown functions of these same gene sets in the common animal ancestor. This reorganization appears as increased connectivity and a change in the network structure with functional complexes clustering into coregulated modules. In contrast, more ancient machines, such as the proteasome and the NPC, show a cohesiveness of expression as far back as the eukaryotic ancestor.
DISCUSSION
Synaptic proteins must be available in concentrations that drive self-assembly by mass action according to the affinities among their various interaction domains. Among the core features of synapses are scaffolding proteins that position receptors and ion channels in register with synaptic vesicles across the synaptic cleft and link the pre- and postsynaptic elements to intracellular signaling cascades. Coordinated expression of these proteins, as well as the affinity of the interactions, are among the drivers
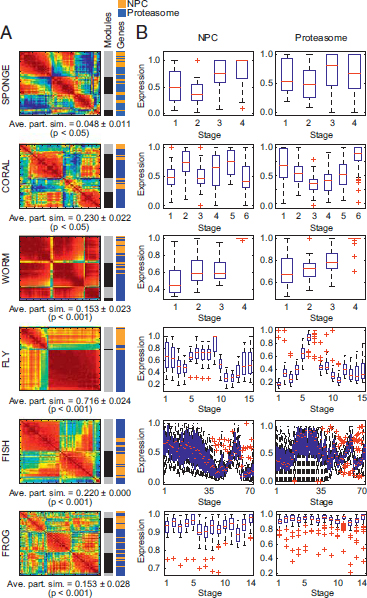
FIGURE 1.5 Modularity optimization detects biologically relevant gene communities. (A) Heat maps represent the N×N Pearson correlation matrices for union networks of NPC and proteasome genes (red, positive correlation; blue, negative correlation). Average partition similarities (ave. part. sim.) computed from permutation testing with 1,000 iterations showed that, compared with the randomly scrambled gene set, genes in the union network clustered into communities that more closely recapitulated the true partition between networks (P < 0.05). Color bars to the right of the heat maps indicate the boundaries of detected coregulation modules (Modules) and the relative location of NPC (orange) and proteasome (blue) genes within the detected communities (Genes). (B) Box plots show the developmental expression patterns of genes within the NPC (Left) and prote-asome network (Right) for each of the six representative species. [Note: Figure can be viewed in color in the PDF version of this volume on the National Academies Press website, www.nap.edu.]
of synapse assembly. Positive selection at specific sites in PDZ scaffolds appear to have roles in determining the binding partners of these highly connected proteins (Sakarya et al., 2010), an observation consistent with network growth by link dynamics, that is, link detachment and attachment (Berg et al., 2004). Just as mutations in coding sequences can change link dynamics and enable new protein–protein interactions, mutations in cis regulatory sequences can lead to the evolution of new transcriptional linkages and coexpression of gene batteries that were not previously associated. In fact, the sponge already possesses homologues of genes that function in bilaterian neurogenesis, although it is yet to be determined if these factors were responsible for a biological unit originating in the sponge ancestor that was selected for an unknown function and later exapted to assemble the synapse (Richards et al., 2008). These conserved bilaterian developmental and neurogenic genes are associated with spatial patterning of the cnidarian nerve net (Marlow et al., 2009; Layden et al., 2012). Further modification of gene regulatory mechanisms in vertebrates placed many synaptic genes under the control of the transcriptional repressor, REST, thus ensuring exclusive and coordinated expression in neurons (Schoenherr and Anderson, 1995; Bruce et al., 2004; Otto et al., 2007).
The hierarchical structure of gene regulatory signaling networks that control the body plan are thought to evolve by changes in cis regulatory regions resulting in changes in timing, level, and location of gene expression (Peter and Davidson, 2011). In contrast, the network edges of cellular machines represent physical interactions rather than a cascade of signaling events (Spirin and Mirny, 2003). Nevertheless, the resolution of a signaling or interaction network depends on the extent of coregulatory data available to inform the graph edges. Our analysis required that we compare the coregulation and modularity of the same set of genes; however, inclusion of genes linked to the synaptic network that are not shared between the comparison groups would likely improve the coregulation signal as gene innovation and duplication can affect network structure through dynamic interactome rewiring (Arabidopsis Interactome Mapping Consortium, 2011). Although these limitations increase the likelihood of detecting biologically spurious correlations and may contribute to the apparent modularity observed in some random gene sets, the ability of the community detection algorithm to partition genes into their respective cellular machines indicates a functional correlate of the structural communities derived simply from transcriptional coregulation (Fig. 1.5). The generation of more transcriptomes at finer temporal and spatial resolution and the sequencing of genomes from other basal metazoans, as well as improved homologue detection, may strengthen or weaken an alternative explanation that the gene expression patterns in A. queenslandica represent a loss of more ancient gene regulatory patterns.
Evolutionary growth of gene interaction networks is a key facet of organismal complexity. Several publications have claimed that gene expression networks are scale-free (Barabási and Oltvai, 2004), and although no rigorous proof of the claim exists, many gene expression networks do display a tail in their degree distributions, indicating the presence of large hubs. Interestingly, one particular model of scale-free network growth suggests that (i) networks expand continuously by the addition of new nodes, and (ii) new nodes attach preferentially to sites that are already well connected (Udny Yule, 1925). Gene number has not increased by much over the course of metazoan evolution. Thus, the expansion of gene interaction networks, which is required to functionalize metazoan cellular machines, places an exceptionally high premium on enhancing coregulatory patterns between existing genes.
CONCLUSIONS
By using genomewide transcriptome data, we tracked the expression of a common set of synaptic genes in a representative sampling of the animal kingdom. In bilaterians, the expression of synaptic genes is strikingly well coordinated, with smaller coregulation modules detectable within the expression matrix. A particularly prominent module is the vATPase complex found within the presynaptic gene set. Interestingly, synaptic genes in the earliest branching metazoan phyla (Porifera) exhibit a lack of global coregulation compared with eumetazoans with functional nervous systems. Protosynaptic gene expression modules from the sponge, A. queenslandica, which lacks synapses and a nervous system, but possesses a nearly complete complement of synaptic genes, are organized into independent communities. These findings suggest that functional synapses evolved through the exaptation of preexisting genes and smaller cellular machines, presumably by modification of regulatory circuitries resulting in coordinated neuronal expression. This work demonstrates that the modularity approach based on network theory provides a very simple and data-driven method for the identification of gene communities, linking this study to a larger array of network diagnostics that could be used in subsequent investigations of the topological organization of gene coexpression networks across species.
MATERIALS AND METHODS
Expression Data
Genes in the synaptic, epithelial, NPC, and 26S proteasome networks were compiled from the literature (Voges et al., 1999; Fahey and Degnan, 2010; Srivastava et al., 2010; Wente and Rout, 2010). Protein interaction
networks were based on the human interactome annotated in STRING (Snel et al., 2000) and visualized by using Cytoscape (Shannon et al., 2003). Homologues for genes in these networks were determined by reciprocal best-hit BLAST alignments of human gene sequences to the genome of each species of interest. Expression data for gene homologues were extracted from transcriptomes obtained by RNA sequencing of four developmental stages in sponge, A. queenslandica (Conaco et al., 2012, SI Materials and Methods); six experimental treatments of coral larvae, A. millepora (Meyer et al., 2011); four developmental stages in worm, C. elegans (Hillier et al., 2009); and 15 developmental stages in fly, D. melanogaster (Graveley et al., 2011). Microarray data for 70 developmental stages in zebrafish, D. rerio (Domazet-Lošo and Tautz, 2010), and 14 developmental stages in frog, X. tropicalis (Yanai et al., 2011), were also included. Microarray expression data for the yeast, S. cerevisiae, were obtained from cultures grown to stationary phase (Gasch et al., 2000). To compare expression patterns in transcriptomes obtained by using different methods, the expression for every gene within each dataset was normalized to its maximum value across development (Conaco et al., 2012, Dataset S1).
Coregulation and Modularity Analysis
For each organism, the strength of genetic coregulation of any two genes throughout development was estimated by computing the Pearson correlation coefficient of expression for those two genes over development. By estimating the coregulation strength for all possible pairs of genes, we constructed organism-specific N×N coregulation networks in which genes were represented by nodes and connections between genes were weighted by the correlation between their expression levels over development. These coregulation networks were characterized by two diagnostic variables: the average correlation, R, and the modularity, Q, as defined in the following paragraphs.
The first diagnostic, the average correlation R, provides a measure of within-network connectivity which can be interpreted as a measure of coregulation. Significant differences in network coregulation between species were identified using pairwise two-tailed t tests of the correlation matrix elements. For these tests, correlation matrices were computed only for the sets of genes that were common between the two species being compared. These union gene sets for pairwise comparisons were constructed without duplicates by using only genes with the best BLAST score to the human protein sequence.
The second diagnostic, the modularity Q, provides a measure of community structure in the coregulation matrix. Importantly, the correlation matrix we used to examine the amount of coregulation (R) can equivalently
be viewed as a complex network in which gene–gene edges are signed (i.e., positive or negative correlations) and weighted (correlations range from -1 to 1). In each organism’s coregulation network, we tested for the presence of uniquely coregulated groups of genes by using the community detection approach (Porter et al., 2009) of optimizing modularity (Girvan and Newman, 2002) by using the Louvain method (Blondel et al., 2008) [note that a second heuristic, spectral optimization (Newman, 2006), gave nearly identical results: r = 0.9960, P < 0.01; Conaco et al. (2012, Table S3)]. We define the correlation matrix A and then define wij+ to be an N×N matrix containing the positive elements of Aij and wij- to be an N×N matrix containing only the negative elements of Aij. The quality function to be maximized is then given by the following equation:
![]()
where gi is the community to which node i is assigned, gj is the community to which node j is assigned, γ+ and γ- are resolution parameters, and the following equation applies (Traag and Bruggeman, 2009):
![]()
As evident from Eq. (1), two free parameters in the optimization of modularity for such a signed, weighted network exist (Gómez et al., 2009): the resolution parameters γ+ and γ- (Fortunato and Barthélemy, 2007). For simplicity in the present analysis, we chose the traditional value of γ+ of 1.0 and set γ- as 0.1 to dampen the effect of negative correlations. Particular emphasis was placed on the positive correlations in the coregulation matrix for two reasons. First, we noted that most gene sets had significantly more positive correlations, and in fact some gene sets had no negative correlations at all (e.g., worm NPC). To ensure that our analysis was consistent across both organisms and machines, we dulled the influence of negative correlations by setting γ- to be an order of magnitude smaller than γ+. Secondly, we noted that the positive correlations showed considerably more topological organization than the negative correlations (Conaco et al., 2012, Fig. S2). Further details are provided in Conaco et al. (2012, SI Materials and Methods).
We further examined the dependence of our results on the choice of γ+. We varied γ+ from 0 to 2 in intervals of 0.1. We find that, for values of γ+ higher than 1, the network disintegrates into a large number of communities (Conaco et al., 2012, Fig. S3). Our results therefore focus on the smallest yet still coherent modular structures present in these systems.
Robustness and Statistical Validity
To examine the robustness and statistical validity of our findings, we assessed the reliability of the group partitions and tested our results against three separate postmodularity-optimization null models as described in the following paragraphs.
The problem of optimizing the modularity quality function is nondeterministic polynomial-time–hard. It is therefore important to demonstrate that the heuristics that we used produce robust results, that is, that the partitions found by iterative optimizations are highly similar. For each organism and each machine, we calculated the partition similarity (Danon et al., 2005) (which is bounded in [0,1]) between 100 separate optimizations. We found that the average partition similarity was >0.8 for most organisms and machines, with the mean over organisms and networks being even higher (Conaco et al., 2012, Table S1).
In addition to quantifying the reliability of our findings, we examined the statistical validity of our results by comparing the diagnostic variables (Rʹ and Qʹ) derived from the true network to those derived from networks constructed from three separate random null models: true random (random number matrix), time-permuted, and random gene set. The true random null-model network is constructed by generating uniformly distributed random numbers for the same number of genes and developmental stages found in the true dataset (100 instantiations). A coregulation matrix is then constructed and Rʹ and Qʹ are calculated. The time-permuted null-model network is constructed by randomly scrambling the order of expression for each gene within the network (1,000 instantiations), recomputing the coregulation matrix, and calculating Rʹ and Qʹ. The random gene set null-model network was constructed by extracting the expression data for an identically sized randomly chosen set of genes from the whole transcriptome (100 instantiations). Further details are provided in Conaco et al. (2012, SI Materials and Methods). The statistical significance of the true R and Q values was examined by using a one-sample t test in comparison with the R’ and Q’ values, respectively, for each random null model (Conaco et al., 2012, Table S1). We noted that the level of background correlation and modularity observed within sets of N genes randomly selected from each of the transcriptomes is variable (Conaco et al., 2012, Fig. S4). One possible explanation for these differences is that the transcriptome datasets were obtained by using different methods.
Biological Relevance of Detected Modules
We asked whether the modules detected from the coregulation matrix could represent functional entities. We began by calculating the correlation
matrix R2 between the combined gene set of the proteasome and NPC for each species. We optimized the modularity quality function to partition this combined matrix into groups in a data-driven manner. We next asked whether this data-driven partition was statistically similar to the true partition of the genes into the two groups of proteasome genes and NPC genes. To answer this question, we computed the partition similarity between the data-driven partition and the true partition and used permutation testing to determine whether this similarity was statistically significant. The permutation test was implemented by randomly reassigning genes to the two groups of “proteasome” and “NPC,” recomputing the correlation matrix R2ʹ, partitioning the genes in the correlation matrix into modules, and computing the similarity between this partition and the true partition. This process was repeated 1,000 times to construct a distribution of similarity values expected under the null hypothesis that the coregulation patterns between proteasome and NPC genes do not differ. For each species, the P value to reject this null hypothesis was computed as follows: the number of similarity values derived from the permuted data that were greater than the real similarity value, divided by the number of permutations.
ACKNOWLEDGMENTS
We thank Boris Shraiman, Mason Porter, Adel Dayarian, and Marija Vucelja for invaluable suggestions and comments; Scott Grafton and Jean Carlson for facilitating the collaboration; and Marc Kirschner and Leonid Peshkin for sharing Xenopus tropicalis microarray data. This work was supported by gifts from Harvey Karp and Gus Gurley (K.S.K.); David and Lucile Packard Foundation (D.S.B.); Public Health Service Grant NS44393 (to D.S.B.); Institute for Collaborative Biotechnologies Contract W911NF-09-D-0001 from the U.S. Army Research Office (to D.S.B.); and the Australian Research Council (S.M.D. and B.M.D.).
The data reported in this chapter have been deposited in the Gene Expression Omnibus (GEO) database, www.ncbi.nlm.nih.gov/geo (Accession No. GSE29978).


