
2
Poorer Health Throughout Life
The previous chapter documented that life expectancy in the United States is shorter than in other high-income countries and identified the principal causes of death that account for this difference. However, health involves much more than staying alive. The goal of a healthy life is freedom from illness and injury: “Health is a state of complete physical, mental, and social well-being and not merely the absence of disease or infirmity” (World Health Organization, 1948). Thus, health is measured not only by mortality, but also morbidity and quality of life.
This chapter looks at cross-national comparisons of physical and psychological illnesses, injuries, and biological risk factors across the life course, from infancy to old age, with a special focus on childhood and adolescence. The panel chose to focus on youth for four reasons:
1. Previous research has concentrated on understanding the U.S. health disadvantage after age 50 (the age group for which most data are available), not on the question of whether there is a similar disadvantage for younger Americans. This is hardly an academic question. Young adults are among the most productive members of modern economies, and children and young adults will lead the next generation and determine the future strength and well-being of the nation. A health disadvantage early in life has profound implications for everyone.
2. The health problems facing children, adolescents, and young adults are often quite different from those affecting other age groups. As documented in Chapter 1, the U.S. mortality disadvantage is driven
by different causes at different ages: before age 50, these causes include conditions in infancy, nonintentional injuries, violence, and diseases of the heart and circulatory system at ages 30-50 (Palloni and Yonker, 2012).
3. The health and well-being of young people may help explain health disadvantages that emerge later in life. For example, approximately 80 percent of adults who are regular users of cigarettes or alcohol start these behaviors as adolescents (Kalaydjian et al., 2009; Oh et al., 2010; Viner, 2012). High rates of obesity among children and adolescents can track into adulthood and shed light on patterns of heart disease and diabetes among older people (Tirosh et al., 2011). Exposure to these risk factors, among others, and the pathophysiological damage they inflict generally occurs over many years before the disease processes they induce reach the point of producing clinical symptoms, yet they may play a vital role in understanding disease outcomes later in life.
4. The causal pathways that link early life health risks with subsequent diseases may involve many aspects of development that are seemingly unrelated. For example, health challenges in early life can disrupt intellectual and emotional development, impede physical growth, and limit education and employment opportunities (Fletcher and Richards, 2012), which in turn may set up a lifetime of socioeconomic disadvantage (see Chapter 6). Conditions of austerity may restrict access to health care (see Chapter 4) and limit opportunities to pursue healthy behaviors (see Chapter 5) or live in neighborhoods that promote good health (see Chapter 7).
This chapter compares, for each age group, a set of health indicators in the United States with those in a comparable group of other high-income or “peer” countries. The chapter focuses on illnesses and injuries, not unhealthy behaviors or other modifiable risk factors (health behaviors such as smoking and unhealthy diets are examined in Chapter 5). Unlike the previous chapter, which examined a relatively precise outcome, death, this chapter investigates a more general one, health. Health is more challenging to measure and quantify because it is multidimensional, and it reflects the culmination of a complex set of factors that include exposure to risk (or protective) factors and susceptibility (or resistance) to illness and injury. It is especially difficult to assess cross-national differences in health because of inconsistent data and metrics, conflicting findings, and in many cases, the absence of comparable data. This chapter critically examines the data that are currently available, and Chapter 9 outlines research priorities that will produce a stronger empirical basis for future work on this topic.
The panel commissioned two special analyses of health under age 50. For the first analysis, Palloni and Yonker (2012) collated data for the same 17 peer countries discussed in Chapter 1 and examined the results across four age groups: infancy and early childhood (ages 0 to 4), late childhood and adolescence (ages 5-19), early adulthood (ages 20-34), and middle adulthood (ages 35-49).1 The analysis drew on data from the World Health Organization (WHO), the Global Burden of Diseases, Injuries, and Risk Factors Study (GBD 2010 Study), UNICEF, and statistics that OECD has compiled from various national sources and household surveys conducted in its member countries. The second analysis, by Viner (2012), examined mortality rates by cause in the United States and 26 other high-income countries2 for five age groups—1-4, 5-9, 10-14, 15-19, and 20-24—and then reanalyzed the data for the 17 peer countries of interest to the panel. These data were drawn from the WHO World Mortality Database.
The panel also commissioned a third analysis of data from the National Health and Nutrition Examination Survey in the United States (NHANES) and the Survey of Health, Ageing and Retirement in Europe (SHARE), in which Crimmins and Solé-Auró (2011) compared the cardiovascular risk profile of adults at age 50 in the United States and other high-income countries.
The data presented in this chapter are subject to important limitations. As already noted, there is no single measure of health status across the life course, and comparable data on many important health measures are not available across all countries. The available data often cover a very narrow (recent) time period and do not extend far enough back in time to capture health determinants that may explain current patterns. Ideally, longitudinal data would be used to examine changes in health conditions over time. Comparisons of national indicators also mask important within-country health disparities: a country’s low ranking on any indicator may be a reflection of a health disadvantage in certain segments of the population or some geographic regions. Finally, despite any adjustments or harmonization, most data were not originally collected for the purposes of this report. The
_________________
1Age groups cannot always be defined consistently across data sources. Dividing the life course into age groups is largely a matter of convenience, although each phase of life pre-sents different health challenges and opportunities, developmental milestones, and crucial transitions.
2These 27 countries are Australia, Austria, Canada, Chile, Denmark, Estonia, Finland, France, Greece, Hungary, Iceland, Ireland, Israel, Italy, Japan, Luxembourg, Mexico, the Netherlands, New Zealand, Norway, Poland, Portugal, Spain, Sweden, Switzerland, the United Kingdom, and the United States.
inferences we draw are dependent on the validity of the ranking methodology and the quality of the source data on which they are based.
Table 2-1 presents data on health outcomes from the analysis by Palloni and Yonker (2012). For each indicator, the table presents the range (and average) of peer country values, along with the U.S. value and ranking3 relative to the other countries. The final column presents a composite ranking for the United States that standardizes and combines the distributions of each age-specific measure.4
Between 2001 and 2006, mortality rates for children aged 1-19 were higher in the United States than in all peer countries except Portugal. Most OECD countries had mortality rates between 15 and 25 deaths per 100,000 children; the U.S. rate was 32.7 (National Center for Health Statistics, 2011). For decades, the mortality disadvantage experienced by U.S. youth relative to their peers in other countries has followed a U-shaped pattern: the United States has exhibited higher infant mortality rates than the OECD average, comparable mortality rates at ages 1-9, and higher mortality rates at older ages, especially after age 15 (Viner, 2012).
Two recent international reports have also found that the overall well-being of U.S. children is quite low relative to other rich nations, at least according to the composite measures used in the studies. In a report by OECD (2009a), the United States ranked 24 out of 30 countries on children’s well-being for health and safety.5 A UNICEF (2007) report also found that children in the United States ranked poorly (21st out of 21 countries) based on selected indicators of child well-being.6
_________________
3Rankings are calculated from a standardized distribution that includes all OECD countries in the comparison set. The principal unit of analysis is the individual in the designated age group.
4The “composite rank” is the rank order of the averaged z-scores across indicators: see footnotes in Table 2-1 for details on how this was calculated.
5The OECD report examined six areas of child well-being: material well-being, housing and environment, educational well-being, health and safety, risk behaviors, and quality of the school day (OECD, 2009a).
6The UNICEF score was based on country statistics for low birth weight, infant mortality, breastfeeding, vaccinations, physical activity, mortality, and suicides (UNICEF, 2007).
| Age Group (years) |
Measure | Range (average) | U.S. Data |
U.S. Ranka | |
| By Indicator |
Composite for Age Group |
||||
| 0-4 | Stillbirthsb | 2.0-3.9 (2.9) | 3.0 | 11 | 17 |
| Low birth weightc | 4.2-9.6 (6.6) | 8.2 | l6 | ||
| Perinatal mortalityd | 3.0-11.9(57) | 6.6 | 13 | ||
| Neonatal mortalitye | 1J-4.4 (2.7) | 4.4 | 17 | ||
| Infant mortalityf | 2.5-6.7 (3.9) | 6.7 | 17 | ||
| Days of life lost,g females | 0.05-0.12(0.07) | 0.12 | 17 | ||
| Days of life lost,g males | 0.05-0.15(0.09) | 0.15 | 17 | ||
| 5-19 | Overweight,h girls | 13.1-35.9 (22.6) | 35.9 | 17 | 17 |
| Overweight,h boys | 12.9-35.0(22.4) | 35.0 | 16 | ||
| Denial cariesi | 0.7-2.1 (1.1) | 1.2 | 11 | ||
| Good health,j females | 45.3-96.6 (86.4) | 96.6 | 1 | ||
| Good health,j males | 49.8-97.1 (89.8) | 97.1 | 1 | ||
| Youth HIV,k females | 0.0-0.5 (0 .2) | 0.3 | 14 | ||
| Youth HIV,k males | 0.1-0.7 (0.3) | 0.7 | 16. | ||
| Adolescent birthsl | 5-41 (12) | 41 | 17 | ||
| Adolescent suicidesm | 2.4-12.2(6-5) | 7.7 | 11 | ||
| Days of life lost,g females | 0.10-0.21 (0.12) | 0.21 | 17 | ||
| Days of life lost,g males | 0.16-0.37(0.21) | 0.37 | 17 | ||
| 20-34 | Good health,i females | 41.1-93.4 (80.5) | 92.6 | 2 | 17 |
| Good health,i males | 42.8-93.9 (83.4) | 93.9 | 1 | ||
| Average BMI,n females aged 20-24 | 20.1-25.6(22.9) | 25.6 | 17 | ||
| Average BMI,n males aged 20-24 | 22.2-26.3(24.1) | 26.3 | 17 | ||
| Average BMI,n females aged 25-14 | 20.9-27.1 (24.0) | 27.1 | 17 | ||
| Average BMI,n males aged 25-14 | 23.3-27.8 (25.8) | 27.8 | 17 | ||
| Diabetes,o females | 0.9-2.3 (1.6) | 2.3 | 17 | ||
| Diabetes,o males | 1.6-4.1 (2.9) | 4.1 | 17 | ||
| Average FPG,p females | 4.6-5.1 (4.9) | 5.1 | 17 | ||
| Average FPG,p males | 4.9-5.4 (5.2) | 5.4 | 17 | ||
| Age Group (years) |
Measure | Range (average) | U.S. Data |
U.S. Ranka | |
| By Indicator |
Composite for Age Group |
||||
| 20-34 | Average BP,q females | 106.5-115.9 (111.3) | 107.9 | 3 | |
| Average BP,q males | 118.8-129.8(124.0) | 118.8 | 1 | ||
| Average cholesterol,r females | 4.4-4.8 (4.7) | 4.8 | 11 | ||
| Average cholesterol,r males | 4.7-5.1 (4.9) | 4.8 | 6 | ||
| Maternal mortalitys | 2.0-14.9 (6.0) | 13.7 | 16 | ||
| Days of life lost,g females | 0.20-0.43 (0.26) | 0.43 | 17 | ||
| Days of life lost,g males | 0.34-0.77 (0.47) | 0.77 | 17 | ||
| 35-49 | Average BMI,n females aged 35-44 | 21.9-28.8 (25.6) | 28.8 | 17 | 17 |
| Average BMI,n males aged 35-44 | 24.0-29.0 (27.0) | 29.0 | 17 | 17 | |
| Average BMI,n females aged 45-54 | 22 7-29.9 (26.9) | 29.9 | 17 | ||
| Average BMI,n males aged 45-54 | 24.1-29.5 (27.7) | 29.5 | 17 | ||
| Diabetes,o females aged 35-44 | 1.7-4.7 (3.1) | 4.5 | 16 | ||
| Diabetes,o males aged 35-44 | 3.2-7.1 (5.1) | 7.1 | 17 | ||
| Diabetes,o females aged 45-54 | 3.6-9.7 (6.2) | 9.3 | 16 | ||
| Diabetes,o males aged 45-54 | 6.4-14.1 (9.9) | 14.1 | 17 | ||
| Average FPG,p females aged 35-44 | 4.8-5.4 (5.1) | 5.4 | 16 | ||
| Average FPG,p males aged 35-44 | 5.1-5.7 (5.4) | 5.7 | 17 | ||
| Average FPG,p females aged 45-54 | 5.0-5.7 (5.4) | 5.7 | 16 | ||
| Average FPG,p males aged 45-54 | 5.4-6.0 (5.7) | 6.0 | 17 | ||
| Average BP,q females aged 35-44 | 110.7-120.5(115.9) | 112.4 | 2 | ||
| Average BP,q males aged 35-44 | 119.7-130.9(126.1) | 119.7 | 1 | ||
| Age Group (years) |
Measure | Range (average) | U.S. Data |
U.S. Ranka | |
| By Indicator |
Composite for Age Group |
||||
| 35-49 | Average BP,q females aged 45-54 | 119.0-129.7(124.1) | 120.3 | 3 | |
| Average BP,q males aged 45-54 | 123.3-135.7(131.1) | 123.3 | 1 | ||
| Average cholesterol,rfemales aged 35-44 | 4.7-5.2 (5.0) | 5.0 | 7 | ||
| Average cholesterol,rmales aged 35-44 | 5.1-5.6 (5.3) | 5.2 | 4 | ||
| Average cholesterol,r females aged 45-54 | 5.2-5.7 (5.5) | 5.4 | 3 | ||
| Average cholesterol,r males aged 45-54 | 5.3-5.8 (5.5) | 5.3 | 1 | ||
| Days of life lost,gfemales | 0.01-0.04 (0.02) | 0.04 | 17 | ||
| Days of life lost,g males | 0.37-0.80 (0.47) | 0.80 | 17 | ||
NOTE: Data are for the most recent year available.
aRankings are calculated from a standardized distribution that includes all 16 OECD countries in the comparison set. Rankings are from best (1) to worst (17), and all comparisons are for the 17 peer countries listed in the text. The “composite rank” is the rank order of the averaged z-scores across indicators. It was calculated in two stages: (1) the value of each indicator was converted into a z-score based on observed means and standard deviations and (2) the z-scores were averaged across indicators and then rank ordered. For consistency, some z-scores were reverse coded to preserve the meaning of high and low ranks across all indicators. Data were not always available to rank all 17 countries.
bStillbirths are rate per 1,000 total births (2009). Stillbirth rates and numbers use the WHO definition of birth weight of at least 1,000 grams or a gestational age of at least 28 weeks (third-trimester stillbirth). Data from WHO at http://www.who.int/reproductivehealth/topics/maternal_perinatal/stillbirth/en/.
cLow birth weight is the number of live births weighing less than 2,500 grams as a percentage of the total number of live births. Values (if present) averaged over 2005-2009. Data from OECD at http://stats.oecd.org/index.aspx?DataSetCode=HEALTH_STAT.
dPerinatal mortality is the ratio of deaths of children within 1 week of birth (early neonatal deaths) plus fetal deaths with a minimum gestation period of 28 weeks or a minimum fetal weight of 1,000 grams, expressed per 1,000 births. Values (if present) averaged over 2005-2009. Data from OECD at OECD_Health_MaternalAndInfantMortality_2653d1a3-bb42-4768-9cfb-d405eb5050a1.xls.
eNeonatal mortality is the number of deaths of children under 28 days of age in a given year, expressed per 1,000 live births. Values (if present) averaged over 2005-2009. Data from OECD_Health_MaternalAndInfantMortality_2653d1a3-bb42-4768-9cfb-d405eb5050a1.xls.
fInfant mortality is the number of deaths of children under 1 year of age that occurred in a given year, expressed per 1,000 live births. Values (if present) averaged over 2005-2009.
Data from OECD at OECD_Health_MaternalAndInfantMortality_2653d1a3-bb42-4768-9cfb-d405eb5050a1.xls.
gDays of life lost is the number of potential days of life lost due to mortality in the designated age range. Calculated for 2009 from life tables. Data from WHO at http://www.who.int/whosis/whostat/2011/en/.
hOverweight is defined variously by country. Source years also vary by country. Data from International Association for the Study of Obesity at http://www.iaso.org/resources/world-map-obesity/?map=children.
iDental caries is the weighted average of the number of decayed, missing, or filled teeth (DMFT) among 12-year-olds (2004). Data from WHO at http://apps.who.int/ghodata/.
jGood health is the percentage of the population who report their health as “good” or “better.” Values (if present) averaged over 2005-2009. Data available for ages 15-24 are provided here for ages 5-19, and data available for ages 25-44 are provided here for ages 20-34. Data from OECD at http://stats.oecd.org/index.aspx?DataSetCode=HEALTH_STAT.
kYouth HIV is the percentage of the population infected with HIV (2007). Data available for ages 15-24 are provided here for ages 5-19. Data from United Nations Human Development Report 2010 at http://hdr.undp.org/en/statistics/.
lAdolescent births is the number of births to women ages 15-19 per 1,000 women (2010). Data from United Nations Human Development Report 2010 at http://hdrstats.undp.org/en/indicators/36806.html.
mAdolescent suicides is suicides per 100,000 people ages 15-19. Three-year averages of data from most recent years available. Data from OECD at http://stats.oecd.org/index.aspx?DataSetCode=HEALTH_STAT.
nAverage BMI is average body mass index (kg/m2) (2008). Obesity is a BMI above 30 kg/m2. Data available for ages 20-24 and ages 25-34 are provided here for ages 20-34 and data for ages 35-44 and ages 45-54 are provided for ages 35-49. Data from Global Burden of Metabolic Risk Factors of Chronic Diseases Collaborating Group at http://www1.imperial.ac.uk/publichealth/departments/ebs/projects/eresh/majidezzati/healthmetrics/metabolicriskfactors/.
oDiabetes is the percentage of the population diagnosed with diabetes (2008). Data available for ages 25-34 are provided here for ages 20-34, and data for ages 35-44 and ages 45-54 are provided here for ages 35-49. Data from Global Burden of Metabolic Risk Factors of Chronic Diseases Collaborating Group at http://www1.imperial.ac.uk/publichealth/departments/ebs/projects/eresh/majidezzati/healthmetrics/metabolicriskfactors/.
pAverage FPG is average fasting plasma glucose (mmol/L) (2008). Data available for ages -20-24 and ages 25-34 are provided here for ages 20-34, and data for ages 35-44 and ages 45-54 are provided for ages 35-49. Data from Global Burden of Metabolic Risk Factors of Chronic Diseases Collaborating Group at http://www1.imperial.ac.uk/publichealth/departments/ebs/projects/eresh/majidezzati/healthmetrics/metabolicriskfactors/.
qAverage BP is average systolic blood pressure (mm Hg) (2008). Data available for ages -20-24 and ages 25-34 are provided here for ages 20-34, and data for ages 35-44 and ages 45-54 are provided here for ages 35-49. Data from Global Burden of Metabolic Risk Factors of Chronic Diseases Collaborating Group at http://www1.imperial.ac.uk/publichealth/departments/ebs/projects/eresh/majidezzati/healthmetrics/metabolicriskfactors/.
rAverage cholesterol is average total serum cholesterol (mmol/L) (2008). Data available for ages 20-24 and ages 25-34 are provided here for ages 20-34, and data for ages 35-44 and ages 45-54 are provided here for ages 35-49. Data from Global Burden of Metabolic Risk Factors of Chronic Diseases Collaborating Group at http://www1.imperial.ac.uk/publichealth/departments/ebs/projects/eresh/majidezzati/healthmetrics/metabolicriskfactors/.
sMaternal mortality is the ratio of maternal deaths from all causes per 100 000 live births. Values (if present) averaged over 2005-2009. Data from OECD at http://stats.oecd.org/index.aspx?DataSetCode=HEALTH_STAT.
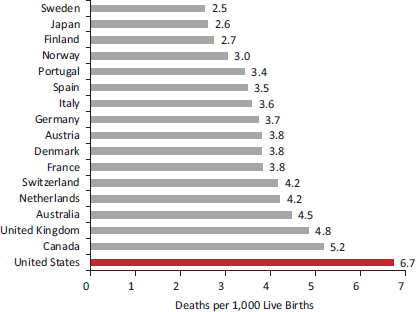
FIGURE 2-1 Infant mortality rates in 17 peer countries, 2005-2009.
NOTE: Rates averaged over 2005-2009.
SOURCE: Data from OECD (2012c).
Infancy and Early Childhood: Ages 0-4
Birth Outcomes
Infant mortality rates in the United States have been stagnant in the past decade and are now higher than in most high-income countries (Congressional Budget Office, 1992; MacDorman and Mathews, 2009; OECD, 2011b). From 2005-2009, the United States had the highest infant mortality rate (6.7 per 1,000 live births) of the 17 peer countries and the 31st highest in the OECD (OECD, 2011b) (see Figure 2-1).7 The U.S. ranking on birth outcomes—including stillbirths, infant mortality, and low birth weight—can be seen in Table 2-1. Across these indicators, the United States has the lowest composite rank. The U.S. rate for stillbirths and perinatal mortality
_________________
7Among 40 OECD countries in 2009, the only countries with a higher infant mortality rate than the United States were Brazil, Chile, China, India, Indonesia, Mexico, the Russian Federation, South Africa, and Turkey (OECD, 2011b). Cross-national variation in infant mortality rates is partly affected by differences in how countries register preterm births. In the United States, Canada, and Nordic countries, preterm neonates who often have low probabilities of survival are registered as live births, thereby increasing the mortality rate relative to countries that do not include preterm neonates among live births.
ranks among the highest in the peer countries, but the most glaring difference is low birth weight and neonatal and infant mortality.
The United States ranks poorly on low birth weight, prematurity, and maternal health. Figure 2-2 shows that the proportion of low-birth-weight babies in the United States (8.2 percent for 2005-2009) is the second highest among the peer countries. Among the 17 peer countries examined in Chapter 1, the United States had the 14th highest rate of preterm deaths before age 5 in 2008 (World Health Organization, 2010). Figure 2-3 shows the results of a recent analysis of data from 184 countries (Blencowe et al., 2012), which found that the rate of preterm births in the United States (12 percent) was comparable to that of sub-Saharan Africa. Two important antecedents of infant and child health—adolescent pregnancies and maternal health—also show a clear U.S. disadvantage (see Figure 2-2). Taken together, these measures indicate that U.S. children often enter life under unfavorable health conditions.
The high rate of adverse birth outcomes in the United States does not appear to be a statistical artifact, such as a difference in coding practices for very small infants who die soon after birth (MacDorman and Mathews,
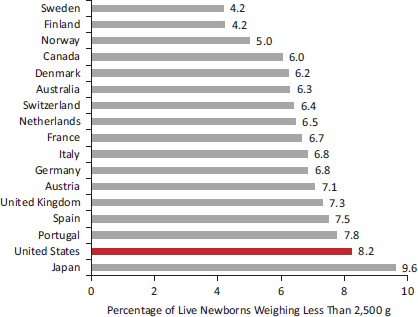
FIGURE 2-2 Low birth weight in 17 peer countries, 2005-2009.
NOTE: Values (if present) averaged over 2005-2009.
SOURCE: Data from OECD (2012l), OECD.StatExtracts: Health Status (database).
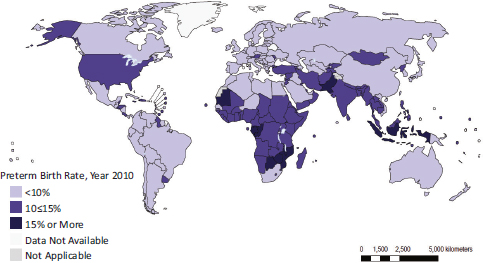
FIGURE 2-3 Global prevalence of preterm births, 2010.
SOURCE: Blencowe et al. (2012, Figure 3).
2009). Indeed, country rankings remained identical even when Palloni and Yonker (2012) recalculated the rates to exclude preterm births (less than 22 weeks of gestation).
Infant mortality and low birth weight are both markers of unhealthful in utero and postnatal conditions, findings that are also supported by related indicators. From birth through age 4, U.S. children lose more years of life than children in the other 16 peer countries (Palloni and Yonker, 2012). Infants who die during the first year of life, particularly preterm infants, are those at the lower tail of the distribution of newborns by health status, and low-birth-weight babies are at the extreme end of this tail. Both infant mortality and low birth weight are, in turn, influenced by maternal characteristics, including health-related behaviors (e.g., smoking, drinking, diet, and breastfeeding practices), marital and family status, maternal education, access to health care, and household and family conditions. The U.S. excess in infant mortality and the prevalence of low-birth-weight babies probably reflect both individual and societal contextual factors. For example, the United States fares poorly with respect to adolescent pregnancy and child poverty (see Chapter 6), which are, respectively, proximate and distal determinants of low birth weight and infant mortality.
Data are available to track trends over time in U.S. infant mortality and birth weight relative to other countries. By the early 1960s, the average infant mortality rate among peer countries had dropped to the U.S. rate, and by the 1970s the United States began to develop a disadvantage in infant mortality (Viner, 2012) (see Figure 2-4). Although U.S. infant
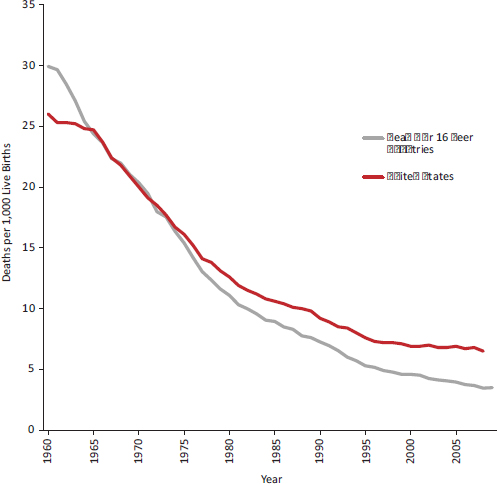
FIGURE 2-4 Infant mortality rates in the United States and average of 16 peer countries, 1960-2009.
NOTE: The average is calculated for the 16 peer countries examined in Chapter 1.
SOURCE: Viner (2012, supplemental analysis).
mortality declined by 20 percent between 1990 and 2010, other high-income countries experienced much steeper declines and halved their infant mortality rates over those two decades (Palloni and Yonker, 2012). Mortality rates after infancy followed a similar pattern: as of 1955, mortality rates at ages 1-5 were much lower in the United States than the OECD mean, but the latter fell dramatically and since 1980 have mirrored the United States (Viner, 2012).
Although birth outcomes are much worse for particular groups in the United States, such as black women (David and Collins, 1997; National Center for Health Statistics, 2012), the generally poor birth outcomes in the United States cannot be explained by the racial or ethnic diversity of
the U.S. population. The U.S. infant mortality rate for non-Hispanic whites is also higher than the infant mortality rate of other countries (Palloni and Yonker, 2012).8 Nor is this problem limited to infants from poor and disadvantaged families. The U.S. infant mortality rate among mothers with 16 or more years of education is still higher than the infant mortality rate in most high-income countries (Mathews and MacDorman, 2007).
Other Pediatric Health Outcomes
Children who survive infancy face other disadvantages in the United States relative to children in other high-income countries. For example, one study reported that the prevalence of asthma at ages 0-3 was higher in the United States than in England (Martinson et al., 2011a). The probability of children dying before age 5 in the United States is approximately 8 per 1,000, the highest rate of the 17 peer countries examined in Chapter 1 (World Health Organization, 2010). Injuries (primarily motor vehicle injuries, drowning, and fires and burns) are the leading cause of death among U.S. children in this age group (Bernard et al., 2007). In 2004, 11 percent of U.S. deaths under age 5 were from injuries, the largest proportion of the 17 peer countries except Japan (World Health Organization, 2010). In the United States, violence has been a long-standing cause of injury deaths in this age group, with homicide being the third leading cause of death for children aged 1-4 (National Center for Health Statistics, 2012). In the United States, infants are nearly four times more likely to be killed (usually by a parent) than children ages 1-4 (Karch et al., 2011). In 2006, the United States had the highest rate of child deaths due to negligence, maltreatment, or physical assault among the 17 peer countries (and among other OECD countries, including emerging economies) (OECD, 2012k). The rate of violent deaths in the United States among boys aged 1-4 has exceeded the OECD average since the late 1960s, and the same has been true for unintentional injury deaths in boys and girls (Viner, 2012).
The added health challenges that young children in the United States face may be especially significant because of the important developmental milestones that occur at this age. The period between ages 1 and 4 is not only a time of dramatic physical growth and development, but also a critical phase during which language and mathematical skills are first established, and children’s experiences at these ages shape personality
_________________
8The rate of low-birth-weight babies among non-Hispanic whites has been about average. Comparing non-Hispanic whites to the aggregate population rates of other countries is of limited validity without excluding similar subgroups in other countries that also have significant disadvantaged minority populations. Furthermore, excluding certain ethnic groups in the United States (e.g., Hispanics) removes a population with favorable birth outcomes due to the “Hispanic paradox” (see Chapter 6).
features and social connections—all of which can later affect health outcomes. Whether a child’s developmental trajectory follows a healthy, risky, or delayed course between infancy and age 5 appears to depend both on the degree of exposure to health risks and on access to counterbalancing protective factors that are of crucial importance during various phases of development. For example, parental education, literacy, and emotional health may be especially important in the first 12 months of a child’s life, whereas parenting behaviors (e.g., reading and discipline) and other inputs (e.g., health services and preschool) may be more important for toddlers. (See Chapter 6 for a discussion of the role of the family and household environment in explaining the U.S. health disadvantage.)
Childhood and Adolescence: Ages 5-19
Preadolescence and adolescence cover a vulnerable period during which positive experiences and setbacks can affect developmental accomplishments, such as consolidating self-image, discipline, and the capacity for abstract thinking and future planning. Developmental theorists have long identified adolescence as a key period of dramatic central nervous system, pubertal, and social development, second only to early childhood in the rate and breadth of development (Viner, 2012).
In addition, young people are highly susceptible to socialization processes and behaviors that affect health, such as sensation seeking and experimentation with alcohol, drugs, sex, and smoking. “Adolescence contributes significantly to adult burden of disease through initiation of major disease risk factors in adolescence, each of which tracks into adult life” (Viner, 2012, p. 54). This stage of life includes critical transition periods that modify childhood trajectories relating to health and well-being (Viner, 2012; World Bank, 2007). This stage sets the foundations of adult performance and influence educational attainment, future employment status, and career opportunities—factors that strongly predict health status and life expectancy (see Chapter 6).
The available evidence indicates that the U.S. health disadvantage is clearly evident at this age too, especially after age 15. Due mainly to the high prevalence of overweight and obesity, HIV infection, and adolescent pregnancy, the United States has the lowest composite rank for ages 5-19 (see Table 2-1). Although the United States and OECD countries have equivalent child mortality rates after infancy, the United States develops a clear mortality disadvantage in the adolescent and young adult years (Viner, 2012). Among adolescents aged 15-199 in 2005, the United States had the
_________________
9No all-cause mortality disadvantage was observed for U.S. adolescents aged 10-14 (Viner, 2012).
highest all-cause mortality rate among peer countries (Viner, 2012), a pattern that is decades old: high mortality rates at ages 15-24 (relative to the OECD mean) have existed among U.S. males since the 1950s and among females since the 1970s (Viner, 2012). A U.S. health disadvantage at this age has been documented in particular for obesity, chronic illness, adolescent pregnancy, sexually transmitted infections, mental illness, and injuries.
Obesity
The increasing prevalence of childhood overweight and obesity is a global phenomenon, but obesity is especially prevalent among children in the United States (Institute of Medicine, 2011c; Ogden et al., 2012a). As of 2005, the prevalence of obesity among adolescents aged 12-17 was more than twice the OECD mean (Viner, 2012). By 2011, 35.9 percent of girls and 35.0 percent of boys aged 5-17 were overweight or obese in the United States, the highest rate among the 17 peer countries (OECD, 2011b) (see Figure 2-5).10
As with infant mortality, the problem is not restricted to children of color or disadvantage. The prevalence of obesity among U.S. children aged 5-13 who are non-Hispanic whites is lower than that of other U.S. children, but still higher than the OECD average for ages 5-19 (a comparison group likely to experience higher obesity rates simply because it is older than the U.S. benchmark population). Results are similar among U.S. children born to mothers with more than a college education: their obesity rate also exceeds the OECD average (Han, 2011).
Higher rates of childhood obesity may have both immediate and extended consequences. There is some speculation and evidence that obesity may affect educational achievement and labor market success, thereby influencing health (see Chapter 6) (Crosnoe, 2007; Han, 2011; Sabia, 2007; Sarlio-Lahteenkorva et al., 2004; von Hinke Kessler Scholder et al., 2012). Moreover, the physiological metabolic effects of childhood obesity may contribute to diabetes, heart disease, and other obesity-related conditions that claim excess years of life in the United States after age 30 (see Chapter 1). The evidence linking childhood obesity to adult health outcomes is far from perfect, but it suggests that the acceleration of childhood obesity may precipitate excess mortality in the United States when today’s children reach older ages. Obesity among women during their child-bearing years may also compromise birth outcomes (Aliyu et al., 2010; Cnattingius et al., 1998; McDonald et al., 2010; Siega-Riz et al., 2006).
_________________
10The prevalence of childhood obesity in the United States is the highest of 34 OECD countries except Greece (OECD, 2011b).
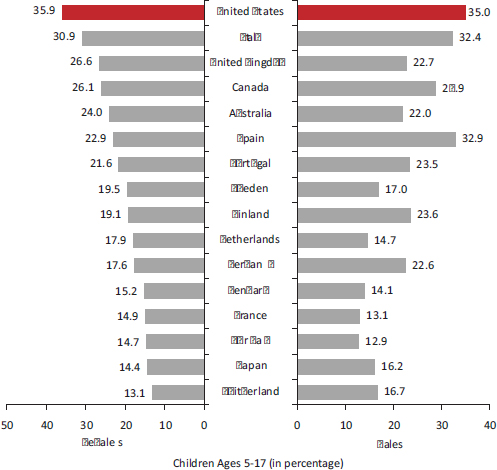
FIGURE 2-5 Prevalence of overweight (including obese) children in 17 peer countries, latest available estimates.
NOTES: Definitions of overweight and obese vary among countries. Prevalence rates are for the most current year available.
SOURCE: OECD (2011b, Figure 2.4.1).
Chronic Illnesses
The rise in childhood diabetes has mirrored the increase in obesity. Among the 17 peer countries in 2010, the United States had the fifth highest prevalence of diabetes among children ages 0-14, led only by Finland, Norway, Sweden, and the United Kingdom (OECD, 2011b). U.S. children also appear to be experiencing higher rates of other chronic illnesses. For example, one study found that the prevalence of asthma in children and adolescents was significantly higher in the United States than in England (Martinson et al., 2011a). Oral and dental health is important at all ages
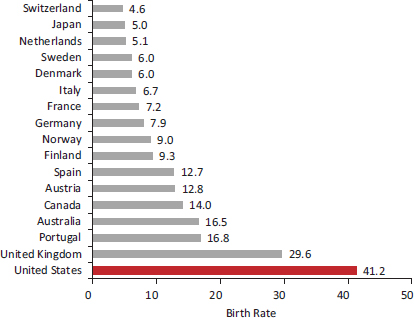
FIGURE 2-6 Adolescent birth rate in 17 peer countries, 2010.
NOTE: Adolescent birth rate is births per 1,000 girls aged 15-19.
SOURCE: Adapted from United Nations Development Programme (2011).
and especially among children (Institute of Medicine, 2011a): as of 2006, the average number of decayed, missing, or filled teeth in 12-year-olds was higher in the United States than in 11 peer countries (and three nonpeer countries) (OECD, 2009c).
Adolescent Pregnancy
Adolescent pregnancy is not strictly a health outcome, the focus of this chapter, but it often has adverse social implications for adolescent mothers, their children, and the family of the adolescent, implications that can eclipse any health risks associated with such pregnancies (see Chapter 6). As shown in Figure 2-6, the United States has the highest rate of adolescent pregnancy among peer countries (Palloni and Yonker, 2012; Viner, 2012), a trend that is consistent with its high prevalence of low-birth-weight babies and infant mortality.11 The U.S. adolescent pregnancy rate in 2010 was 41 per 1,000 girls aged 15-19, nearly 3.5 times the average of the comparison countries (United Nations Development Programme, 2011). The high adolescent pregnancy rate in the United States is not a new problem. Surveys
_________________
11Early-age childbirth is a leading risk factor for low birth weight and infant mortality.
in the 1990s showed that U.S. adolescents aged 15-19 had a higher rate of pregnancies, births, and abortions than did their peers in four comparison countries: Canada, France, Sweden, and the United Kingdom (Darroch et al., 2001).
Sexually Transmitted Infections
Panchaud et al. (2000) compiled statistics from 16 developed countries that included a number of high-income countries. Among adolescents age 15-19, the U.S. prevalence of infections with syphilis (6.4 per 100,000), gonorrhea (571.8 per 100,000),12 and chlamydia (1,131.6 per 100,000) was higher in the United States than in any other high-income country that provided comparison data.13 A subsequent study based on 1996 data14 from five countries also found that rates of infection with the same three organisms were markedly higher among U.S. adolescents than their peers in Canada, France, Sweden, and the United Kingdom (Darroch et al., 2001). The high prevalence of HIV infection in the United States (see Chapter 1) begins in adolescence. The prevalence of HIV infection at ages 15-24 is higher in the United States than in other high-income countries (Viner, 2012).
Mental Illness
Mental illness affects people of all ages and is discussed more fully toward the end of this chapter. However, we note it here because many mental illnesses first appear in late adolescence and young adulthood (Merikangas et al., 2010). One study reported that 75 percent of lifetime mental health problems start by age 24: more specifically, ages 12-24 is the usual age of onset for depression, anxiety disorders, psychoses, and eating and personality disorders (Kessler et al., 2005, 2007; Patel et al., 2007). Unfortunately, few comparative data exist to compare the mental health of adolescents in the United States with those elsewhere. A study that administered a common questionnaire in the United States and Europe found that
_________________
12In all comparison countries, the gonorrhea infection rate among adolescents (ages 15-19) ranged between 0.6 and 76.9 per 100,000. The Russian Federation was the only country with a higher rate of gonorrhea (596.5 per 100,000) than the United States (Panchaud et al., 2000).
13An important caveat noted by the authors is the deficiencies and inconsistencies in countries’ reporting systems. Data on sexually transmitted infections are lacking in many countries, and even countries with somewhat reliable reporting systems are thought to underestimate the true incidence (Panchaud et al., 2000).
14The panel could not find more current data to make cross-national comparisons of sexually transmitted infection rates.
the prevalence of psychological disorders among adolescents was higher in the United States and the United Kingdom than in 11 other European countries (Viner, 2012). Another study suggested that young people aged 0-19 used more psychotropic medication15 in the United States than in the Netherlands and Germany (Zito et al., 2008), but medication use may be a poor proxy for disease prevalence. (Alcohol and other drug use are discussed in Chapter 5.)
Injuries
The high all-cause mortality rate among U.S. adolescents results principally from injuries, the leading cause of death at these ages (National Center for Health Statistics, 2012). Among adolescents aged 15-19 in 2005, the United States had the highest injury mortality rate of the 17 peer countries (Viner, 2012). Many of these deaths occur in motor vehicle accidents: drivers aged 16-20 are more than twice as likely to be involved in fatal crashes (per licensed driver in the age group) than drivers over age 35 (Transportation Research Board, 2011). For decades, young people in the United States have been more likely to die in motor vehicle accidents than their peers in other countries. Since the 1950s, the mortality rate from transportation-related injuries at ages 15-24 has been higher in the United States than the mean for the 17 peer countries,16 with more dramatic differences among males than females (see Figures 2-7a and 2-7b). Since the 1960s, the United States has also had a higher death rate from nontransportation-related injuries among children aged 5-9 and especially for males aged 10-19 (Viner, 2012).
Another long-standing trend is the high rate of deaths from youth violence in the United States. Homicide is the second leading cause of death among U.S. adolescents and young adults aged 15-24 (National Center for Health Statistics, 2012), and approximately 80 percent of these involve firearms (Bernard et al., 2007). Since the 1950s, a very large disparity has persisted in the rate of violent deaths among males aged 15-24 in the United States and their counterparts in peer countries (see Figures 2-8a and 2-8b). U.S. males aged 15-19 are five times more likely to die from violence than those in other OECD countries.17 Violent deaths in this age group increased dramatically in the United States during the 1990s, but not elsewhere in
_________________
15Psychotropic drugs included antidepressants, antipsychotics, alpha-agonists, anxiolytics, hypnotics, lithium, antiparkinsonian agents, anticonvulsant-mood stabilizers, and stimulants.
16There was some equalization as OECD countries “caught up” in the 1970s, but the OECD subsequently experienced a steeper decline in the 1990s and the gap with the United States widened again.
17Although the United States is actively engaged in military conflicts, the risk of death from violence among young people in the United States far exceeds the number of deaths that occur in the military.
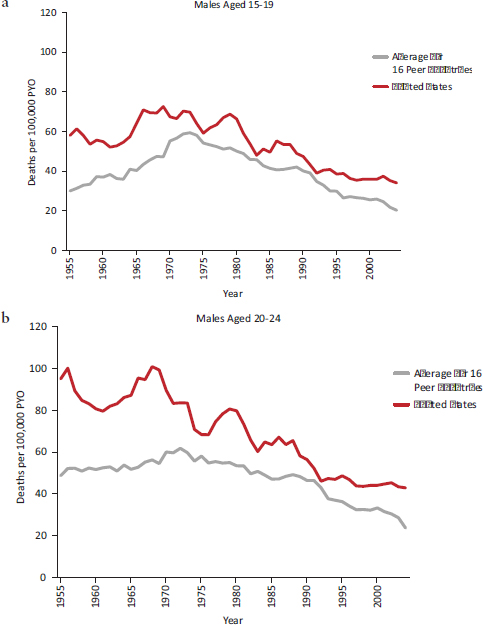
FIGURE 2-7 Transportation-related mortality among adolescent and young adult males in the United States and average of 16 peer countries, 1955-2004.
NOTES: PYO = person years of observation. The average is calculated for 16 peer countries (see Chapter 1).
SOURCE: Viner (2012, supplemental analysis).
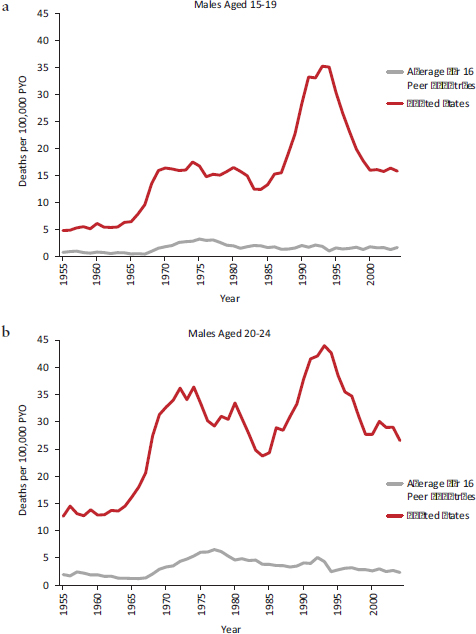
FIGURE 2-8 Violent mortality among adolescent and young adult males in the United States and average of 16 peer countries, 1955-2004.
NOTES: PYO = person years of observation. The average is calculated for 16 peer countries (see Chapter 1).
SOURCE: Viner (2012, supplemental analysis).
the peer countries, thereby widening the adolescent violence gap. Violent deaths in the United States declined thereafter but remained considerably higher than the peer country mean (see Figures 2-8a and 2-8b). Violent deaths among adolescent females have also been more common in the United States than in other countries, but the size of the disparity has been smaller (Viner, 2012).
Suicide
Suicide is the third leading cause of death in the United States for ages 10-24 (National Center for Health Statistics, 2012). The suicide rate among U.S. adolescents is currently close to the median among peer countries, but it is worth noting that suicide (like any cause of death at this age) claims many years of life lost before age 50 (see Chapter 1). From the 1960s to the 1990s, suicides were more common among U.S. males ages 15-24 than elsewhere in the OECD (Viner, 2012).18
Young Adulthood: Ages 20-34
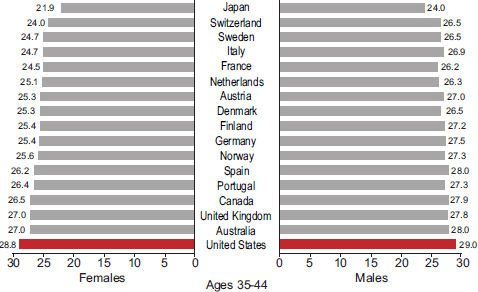
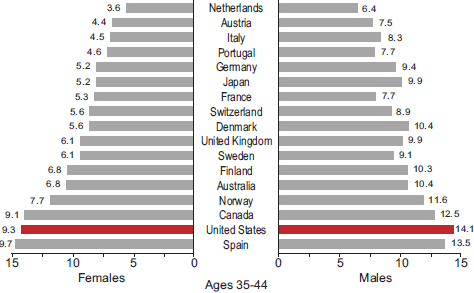
The period between ages 20 and 34 has direct bearing on employment and family formation and development. The roots of unhealthy behaviors are often already entrenched by this age. Although young adults in the United States have average cholesterol and self-reported blood pressure levels and above average self-reported health (see caveats about self-reports in Chapter 1), they have higher rates of obesity and diabetes (Palloni and Yonker, 2012). High rates of overweight and obesity in the United States can be found in every age group above age 25 (Crimmins and Solé-Auró, 2012). In 2008, U.S. adults age 25 and older had the highest average body mass index of the 17 peer countries (see Figures 2-9a-c). Figures 2-10a-c show that U.S. adults also had the highest prevalence of diabetes. Among the same countries, the highest average fasting plasma glucose levels were in the United States and Spain. As noted above, indicators of maternal health in the United States are also less favorable than in other affluent countries. For example, for 2005-2009, the U.S. maternal mortality ratio was 13.7 per 100,000, the second highest of the 17 peer countries.
Unintentional injuries remain the leading cause of death in the United States for ages 25-34 (National Center for Health Statistics, 2012). Since
_________________
18See Chapter 5 for a discussion of the role of firearms, which are used in 52 percent of U.S. suicides (Karch et al., 2011) and increase the lethality of suicide attempts (Miller et al., 2011a).
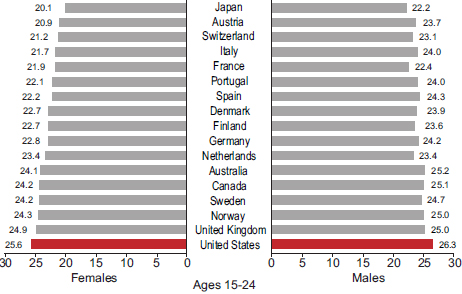
FIGURE 2-9 Average body mass index (BMI), by age and sex, in 17 peer countries, 2008.
SOURCE: Data from the Global Burden of Metabolic Risk Factors of Chronic Diseases Collaborating Group (2012), BMI by country.
the 1950s, deaths at these ages from transportation-related and non-transportation-related injuries have been markedly higher in the United States than in other OECD countries (Viner, 2012). In the United States, the second and third leading causes of death in this age group are, respectively, suicide and homicide (Karch et al., 2011). For U.S. males aged 20-24, the risk of dying from violence is nearly seven times higher than in other OECD countries, a trend that dates back to the 1950s.
Middle Adulthood: Ages 35-49
The symptoms of chronic illnesses often first appear between ages 35 and 49. At this age, cardiovascular diseases claim the largest fraction of years lost to disability (Palloni and Yonker, 2012). Continuing the pattern observed at younger ages, Americans who reach middle adulthood rank poorly on measures of obesity and diabetes (see Figures 2-9a-c and 2-10a-c) and have relatively high fasting plasma glucose levels. However, unintentional injuries remain the leading cause of death at this age (National Center for Health Statistics, 2012).
Health at Age 50
On average, Americans reach age 50 in significantly poorer health than their peers in other high-income countries. The panel commissioned
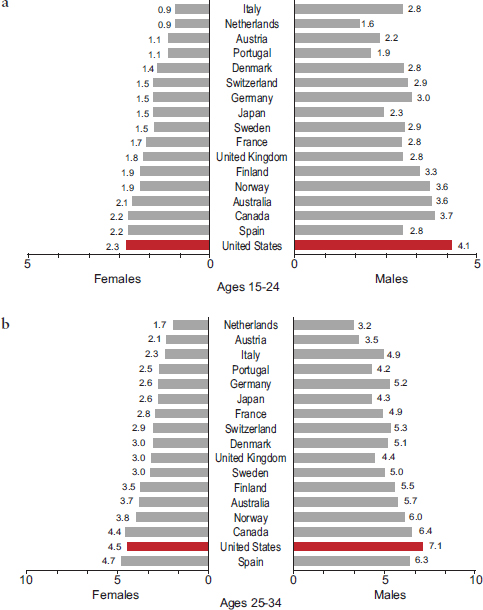
FIGURE 2-10 Self-reported prevalence of diabetes, by age and sex, in 17 peer countries, 2008.
SOURCE: Data from the Global Burden of Metabolic Risk Factors of Chronic Diseases Collaborating Group (2012), diabetes by country.
an analysis of cardiovascular risk factors among adults aged 50-54 in the United States and 10 European countries. This age group was selected because it is the beginning of the age range when cardiovascular mortality, the leading cause of death, begins to be important, but mortality has not yet affected the population through selection.
Data obtained from NHANES and SHARE indicate that U.S. adults aged 50-54 report a higher prevalence of heart disease, stroke, diabetes, hypertension, and obesity than do their counterparts in 10 European countries. Crimmins and Solé-Auró (2012) calculated a cardiovascular risk score by adapting the method of Gaziano et al. (2008), which includes the above-mentioned risk factors along with smoking. The proportion of U.S. adults aged 50-54 with at least a 20 percent risk of having a fatal or nonfatal cardiac event within 5 years was higher in the United States than in the European countries (see Table 2-2). The percentage of U.S. adults at high risk exceeded the European percentage by 34 percent for men and by more than 159 percent for women (Crimmins and Solé-Auró, 2012). That is, Americans reach age 50 with significantly higher levels of cardiovascular risk than their European counterparts.
Maturity: Age 50 and Older
As noted in Chapter 1, a previous National Research Council (2011) report documented that life expectancy at age 50 is lower in the United
TABLE 2-2 Distribution of Cardiovascular Risk for Adults Aged 50-54 Among 11 High-Income Countries
| Country | Level of Risk | ||||
| Very High | High | Moderate | Low | ||
| Austria | 0.70 | 11.37 | 38.55 | 49.38 | |
| Belgium | 0.25 | 13.35 | 42.06 | 44.33 | |
| Denmark | 2.41 | 10.24 | 39.76 | 47.59 | |
| France | 0.00 | 12.48 | 34.19 | 53.32 | |
| Germany | 0.52 | 14.30 | 37.73 | 47.45 | |
| Greece | 0.43 | 10.40 | 50.14 | 39.04 | |
| Italy | 0.00 | 12.28 | 41.56 | 46.16 | |
| Netherlands | 1.89 | 8.43 | 42.23 | 47.46 | |
| Spain | 2.37 | 15.58 | 42.84 | 39.21 | |
| Sweden | 0.33 | 7.88 | 29.46 | 62.33 | |
| Pooled values (10 countries) | 0.68 | 12.93 | 38.98 | 47.40 | |
| United States | 1.86 | 16.37 | 38.68 | 43.09 | |
| Austria | 0.00 | 3.90 | 26.42 | 69.68 | |
| Belgium | 0.00 | 5.65 | 22.86 | 71.49 | |
| Denmark | 0.00 | 5.70 | 26.58 | 67.72 | |
| France | 0.00 | 5.10 | 17.58 | 77.32 | |
| Germany | 0.29 | 3.60 | 24.79 | 71.32 | |
| Greece | 0.00 | 4.66 | 29.29 | 66.06 | |
| Italy | 0.60 | 4.08 | 22.64 | 72.68 | |
| Netherlands | 1.85 | 4.34 | 24.83 | 68.98 | |
| Spain | 0.00 | 3.29 | 19.52 | 77.19 | |
| Sweden | 1.08 | 6.65 | 22.71 | 69.57 | |
| Pooled values (10 countries) | 0.32 | 4.22 | 22.41 | 73.05 | |
| United States | 1.34 | 10.37 | 30.69 | 57.60 | |
NOTES: Data for European countries are from the Survey of Health, Ageing and Retirement in Europe (SHARE) and data for the United States are from the National Health and Nutrition Examination Survey (NHANES). Data reflect estimated probability of a cardiovascular event (fatal or nonfatal) within 5 years, including low risk (10 percent or less), moderate risk (10-20 percent), high risk (20-30 percent), and very high risk (greater than 30 percent). Probabilities were determined by applying the risk charts in Gaziano et al. (2008) to data from NHANES for 2001-2006 and from the first wave of SHARE in 2004. SHARE data include 10 countries included in the first wave (Switzerland is omitted because of a low response rate). Samples are weighted in the analyses to be representative of national populations. People with disease are automatically categorized as high risk. For those without disease, age- and sex-specific risk is based on having indicators of high blood pressure, diabetes, body mass index, and current smoking.
SOURCE: Crimmins and Solé-Auró (2011, Table 3).
States than in other high-income countries. Research also shows that U.S. adults aged 50 and older have a higher prevalence of cardiovascular and other chronic diseases. Comparing the results of national population surveys in the United States and England, one of the first studies of this issue found that U.S. adults aged 55-64 reported higher rates of diabetes, hypertension, heart disease, myocardial infarction, stroke, lung disease, and cancer (Banks et al., 2006). To account for reporting biases, the researchers also compared the prevalence of biomarkers, and the biomarker data followed the same pattern. Controlling for health behaviors, such as smoking and alcohol use, did not explain the disparity. Health disparities between the United States and England were largest among individuals at the lowest socioeconomic levels, but the U.S. health disadvantage persisted even at the highest socioeconomic levels (Banks et al., 2006). Similarly, Reynolds et al. (2008) found that U.S. adults age 65 and older were more likely than their Japanese counterparts to report being overweight or obese and having heart disease, diabetes, arthritis, and activity limitations.
Other studies have demonstrated that older Americans have higher rates of disease than Europeans. In one study that compared U.S. adults age 50 and older with those in 10 European countries, the United States had a higher prevalence of heart disease, hypertension, high cholesterol, cerebrovascular disease, diabetes, chronic lung disease, asthma, arthritis, and cancer (Thorpe et al., 2007). Similarly, another study that compared the health of U.S. adults aged 50-74 with those in England and 10 European countries reported that Americans had higher rates of heart disease, stroke, hypertension, diabetes, cancer, lung disease, and limited activity than their European counterparts (Avendano et al., 2009). This study also found that Americans at all socioeconomic levels were less healthy, but the disparity was greatest among low-income groups. Oral disease is an important public health problem in older adults (Griffin et al., 2012; Institute of Medicine, 2011a), but there is no evidence of a U.S. disadvantage: one study found that older U.S. adults did not appear to have a greater prevalence of dental disease than Europeans (Crocombe et al., 2009).
A study that compared adults age 50 and older in Canada, Denmark, England, France, Italy, Japan, the Netherlands, Spain, and the United States found that Americans had the highest prevalence of heart attacks, strokes, diabetes, cancer, and activity limitations, and twice the risk of multiple comorbidities (Crimmins et al., 2010). The U.S. health disadvantage was generally larger among those aged 50-64 than among older adults, perhaps because Americans experienced the onset of disease at earlier ages. Nonobese Americans were less healthy than non-obese people in other countries, suggesting that obesity alone did not explain the U.S. health disadvantage (Crimmins et al., 2010). Still another study that compared the health of adults aged 50-53 in the United States and eight European
countries found a higher prevalence of heart disease, diabetes, stroke, lung, disease, cancer, hypertension, and limited activity among Americans (Michaud et al., 2011). In a study that compared the health of adults aged 55-64 in the United States and 12 European countries, Banks and Smith (2011) found that the United States had the highest rates of cancer, diabetes, lung disease, and stroke.
Mental Health
Reports about the health of populations often ignore mental health, yet mental illness may act as both a cause and a manifestation of the U.S. health disadvantage. People’s emotional and neuropsychiatric health can affect diseases and injurious behavior that claim lives, and of course mental illness is itself an important health outcome (U.S. Department of Health and Human Services, 2001a). Depression, alcohol-use disorders, schizophrenia, and bipolar disorders are among the six leading causes of years lived with disability in the United States (World Health Organization, 2003). The years of life affected by mental illness can be substantial because these disorders often first appear in adolescence and young adulthood (Kessler et al., 2007).
In an analysis commissioned by the panel, Palloni and Yonker (2012) calculated the per capita years of life before age 60 that were afflicted by disability (or incapacitation) in 2002-2006. In terms of the number of years lived with a disability, the United States ranked in the bottom quartile of peer countries (i.e., living more years with a disability), and mental illness and other neuropsychiatric disorders accounted for a large proportion of these years, especially among youth. Neuropsychiatric disorders claimed approximately 75 percent of days lost to disability at ages 15-29 and approximately 50 percent of days lost at ages 30-44 (Palloni and Yonker, 2012).
Individuals with serious mental illnesses, such as depression, face a higher risk of physical illnesses such as diabetes, hypertension, and heart disease (Newcomer, 2007) and, in the United States at least, may die many years earlier than the general population (Felker et al., 1996; Parks et al. 2006). The higher mortality rates of people with mental illness (Thornicroft, 2011; Wahlbeck et al., 2011) could contribute to the U.S. health disadvantage through multiple causal pathways. For example, people with mental illness may turn to cigarettes, alcohol, or drugs to cope with their condition. Schroeder and Morris (2010) found that people with mental illness consume 44 percent of all cigarettes in the United States. Fully 45 percent of U.S. suicides are precipitated by mental illness (e.g., depression, dysthymia, bipolar disorder) (Karch et al., 2011). Although people with mental illness are more likely to be victims rather than perpetrators of violence (Eisenberg, 2005; McNally, 2011), it is also the case that people struggling
with antisocial behavior, paranoid schizophrenia, or bipolar disorders may commit homicide or other violent acts. People with serious mental illness, especially those being treated with second-generation anti-psychotics, are known to have higher rates of cardiovascular, pulmonary, and infectious diseases (Parks et al., 2006). Anxiety and stress may affect the brain and the endocrine system, alter the behavior of the immune system, and damage end organs (McEwen and Gianaros, 2010). Finally, by affecting work productivity, absenteeism, employability, and social roles (e.g., social isolation, interpersonal tensions, marital disruptions) (Kessler, 2007), mental health can also influence social and economic determinants of health (see Chapter 6).
Whether mental illness (in its various forms) is more prevalent in the United States than in other high-income countries is still unclear. Cross-national studies of mental illness are limited because of inconsistencies in diagnostic criteria and disease classifications,19 survey administration methods, and measured covariables (e.g., demographic characteristics, risk factors, treatment) (Kessler, 2007).20 Differences in the prevalence of mental illnesses may be confounded by differences in awareness, detection, diagnosis, treatment approaches, and comorbidities. With all these caveats, however, several studies suggest that the prevalence of mental illness may be higher in the United States than in other countries. For example, a WHO study (Demyttenaere et al., 2004) conducted in 14 countries found the highest prevalence of mental illness in the United States: 26 percent of Americans reported having a mental health disorder in the past 12 months. The United States had the highest rates of depression (18 percent) and of mood (10 percent) and impulse-control (7 percent) disorders, and only Ukraine exceeded the U.S. prevalence rate for substance abuse disorders (Demyttenaere et al., 2004). Other studies from the same project, involving a longer list of countries, also found a high prevalence of depression in the United States relative to other high-income countries (Andrade et al., 2003; Bromet et al., 2011). Further research is needed, however, to conclude that mental illness is more prevalent in the United States than in peer countries.
_________________
19Mental illnesses are classified differently under different editions of the Diagnostic and Statistical Manual of Mental Disorders (DSM)—editions III, IIIR, IV—and under the International Classification of Diseases (ICD).
20Over time, such changes as the development of the Diagnostic Interview Schedule in the early 1980s and the WHO Composite International Diagnostic Interview in 1990 and its translation into multiple languages, have helped stimulate more comparable cross-national data on mental illness. The WHO International Consortium in Psychiatric Epidemiology helped launch the World Mental Health Survey Initiative, which will continue to yield rich data on mental health (see Demyttenaere et al., 2004).
The evidence reviewed in this chapter, together with the findings in Chapter 1, clearly point to a pervasive pattern of poorer health, more injuries, and shorter lives in the United States than in other high-income countries. These data show that Americans have shorter life expectancy than people in almost all other high-income countries—at birth and at age 50—and they are less likely to survive to age 50. This mortality disadvantage has been growing for the past three decades, especially among females.
The U.S. health disadvantage is pervasive: it affects all age groups up to age 75 and is observed for multiple diseases, biological and behavioral risk factors, and injuries. More specifically, when compared with the average for other high-income countries, the United States fares worse in nine health domains: adverse birth outcomes; injuries, accidents, and homicides; adolescent pregnancy and sexually transmitted infections; HIV and AIDS; drug-related mortality; obesity and diabetes; heart disease; chronic lung disease; and disability.
1. Adverse birth outcomes: For decades, the United States has experienced the highest infant mortality rate of high-income countries. It also ranks poorly on other birth outcomes (e.g., low birth weight) and measures of child health. American children are less likely to live to age 5 than children in other peer countries.
2. Injuries, accidents, and homicides: Injuries are a major cause of premature death in the United States, claiming 53 and 37 percent, respectively, of the excess years of life lost before age 50 by U.S. males and females. Deaths from motor vehicle crashes, nontransportation-related injuries, and violence occur at much higher rates in the United States than in other countries and are a leading cause of death in children, adolescents, and young adults. Since the 1950s, U.S. adolescents and young adults have died at higher rates from traffic accidents and homicide than their counterparts in other countries.
3. Adolescent pregnancy and sexually transmitted infections: Among high-income countries, U.S. adolescents have the highest rate of pregnancies and are more likely to acquire sexually transmitted infections, such as gonorrhea, syphilis, and chlamydia.
4. HIV and AIDS: HIV and other communicable diseases claim ap-proximately 5 percent of the excess years of life lost in the United States before age 50. The United States has the second highest prevalence of HIV infection among the 17 peer countries and the highest incidence of AIDS. The United States has a high prevalence of HIV infection beginning at age 5.
5. Drug-related mortality: Americans lose more years of life to alcohol and other drugs than people in peer countries, even when deaths from drunk driving are excluded.
6. Obesity and diabetes: For decades, the United States has had the highest obesity rate among high-income countries. High prevalence rates for obesity are seen in U.S. children and in every age group thereafter. Beginning at age 20, Americans have among the highest prevalence rates of diabetes (and high plasma glucose levels) among people in all OECD countries.
7. Heart disease: The U.S. death rate from ischemic heart disease is the second highest among the 17 peer countries. Americans reach age 50 with a less favorable cardiovascular risk profile than their peers in Europe, and adults over age 50 are more likely to experience and die from cardiovascular disease than are older adults in other high-income countries.
8. Chronic lung disease: Lung disease is more prevalent and associated with higher mortality in the United States than in the United Kingdom and several other European countries.
9. Disability: Older U.S. adults report a higher prevalence of arthritis and activity limitations than their counterparts in Europe, Japan, and the United Kingdom.
The evidence for some other health indicators is less clear or mixed. Some studies suggest that the United States may also have higher rates of mental illnesses and asthma than comparable countries. The prevalence of cancer is also higher in the United States than in other countries, but this finding may reflect more intensive cancer screening practices. The United States also has a higher prevalence of strokes, which may reflect better survival rates with treatment.
The first half of the above list occurs disproportionately among young Americans. Deaths that occur before age 50 are responsible for about two-thirds of the difference in life expectancy between males in the United States and other high-income countries and about one-third of the difference for females. Americans reach age 50 in poorer health than their counterparts in other high-income countries, and as older adults they face greater morbidity and mortality from chronic diseases that arise from risk factors (e.g., smoking, obesity, diabetes) that are often established earlier in life. These findings underscore the importance of early life interventions, but there is also considerable evidence to support the importance of mid- and late-life interventions (such as smoking cessation) in addressing the U.S. health disadvantage.
The U.S. health disadvantage is more pronounced among socioeconomically
disadvantaged groups, but several studies have found that even the most advantaged Americans may be faring worse than their counterparts in other countries. In comparisons with England and some other countries, Americans with healthy behaviors or those who are white, insured, college-educated, or in upper-income brackets are in worse health than similar groups in other countries.
The United States enjoys some health advantages, including a suicide rate that is at or below the OECD average, low cancer mortality rates, and possibly greater control of blood pressure and serum lipids. And despite objective measures to the contrary, American adults are more likely than others to rate their health as good.
The disappointing U.S. rankings across the life course suggest the existence of “tracking” between early life behaviors and risk factors: that is, patterns related to obesity, self-reported diabetes, and mental disorders appear to carry forward into successive age groups. Furthermore, the conditions that affect one generation may affect the next, as when poor maternal health or adolescent pregnancy leads to low-birth-weight newborns and infant mortality. Current research is attempting to delineate and quantify the interaction variables in these relationships (see, e.g., Gavin et al., 2011). Although statistical associations may represent an artifact of the available data, a more likely explanation is that they reflect the influence of common underlying conditions on all stages of the life course or causal connections across ages.
The health disadvantages that exist in the United States relative to other countries are all the more remarkable given the size and relative wealth of the U.S. economy and the nation’s enormous spending on health care. National health expenditures in the United States have grown from an annual $256 billion (9.2 percent of gross domestic product [GDP]) in 1980 to $2.6 trillion (17.9 percent of GDP) in 2010 (Martin et al., 2012). No other country in the world spends as much on health care, and per capita spending on health care is also much higher in the United States than in any other country (Squires, 2011).
Although this report focuses on health and not economics, it bears noting that the health disadvantage of the United States does have implications for other domains, such as the economy and national security. For example, military and national security experts have warned that rising rates of obesity and illness in young adults are making it harder to recruit healthy soldiers (Cawley and Maclean, 2010). Major corporations are also concerned about the effects of obesity on workforce productivity and competitiveness in the international marketplace (see, e.g., Heinen, 2006).
The economic costs of higher rates of illness and premature death may be substantial. As LaVeist and colleagues (2009, p. 2) explain:
[D]isparities in health and health care impose costs on many parts of society, including individuals, families, communities, health care organizations, employers, health plans, and government agencies, including, of course, Medicare and Medicaid. These costs include direct expenses associated with the provision of care to a sicker and more disadvantaged population as well as indirect costs such as lost productivity, lost wages, absenteeism, family leave to deal with avoidable illnesses, and lower quality of life. Premature death imposes significant costs on society in the form of lower wages, lost tax revenues, additional services and benefits for families of the deceased, and lower quality of life for survivors.
Estimating direct medical costs and indirect costs to the economy and to individuals is methodologically complex (Russell, 2011) and beyond the focus of this report, but the existing literature hints at its scale (Cutler et al., 1997; Gold et al., 1996; LaVeist et al., 2009; Waidmann, 2009). For example, one analysis that focused only on the health disadvantage experienced by U.S. blacks, Asians, and Hispanics relative to non-Hispanic whites found that the combined costs of health inequalities and premature death between 2003 and 2006 was $1.24 trillion (LaVeist et al., 2009). This estimate relies on certain assumptions, but it suggests that the costs associated with the entire population having a health disadvantage relative to other high-income countries are also very high. Although current thinking on this topic is still evolving (e.g., see Acemoglu and Johnson, 2007), some economists have found a strong positive correlation between life expectancy and economic growth (Bloom et al., 2004). Quantifying the net effects of longevity and illness on economic growth and productivity is an area of ongoing research, but it seems likely that the economic costs of the U.S. health disadvantage are substantial.
The pervasive U.S. health disadvantage documented in this and the preceding chapter could arise from problems with health care, individual behaviors, social factors, the environment, or various policies. In Part II of the report, we explore these issues in an effort to explain why, compared with their counterparts elsewhere, Americans face shorter lives and greater illness at almost all ages.


