
Jaquelina C. Falkenheim and Joan S. Burrelli1
In 2008, 19 million scientists and engineers were employed in the United States.2 This figure includes 4.9 million employed in science and engineering (S&E) occupations, 5.5 million employed in S&E related occupations, and 8.8 million employed in non-S&E occupations with S&E related degrees.3 More than half (53%) of these scientists and engineers worked in industry (Figure F-1).
This InfoBrief examines sex, racial/ethnic, and disability characteristics of scientists and engineers employed in industry, including breakouts by highest educational degree, occupation, primary and secondary work activity, and management occupations.
Compared with their proportions in the U.S. population, women, blacks, Hispanics (regardless of racial background), American Indians and Alaska Natives, and persons with disabilities are underrepresented in the industrial S&E workforce; Asians and whites are overrepresented.4 White men who are not of Hispanic origin account for half of the scientists and engineers working in industry, and white women who are not of Hispanic origin account for another 25% (Table F-1). Minority women account for 10% and minority men account for 15% of scientists and engineers working in industry, with about half of all minorities being Asian.5 Six percent of scientists and engineers employed in industry have disabilities.
___________________
1Jaquelina C. Falkenheim (jfalkenh@nsf.gov; 703-292-7798) and Joan S. Burrelli (retired), Science and Engineering Indicators Program, National Center for Science and Engineering Statistics, National Science Foundation, 4201 Wilson Boulevard, Suite 965, Arlington, VA 22230.
2In this report, "industry" includes private for-profit noneducational institutions, persons who are self-employed and incorporated, and other for-profit noneducational employers.
3National Science Board (NSB). 2012. Science and Engineering Indicators 2010. NSB 12-01. Arlington, VA: National Science Foundation.
4For data on demographic characteristics of the U.S. population, see National Science Foundation, Division of Science Resources Statistics (NSF/SRS). 2011. Women, Minorities, and Persons with Disabilities in Science and Engineering. Special Report NSF 11-309. Arlington, VA. Available at www.nsf.gov/statistics/wmpd/.
5A minority is a racial/ethnic group that is a small percentage of the U.S. population. Minority groups include blacks or African Americans, Hispanics, American Indians or Alaska Natives, Native Hawaiians or Other Pacific Islanders, Asians, and persons who reported multiple races.
FIGURE F-1 Employed scientists and engineers, by sector of employment and level of highest degree: 2008
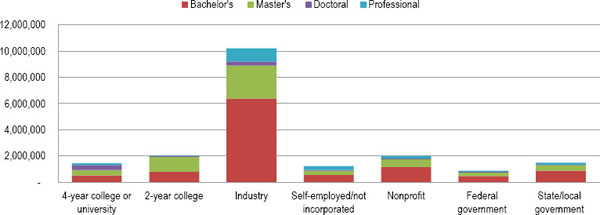
NOTES: Scientists and engineers include persons who have ever received a U.S. bachelor's or higher degree in a science and engineering (S&E) or S&E-related field through 30 June 2007, persons holding a non-S&E bachelor's or higher degree who were employed in an S&E or S&E-related occupation on 1 October 2003, and persons who held a non-U.S. S&E degree and were in the United States on 1 October 2003. Industry includes private for-profit noneducational institutions, persons who are self-employed and incorporated, and other for-profit noneducational employers. Numbers are rounded to the nearest thousand. Detail may not add to total because of rounding.
SOURCE: National Science Foundation/National Center for Science and Engineering Statistics, Scientists and Engineers Statistical Data System (SESTAT): 2008.
Highest Educational Degree
Most scientists and engineers (63%) employed in industry have a bachelor’s degree as their highest degree (Figure F-1, Table F-1). Another 25% have master’s degrees, and 3% have doctoral degrees. Although the percentage with doctoral degrees is small, the number of scientists and engineers with doctorates in industry (300,000) is second only to the number of scientists and engineers with doctorates who are employed by 4-year colleges and universities (381,000).
Male scientists and engineers employed in industry have higher levels of education than their female counterparts. Among scientists and engineers employed in industry, women are more likely than men to have a bachelor’s as their highest degree and men are more likely than women to have a doctoral degree. Black, Hispanic, and white scientists and engineers in industry have fairly similar educational attainment, but Asians, Asian men in particular, are more likely than any other group to have master’s or doctoral degrees (Table F-1). Compared with scientists and engineers without disabilities, those with disabilities are more likely to have a bachelor’s as their highest degree and are less likely to have a master’s as their highest degree.
TABLE F-1 Scientists and engineers employed in industry, by sex, race/ethnicity, disability status, and level of highest degree: 2008
| Sex, race/ethnicity, and disability status | All degree levelsa | Bachelor's | Master's | Doctoral | ||||
|---|---|---|---|---|---|---|---|---|
| Number | Percent | Number | Percent | Number | Percent | Number | Percent | |
| Both sexes | 10,204,000 | 100.0 | 6,374,000 | 62.5 | 2,536,000 | 24.9 | 300,000 | 2.9 |
| White | 7,639,000 | 100.0 | 4,886,000 | 64.0 | 1,792,000 | 23.5 | 196,000 | 2.6 |
| Asian | 1,311,000 | 100.0 | 646,000 | 49.3 | 471,000 | 35.9 | 84,000 | 6.4 |
| Black or African American | 470,000 | 100.0 | 313,000 | 66.6 | 112,000 | 23.8 | 8,000 | 1.7 |
| Hispanic | 542,000 | 100.0 | 351,000 | 64.8 | 121,000 | 22.3 | 8,000 | 1.5 |
| American Indian or Alaska Native Native Hawaiian or Other Pacific | 36,000 | 100.0 | 26,000 | 72.2 | 7,000 | 19.4 | * | * |
| Islander | 44,000 | 100.0 | 34,000 | 77.3 | 6,000 | 13.6 | 1,000 | 2.3 |
| Multiple race | 161,000 | 100.0 | 118,000 | 73.3 | 26,000 | 16.1 | 3,000 | 1.9 |
| Without disability | 9,561,000 | 100.0 | 5,940,000 | 62.1 | 2,396,000 | 25.1 | 283,000 | 3.0 |
| With disability | 643,000 | 100.0 | 434,000 | 67.5 | 140,000 | 21.8 | 17,000 | 2.6 |
| Female | 3,587,000 | 100.0 | 2,310,000 | 64.4 | 872,000 | 24.3 | 70,000 | 2.0 |
| White | 2,575,000 | 100.0 | 1,687,000 | 65.5 | 607,000 | 23.6 | 45,000 | 1.7 |
| Asian | 471,000 | 100.0 | 258,000 | 54.8 | 148,000 | 31.4 | 17,000 | 3.6 |
| Black or African American | 232,000 | 100.0 | 156,000 | 67.2 | 54,000 | 23.3 | 4,000 | 1.7 |
| Hispanic | 208,000 | 100.0 | 136,000 | 65.4 | 48,000 | 23.1 | 3,000 | 1.4 |
| American Indian or Alaska Native Native Hawaiian or Other Pacific | 13,000 | 100.0 | 10,000 | 76.9 | 2,000 | 15.4 | * | * |
| Islander | 16,000 | 100.0 | 12,000 | 75.0 | 1,000 | 6.3 | * | * |
| Multiple race | 72,000 | 100.0 | 52,000 | 72.2 | 12,000 | 16.7 | 1,000 | 1.4 |
| Without disability | 3,397,000 | 100.0 | 2,176,000 | 64.1 | 832,000 | 24.5 | 68,000 | 2.0 |
| With disability | 190,000 | 100.0 | 134,000 | 70.5 | 41,000 | 21.6 | 2,000 | 1.1 |
| Male | 6,617,000 | 100.0 | 4,064,000 | 61.4 | 1,664,000 | 25.1 | 229,000 | 3.5 |
| White | 5,063,000 | 100.0 | 3,200,000 | 63.2 | 1,185,000 | 23.4 | 151,000 | 3.0 |
| Asian | 840,000 | 100.0 | 389,000 | 46.3 | 323,000 | 38.5 | 67,000 | 8.0 |
| Black or African American | 238,000 | 100.0 | 156,000 | 65.5 | 59,000 | 24.8 | 4,000 | 1.7 |
| Hispanic | 334,000 | 100.0 | 216,000 | 64.7 | 73,000 | 21.9 | 5,000 | 1.5 |
| American Indian or Alaska Native Native Hawaiian or Other Pacific | 23,000 | 100.0 | 16,000 | 69.6 | 5,000 | 21.7 | * | * |
| Islander | 29,000 | 100.0 | 21,000 | 72.4 | 5,000 | 17.2 | * | * |
| Multiple race | 89,000 | 100.0 | 67,000 | 75.3 | 13,000 | 14.6 | 2,000 | 2.2 |
| Without disability | 6,164,000 | 100.0 | 3,764,000 | 61.1 | 1,564,000 | 25.4 | 215,000 | 3.5 |
| With disability | 453,000 | 100.0 | 301,000 | 66.4 | 99,000 | 21.9 | 15,000 | 3.3 |
* = estimate < 500.
a Total includes professional degrees not broken out separately.
NOTES: Scientists and engineers include persons who have ever received a U.S. bachelor's or higher degree in a science and engineering (S&E) or S&E-related field through 30 June 2007, persons holding a non-S&E bachelor's or higher degree who were employed in an S&E or S&E-related occupation on 1 October 2003, and persons who held a non-U.S. S&E degree and were in the United States on 1 October 2003. American Indians or Alaska Natives, Asians, blacks or African Americans, Native Hawaiians or Other Pacific Islanders, whites, and persons reporting more than one race refer to individuals who are not of Hispanic origin. Persons of Hispanic origin may be of any race. Numbers are rounded to the nearest thousand. Detail may not add to total because of rounding.
SOURCE: National Science Foundation/National Center for Science and Engineering Statistics, Scientists and Engineers Statistical Data System (SESTAT): 2008.
Occupation
Of the 10 million scientists and engineers employed in industry, about 3 million work in S&E occupations, over 2 million work in S&E-related occupations (primarily doctors and nurses), and nearly 5 million work in non-S&E occupations (primarily top-level management, management-related occupations, and sales). Among those employed in S&E occupations, by far the largest numbers are employed as computer and mathematical scientists and engineers (Table F-2).
Men and women differ in occupation within the industry sector. Men are more likely than women to be engineers and computer and mathematical scientists, and women are more likely than men to work in S&E-related occupations. With the exception of Asians, most racial/ethnic groups differ little in occupation within industry. Asians are more likely than other racial/ethnic groups to be computer and mathematical scientists and less likely to work in non-S&E occupations. Persons with and without disabilities work in largely similar occupations.
Primary or Secondary Work Activity
In contrast to academia, where most scientists and engineers are engaged in teaching and research, the majority of scientists and engineers working in industry reported that their primary or secondary work activity was management, sales, or administration (69%). Another 30% reported research and development, 15% reported computer applications, and 6% reported teaching (Table F-3).6
Partly reflecting differences in occupation discussed above, men are more likely than women to report research and development or computer applications as their primary or secondary work activity, whereas women are more likely to name teaching, regardless of race/ethnicity or disability status. Asians are more likely than any other racial/ethnic group to report research and development or computer applications as their primary or secondary work activity, and they are less likely than most other racial/ethnic groups to report management, sales, or administration. Compared with most other racial ethnic groups, blacks are less likely to report research and development and more likely to report teaching as their primary/secondary work activity. Persons with and without disabilities differ little in work activity.
___________________
6Totals sum to more than 100% because respondents could select both a primary and a secondary work activity.
TABLE F-2 Scientists and engineers employed in industry, by sex, race/ethnicity, disability status, and occupation: 2008 (Percent)
| Sex, race/ethnicity, and disability status | S&E occupations | |||||||
|---|---|---|---|---|---|---|---|---|
| All occupations |
Computer and mathematical scientists | Biological, agricultural, and other life scientists | Physical and related scientists | Social and related scientists | Engineers | S&E-related occupations | Non-S&E occupations | |
| Both sexes | 10,204,000 | 14.1 | 1.4 | 1.5 | 1.1 | 12.1 | 24.4 | 45.4 |
| White | 7,639,000 | 12.4 | 1.3 | 1.5 | 1.2 | 12.0 | 24.3 | 47.4 |
| Asian | 1,311,000 | 26.3 | 2.1 | 1.8 | 0.8 | 14.7 | 23.6 | 30.7 |
| Black or African American | 470,000 | 12.6 | 1.1 | 0.9 | 0.9 | 7.2 | 27.2 | 50.4 |
| Hispanic | 542,000 | 10.0 | 1.7 | 1.3 | 0.9 | 11.8 | 26.4 | 48.0 |
| American Indian or Alaska Native Native Hawaiian or Other Pacific | 36,000 | 13.9 | D | S | S | 8.3 | 33.3 | 41.7 |
| Islander | 44,000 | 13.6 | * | D | D | 15.9 | 27.3 | 40.9 |
| Multiple race | 161,000 | 13.7 | 1.2 | 1.9 | 1.2 | 12.4 | 22.4 | 47.8 |
| Without disability | 9,561,000 | 14.1 | 1.4 | 1.5 | 1.2 | 12.1 | 24.7 | 45.1 |
| With disability | 643,000 | 12.8 | 0.9 | 1.7 | 0.8 | 12.6 | 21.2 | 49.9 |
| Female | 3,587,000 | 9.3 | 1.8 | 1.3 | 1.4 | 4.2 | 33.8 | 48.1 |
| White | 2,575,000 | 7.9 | 1.7 | 1.2 | 1.6 | 3.5 | 34.6 | 49.3 |
| Asian | 471,000 | 18.5 | 2.8 | 1.9 | 1.1 | 7.4 | 29.5 | 38.9 |
| Black or African American | 232,000 | 9.9 | 1.3 | 0.9 | 0.4 | 3.0 | 37.5 | 47.0 |
| Hispanic |
208,000 | 5.8 | 1.9 | 1.0 | 1.0 | 4.8 | 30.3 | 55.3 |
| Native |
13,000 | S | D | D | D | 7.7 | 46.2 | 38.5 |
| Pacific Islander | 16,000 | D | D | D | D | S | 37.5 | 43.8 |
| Multiple race | 72,000 | 8.3 | S | S | 1.4 | 5.6 | 29.2 | 52.8 |
| Without disability | 3,397,000 | 9.3 | 1.9 | 1.3 | 1.4 | 4.3 | 34.0 | 47.9 |
| With disability | 190,000 | 8.9 | 1.6 | 1.6 | 1.6 | 2.1 | 31.1 | 53.2 |
| Male | 6,617,000 | 16.6 | 1.2 | 1.6 | 1.0 | 16.4 | 19.4 | 43.9 |
| White | 5,063,000 | 14.6 | 1.1 | 1.6 | 1.0 | 16.3 | 19.0 | 46.4 |
| Asian | 840,000 | 30.7 | 1.7 | 1.7 | 0.8 | 18.8 | 20.4 | 26.1 |
| Black or African American | 238,000 | 15.1 | 0.8 | 0.8 | S | 11.3 | 17.2 | 53.8 |
| Hispanic |
334,000 | 12.6 | 1.5 | 1.8 | 0.6 | 16.2 | 24.0 | 43.4 |
| Native |
23,000 | 17.4 | D | * | D | 8.7 | 26.1 | 43.5 |
| Pacific Islander | 29,000 | 13.8 | D | D | D | 20.7 | 20.7 | 37.9 |
| Multiple race | 89,000 | 18.0 | S | 2.2 | S | 16.9 | 16.9 | 43.8 |
| Without disability | 6,164,000 | 16.8 | 1.2 | 1.6 | 1.0 | 16.4 | 19.5 | 43.5 |
| With disability | 453,000 | 14.3 | 0.9 | 1.8 | 0.4 | 17.0 | 17.0 | 48.6 |
* = estimate < 500; D = suppressed for confidentiality; S = suppressed for reliability.
S&E = science and engineering.
NOTES: Scientists and engineers include persons who have ever received a U.S. bachelor's or higher degree in an S&E or S&E-related field through 30 June 2007, persons holding a non-S&E bachelor's or higher degree who were employed in an S&E or S&E-related occupation on 1 October 2003, and persons who held a non-U.S. S&E degree and were in the United States on 1 October 2003. See http://sestat.nsf.gov/docs/occ03maj.html for a detailed description of the occupational classification. American Indians or Alaska Natives, Asians, blacks or African Americans, Native Hawaiians or Other Pacific Islanders, whites, and persons reporting more than one race refer to individuals who are not of Hispanic origin. Persons of Hispanic origin may be of any race. Numbers are rounded to the nearest thousand. Detail may not add to total because of rounding.
SOURCE: National Science Foundation/National Center for Science and Engineering Statistics, Scientists and Engineers Statistical Data System (SESTAT): 2008.
TABLE F-3 Scientists and engineers employed in industry, by sex, race/ethnicity, disability status, and primary/secondary work activity: 2008 (Percent)
| Sex, race/ethnicity, and disability status | All work activities ( |
Research and development | Management, sales, or administrationb | Computer applications | Teaching |
|---|---|---|---|---|---|
| Both sexes | 10,204,000 | 30.0 | 68.8 | 15.2 | 5.7 |
| White | 7,639,000 | 28.8 | 71.0 | 13.5 | 5.6 |
| Asian | 1,311,000 | 39.7 | 55.8 | 27.3 | 4.0 |
| Black or African American | 470,000 | 24.7 | 68.5 | 12.3 | 10.0 |
| Hispanic | 542,000 | 28.2 | 69.7 | 12.4 | 7.4 |
| American Indian or Alaska Native | 36,000 | 27.8 | 63.9 | 8.3 | S |
| Native Hawaiian or Other Pacific Islander | 44,000 | 27.3 | 70.5 | 11.4 | 6.8 |
| Multiple race | 161,000 | 29.8 | 69.6 | 13.7 | 5.6 |
| Without disability | 9,561,000 | 30.1 | 68.8 | 15.2 | 5.7 |
| With disability | 643,000 | 29.1 | 69.4 | 14.0 | 5.4 |
| Female | 3,587,000 | 22.2 | 66.6 | 9.9 | 10.2 |
| White | 2,575,000 | 20.7 | 68.5 | 8.6 | 10.6 |
| Asian | 471,000 | 30.8 | 56.7 | 18.9 | 6.2 |
| Black or African American | 232,000 | 20.3 | 64.2 | 8.6 | 14.2 |
| Hispanic | 208,000 | 23.1 | 69.2 | 7.7 | 10.1 |
| American Indian or Alaska Native | 13,000 | S | 61.5 | S | S |
| Native Hawaiian or Other Pacific Islander | 16,000 | 25.0 | 62.5 | D | D |
| Multiple race | 72,000 | 22.2 | 66.7 | 11.1 | 6.9 |
| Without disability | 3,397,000 | 22.3 | 66.7 | 9.9 | 10.2 |
| With disability | 190,000 | 19.5 | 65.8 | 10.5 | 8.9 |
| Male | 6,617,000 | 34.3 | 70.0 | 18.0 | 3.2 |
| White | 5,063,000 | 33.0 | 72.3 | 16.0 | 3.0 |
| Asian | 840,000 | 44.8 | 55.2 | 31.9 | 2.6 |
| Black or African American | 238,000 | 29.0 | 72.7 | 16.0 | 6.3 |
| Hispanic | 334,000 | 31.4 | 70.1 | 15.3 | 5.7 |
| American Indian or Alaska Native | 23,000 | 30.4 | 65.2 | 8.7 | D |
| Native Hawaiian or Other Pacific Islander | 29,000 | 31.0 | 72.4 | 17.2 | D |
| Multiple race | 89,000 | 36.0 | 71.9 | 15.7 | 4.5 |
| Without disability | 6,164,000 | 34.3 | 69.9 | 18.2 | 3.1 |
| With disability | 453,000 | 33.1 | 70.9 | 15.5 | 4.0 |
D = suppressed for confidentiality; S = suppressed for reliability.
aTotal includes other work activities (production, operations, or maintenance; professional services; or other) not broken out separately.
bIncludes respondents who reported the following work activities: accounting, finance or contracts, employee relations, quality or productivity management, sales and marketing, or managing and supervising.
NOTES: Scientists and engineers include persons who have ever received a U.S. bachelor's or higher degree in a science and engineering (S&E) or S&Erelated field through 30 June 2007, persons holding a non-S&E bachelor's or higher degree who were employed in an S&E or S&E-related occupation on 1 October 2003, and persons who held a non-U.S. S&E degree and were in the United States on 1 October 2003. See http://sestat.nsf.gov/docs/occ03maj.html for a detailed description of the occupational classification. American Indians or Alaska Natives, Asians, blacks or African Americans, Native Hawaiians or Other Pacific Islanders, whites, and persons reporting more than one race refer to individuals who are not of Hispanic origin. Persons of Hispanic origin may be of any race. Numbers are rounded to the nearest thousand. Detail may not add to total because of rounding and multiple response to work activity. Totals sum to more than 100% because respondents could select both a primary and a secondary work activity.
SOURCE: National Science Foundation/National Center for Science and Engineering Statistics, Scientists and Engineers Statistical Data System (SESTAT): 2008.
Management
Just over 1 in 10 scientists and engineers working in industry are managers. Men and women and the various racial/ethnic groups differ in their propensity to be managers, partly reflecting differences in age distributions. Among scientists and engineers in the United States, women are younger on average than men, and minorities are younger on average than whites.7 Among scientists and engineers within industry, men are more likely than women to be managers, both mid-level and top-level managers, executives, and administrators within most racial/ethnic groups and regardless of disability status (Table F-4). Asians, blacks, and persons who reported multiple races are less likely than whites to be managers. Similar proportions of persons with and without disabilities are managers.
___________________
7National Science Board (NSB). 2010. Science and Engineering Indicators 2010. NSB 10-01. Arlington, VA: National Science Foundation.
TABLE F-4 Scientists and engineers employed in industry, by sex, race/ethnicity, disability status, and management occupation: 2008 (Percent)
| Sex, race/ethnicity, and disability status | All occupations ( |
All managers ( |
Top-level managers, executives, or administrators | Mid-level S&E managers | Mid-level non-S&E managers | Nonmanagers ( |
|---|---|---|---|---|---|---|
| Both sexes | 10,204,000 | 1,108,000 | 5.8 | 3.1 | 2.0 | 9,095,000 |
| White | 7,639,000 | 900,000 | 6.4 | 3.1 | 2.3 | 6,738,000 |
| Asian | 1,311,000 | 97,000 | 3.6 | 2.9 | 0.9 | 1,214,000 |
| Black or African American | 470,000 | 36,000 | 3.0 | 3.0 | 1.7 | 434,000 |
| Hispanic | 542,000 | 54,000 | 5.2 | 3.0 | 1.8 | 488,000 |
| American Indian or Alaska Native | 36,000 | 5,000 | 8.3 | 5.6 | D | 32,000 |
| Native Hawaiian or Other Pacific Islander | 44,000 | 5,000 | S | D | D | 39,000 |
| Multiple race | 161,000 | 10,000 | 4.3 | 1.2 | 0.6 | 151,000 |
| Without disability | 9,561,000 | 1,044,000 | 5.8 | 3.1 | 2.0 | 8,517,000 |
| With disability | 643,000 | 64,000 | 5.0 | 2.6 | 2.2 | 579,000 |
| Female | 3,587,000 | 206,000 | 2.4 | 1.8 | 1.6 | 3,381,000 |
| White | 2,575,000 | 160,000 | 2.4 | 1.9 | 1.8 | 2,416,000 |
| Asian | 471,000 | 20,000 | 2.8 | 1.1 | 0.4 | 451,000 |
| Black or African American | 232,000 | 12,000 | 1.7 | 2.2 | 1.3 | 221,000 |
| Hispanic | 208,000 | 12,000 | 2.9 | 1.0 | 1.9 | 196,000 |
| American Indian or Alaska Native | 13,000 | S | D | D | D | 12,000 |
| Native Hawaiian or Other Pacific Islander | 16,000 | D | D | D | D | 15,000 |
| Multiple race | 72,000 | 2,000 | D | S | D | 70,000 |
| Without disability | 3,397,000 | 196,000 | 2.5 | 1.7 | 1.6 | 3,201,000 |
| With disability | 190,000 | 10,000 | S | 2.6 | S | 180,000 |
| Male | 6,617,000 | 902,000 | 7.6 | 3.8 | 2.3 | 5,715,000 |
| White | 5,063,000 | 741,000 | 8.4 | 3.8 | 2.5 | 4,322,000 |
| Asian | 840,000 | 77,000 | 4.0 | 3.9 | 1.3 | 763,000 |
| Black or African American | 238,000 | 25,000 | 4.6 | 3.8 | 2.1 | 213,000 |
| Hispanic | 334,000 | 42,000 | 6.6 | 4.2 | 1.8 | 292,000 |
| American Indian or Alaska Native | 23,000 | 4,000 | 13.0 | D | D | 19,000 |
| Native Hawaiian or Other Pacific Islander | 29,000 | 5,000 | S | D | D | 24,000 |
| Multiple race | 89,000 | 8,000 | 7.9 | 1.1 | S | 81,000 |
| Without disability | 6,164,000 | 848,000 | 7.7 | 3.9 | 2.2 | 5,316,000 |
| With disability | 453,000 | 54,000 | 6.4 | 2.9 | 2.6 | 399,000 |
D = suppressed for confidentiality; S = suppressed for reliability.
S&E = science and engineering.
NOTES: Scientists and engineers include persons who have ever received a U.S. bachelor's or higher degree in an S&E or S&E-related field through 30 June 2007, persons holding a non-S&E bachelor's or higher degree who were employed in an S&E or S&E-related occupation on 1 October 2003, and persons who held a non-U.S. S&E degree and were in the United States on 1 October 2003. See http://sestat.nsf.gov/docs/occ03maj.html for a detailed description of the occupational classification. American Indians or Alaska Natives, Asians, blacks or African Americans, Native Hawaiian or Other Pacific Islanders, whites, and persons reporting more than one race refer to individuals who are not of Hispanic origin. Persons of Hispanic origin may be of any race. Numbers are rounded to the nearest thousand. Detail may not add to total because of rounding.
SOURCE: National Science Foundation/National Center for Science and Engineering Statistics, Scientists and Engineers Statistical Data System (SESTAT): 2008.
Data Sources and Availability
Data presented here are from the 2008 Scientists and Engineers Statistical Data System (SESTAT), which comprises three large demographic and workforce surveys of individuals conducted by the National Science Foundation: the National Survey of College Graduates, the
National Survey of Recent College Graduates, and the Survey of Doctorate Recipients. The 2008 SESTAT included 100,313 individuals representing a population of about 19 million scientists and engineers, including people trained in S&E or S&E-related fields or working in S&E or S&E-related occupations. The 2008 SESTAT surveys had a reference week of 1 October 2008. All demographic, employment, and education data on scientists and engineers represent the status of these individuals during the reference week. The full set of detailed tables from the SESTAT integrated database will be available in the forthcoming report Characteristics of Scientists and Engineers in the United States: 2008 at www.nsf.gov/statistics/us-workforce/.
Definitions
Scientists and engineers: Persons who have ever received a U.S. bachelor's or higher degree in an S&E or S&E-related field through 30 June 2007, persons holding a non-S&E bachelor's or higher degree who were employed in an S&E or S&E-related occupation on 1 October 2003, and persons who held a non-U.S. S&E degree and were in the United States on 1 October 2003.
S&E fields: Biological/agricultural/environmental life sciences, computer and information sciences, mathematics and statistics, physical sciences, psychology, social sciences, and engineering. S&E related fields include health, science and mathematics teacher education, technology and technical fields, and other S&E-related fields, such as architecture/environmental design and actuarial science. See http://sestat.nsf.gov/docs/ed03maj.html for a detailed description of the educational classification.
S&E occupations: Computer and mathematical scientists; biological, agricultural, and other life scientists; physical and related scientists; social and related scientists; and engineers. S&E-related occupations include health-related occupations, S&E managers, S&E precollege teachers, S&E technicians and technologists, and other S&E-related occupations, such as architects and actuaries. See http://sestat.nsf.gov/docs/occ03maj.html for a detailed description of the occupational classification.
Race/ethnicity: All graduates, both U.S. citizens and non-U.S. citizens, are included in the race/ethnicity data presented in this report. American Indians or Alaska Natives, Asians, blacks or African Americans, Native Hawaiians or Other Pacific Islanders, whites, and persons reporting more than one race refer to individuals who are not of Hispanic origin. Persons of Hispanic origin may be of any race.
Disability: The SESTAT surveys ask the degree of difficulty—none, slight, moderate, severe, unable to do—an individual has in seeing (with glasses/contact lenses), hearing (with hearing aid), walking without assistance, or lifting 10 pounds. Respondents who answered "moderate," "severe," or "unable to do" for any activity were classified as having a disability.
Primary and secondary work activities: These activities were self-defined by the respondent in response to the following question: "On which two activities... did you work the most hours during a typical week on this job?" Numbers for work activities sum to more than 100% because of multiple responses.


