
1
Where Are Scientists and Engineers Working Today? Data from the National Science Foundation
DIVERSITY IN SCIENCE AND ENGINEERING EMPLOYMENT IN INDUSTRY
Efforts to maximize the recruitment, retention, and advancement of women and underrepresented minorities (URMs)1 in industries that have a large science and engineering (S&E) component require better understanding of where scientists and engineers are working today. Based on a congressional mandate, the National Science Foundation’s (NSF) National Center for Science and Engineering Statistics (NCSES) collects and distributes a wide range of data relevant to policy in a policy-neutral manner.
Jaquelina C. Falkenheim, senior analyst at NSF, opened the workshop with a detailed review of the most recent data on “sex, racial/ethnic, and disability characteristics of scientists and engineers employed in industry, including breakouts by highest educational degree, occupation, primary and secondary work activity, and management occupations,”2 defining scientists and engineers as those who either are trained in or work in S&E or S&E-related fields or occupations (Table 1.1).
In 2008, Falkenheim explained, 19 million scientists and engineers were employed in the United States, of which 4.9 million were employed in S&E occupations, 5.5 million in S&E-related occupations, and 8.8 million with S&E-related degrees were employed in non-S&E occupations (Figure 1.1). About 53 percent (10.2 million) of these 19 million scientists and engineers were employed in industry. NSF defines industry as including private, for-profit noneducational institutions; persons who are self-employed and incorporated; and other for-profit noneducational employers.3
___________________
1URM is an acronym for underrepresented minorities. The National Science Foundation, in the fields of science, engineering, mathematics, and technology (STEM), includes African Americans, Hispanics, American Indians, Alaska Natives, Native Hawaiians, other Pacific Islanders, and individuals reporting more than one race in this definition.
2Her presentation drew from Jaquelina C. Falkenheim and Joan S. Burrelli. 2012. “Diversity in Science and Engineering Employment in Industry.” InfoBrief. Arlington, VA: National Science Foundation/National Center for Science and Engineering Statistics. Available at www.nsf.gov/statistics/infbrief/nsf12311/ (accessed May 16, 2014). Quoted material, p. 1.
3See Appendix F: Jaquelina C. Falkenheim and Joan S. Burrelli. 2012. “Diversity in Science and Engineering Employment in Industry.” InfoBrief. Arlington, VA: National Science Foundation/National Center for Science and Engineering Statistics. Available at www.nsf.gov/statistics/infbrief/nsf12311/ (accessed February 8, 2013).
Table 1.1 NSF Classification of Science and Engineering (S&E), S&E-related, and Non-S&E Degree Fields and Occupations.
| Classification | Degree Fields | Occupations |
| S&E | Biological, agricultural, and environmental life sciences; Computer and mathematical sciences; Physical sciences; Social sciences; and Engineering | Biological, agricultural, and environmental life scientists; Computer and mathematical scientists; Physical scientists; Social scientists; Engineers; and S&E postsecondary teachers |
| S&E-related | Health fields; Science and math teacher education; Technology and technical fields; Architecture; and Actuarial science | Health-related occupations; S&E managers; S&E precollege teachers; S&E technicians and technologists; Architects; Actuaries; and S&E-related postsecondary teachers |
| Non-S&E | Management and administration; Education (except science and math teacher education); Social services and related fields; Sales and marketing; Arts and humanities; and Other fields | Non-S&E managers; Management-related; Non-S&E precollege teachers; Non-S&E postsecondary teachers; Social services; Sales and marketing; Arts and humanities; and Others. |
SOURCE: Science and Engineering Indicators 2012, Table 3-2.
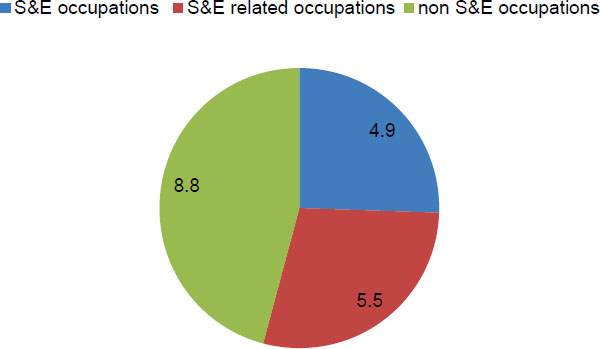
FIGURE 1.1 Number of Scientists and Engineers Employed in S&E Occupations, S&E-related Occupations, and Non-S&E Occupations (in millions), 2008.
SOURCE: National Science Foundation (NSF)/National Center for Science and Engineering Statistics (NCSES), SESTAT 2008.4
___________________
4SESTAT is the NSF Scientists and Engineers Statistical Data System. This integrated data system is a unique source of longitudinal information on the education and employment of the college-educated US science and engineering workforce. These data are collected through three biennial surveys: (1) the National Survey of College Graduates (NSCG); (2) the National Survey of Recent College Graduates (NSRCG); and (3) the Survey of Doctorate Recipients (SDR). The 2008 data were the most recent available at the time of the workshop.
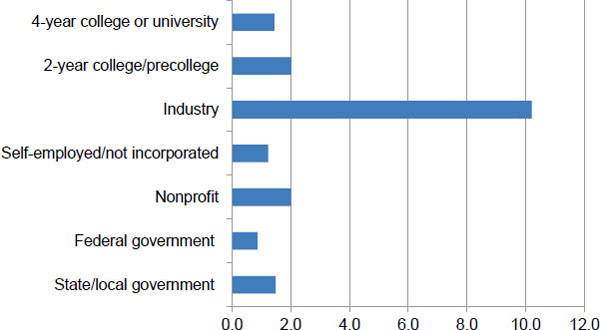
FIGURE 1.2 Employed Scientists and Engineers by Sector of Employment (millions), 2008.
SOURCE: NSF/NCSES, SESTAT 2008.
Figure 1.2 illustrates the fields, in addition to industry, in which scientists and engineers work. Drilling down further, Falkenheim reported on scientists and engineers by sex and race/ethnicity (Figure 1.3). Of the 10.2 million scientists and engineers employed in industry in 2008, 50 percent were white men and 25 percent white women; Asian men and women accounted for 8 percent and 5 percent, respectively, and URM men and women 6 percent and 4 percent. The 2008 data show that in both the industrial and total S&E workforce, compared to the total US population broken down by sex, men are disproportionally represented (Figure 1.4).5
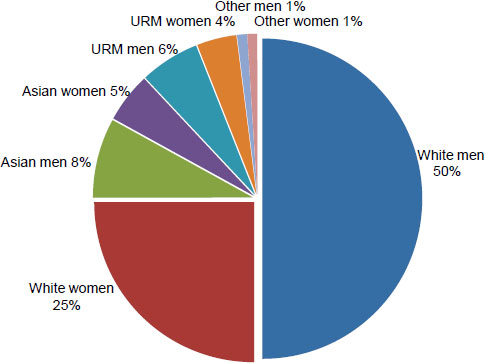
FIGURE 1.3 Scientists and Engineers Employed in Industry by Sex and Race/Ethnicity in 2008.
NOTE: URM = underrepresented minority (Hispanics, blacks or African Americans, and American Indians/Alaska Natives); Other = Native Hawaiians or other Pacific Islanders and individuals reporting more than one race.
SOURCE: NSF/NCSES, SESTAT 2008.
___________________
5As a point of clarification, Falkenheim noted that for the purposes of the data collected, “functional disabilities” were recorded. The number of respondents with disabilities is small, and they tend to be older people whose disabilities appear over time rather than those who enter their careers with functional disabilities.
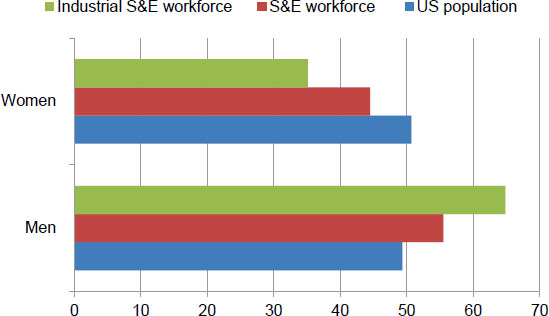
FIGURE 1.4 Percentage of the Science and Engineering (S&E) Workforce by Sex, 2008.
SOURCES: Women, Minorities, and Persons with Disabilities in Science and Engineering (www.nsf.gov/statistics/wmpd, accessed September 1, 2012); and NSF/NCSES, SESTAT 2008.
The breakdown of the S&E workforce by race/ethnicity (Figure 1.5) shows that whites are overrepresented in comparison to the total US population, as are Asians. In contrast, certain groups are significantly underrepresented in the S&E workforce: black or African American men and women each accounted for 2 percent, Hispanic men 3 percent and women 2 percent, and American Indian men 0.2 percent and women 0.1 percent. Thus, although African Americans, Hispanics, and American Indians constitute more than a quarter of the total US population, they account for only about 10.8 percent of the S&E workforce and 10.4 percent of the S&E industrial workforce.
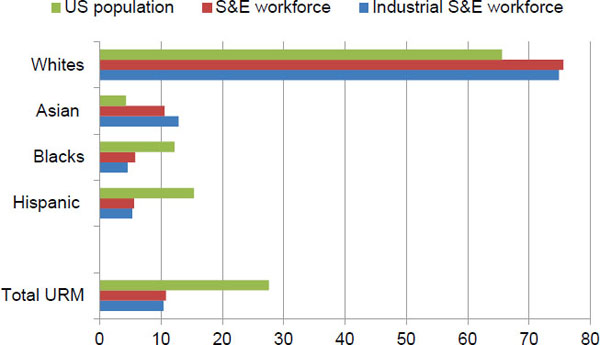
FIGURE 1.5 Percentage of the Science and Engineering (S&E) Workforce by Race/Ethnicity, 2008.
NOTE: URM = underrepresented minority (Hispanics, blacks, and American Indians/Alaska Natives).
SOURCES: Women, Minorities, and Persons with Disabilities in Science and Engineering (www.nsf.gov/statistics/wmpd, accessed September 1, 2012); and NSF/NCSES, SESTAT 2008.
Falkenheim noted that of the 10.2 million scientists and engineers who work in industry, more than 6 million hold bachelor’s degrees (63 percent), another 25 percent have master’s degrees, and 3 percent have doctoral degrees. About 9 percent of scientists and engineers who work in industry hold professional degrees.6,7 Male scientists and engineers have higher levels of education than do women scientists and engineers, and Asian scientists and engineers hold more master’s and doctoral degrees than do whites, blacks, or Hispanics (Figure 1.6).
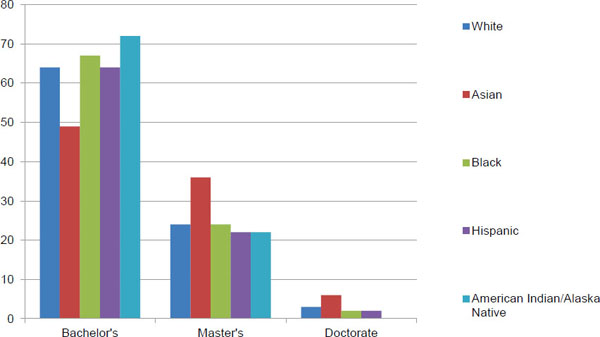
FIGURE 1.6 Highest Educational Degree in the Science and Engineering Industrial Workforce by Race/Ethnicity, 2008 (percent).
NOTES: For the purposes of its survey, NSF defined “industry” to include for-profit institutions and organizations. These figures do not include professional degrees.
SOURCE: NSF/NCSES, SESTAT 2008.
Analysis of the occupations of the 10.2 million scientists and engineers in industry reveals that over 40 percent of men and nearly 50 percent of women work in non-S&E occupations8 (Figure 1.7).
___________________
6“Professional Science Master’s (PSM) programs were designed to prepare people to work primarily in nonacademic sectors as laboratory administrators or project directors in, for example, large government or industrial laboratories or in small startup companies. They serve people who need advanced technical training (beyond the bachelor’s degree) within an S&E field combined with knowledge of and skills in business fundamentals, management, team building, and communication.” For more details about Professional Science Master’s degrees, please refer to Science and Engineering Indicators, 2010, page 2-22. Available at www.nsf.gov/statistics/seind10/pdf/seind10.pdf.
7Falkenheim and Burrelli, p. 2.
8See Table 1.1 for the listing of S&E occupations, S&E-related occupations, and non-S&E-related occupations. For more detailed classification of occupations and degrees by S&E, S&E-related, and non-S&E, see NSF Scientists and Engineers Statistical Data System (SESTAT), http://sestat.nsf.gov/docs/occ03maj.html and http://sestat.nsf.gov/docs/ed03maj.html (accessed May 16, 2014).
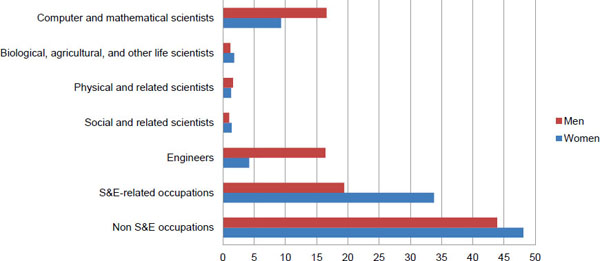
FIGURE 1.7 Occupations of Scientists and Engineers Employed in Industry by Sex, 2008 (percent).
SOURCE: NSF/NCSES, SESTAT 2008.
The NSF data on the industry-based fields in which scientists and engineers of different races and ethnicities work show that Asians are the largest group working in computer and mathematical sciences and blacks the smallest group working as engineers, Falkenheim said. Hispanics are the smallest group in the computer and mathematical scientists category (Figure 1.8).
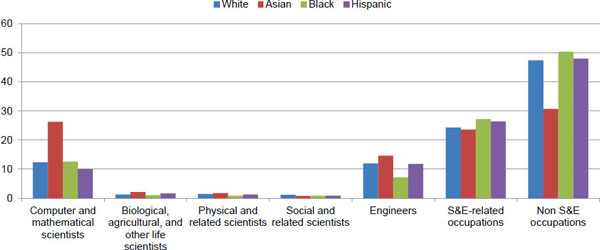
FIGURE 1.8 Occupations of Scientists and Engineers Employed in Industry by Race/Ethnicity, 2008 (percent).
SOURCE: NSF/NCSES, SESTAT 2008.
Falkenheim reported that further examination of the data reveals that 18.8 percent of engineers employed in industry are Asian men, compared to just over 16 percent for white and Hispanic men and just over 11 percent for black men. Compared to women engineers of other racial/ethnic groups, Asian women represented the largest percentage (7 percent) of those
employed in industry. Hispanic women represent approximately 5 percent of engineers working in industry, white women nearly 4 percent, and black women approximately 3 percent.9
The proportions of computer and mathematical scientists employed in industry, by sex and race/ethnicity, were similar to those of engineers, Falkenheim continued. Asian men again represented the largest number, accounting for about 31 percent of computer and mathematical scientists employed in industry; black men and white men represented roughly 15 and 14 percent respectively, and Hispanic men represented about 13 percent of the same group. Among women, Asians were again the highest percentage of computer and mathematical scientists employed in industry, at roughly 18 percent. Black women represented 10 percent, white women roughly 8 percent, and Hispanic women about 6 percent.10
The data that generated the most discussion among workshop participants were those associated with primary and secondary work activities of scientists and engineers employed in industry, particularly with respect to management work activities. Falkenheim summarized the survey results on the respondents’ primary and secondary work activities: (1) research and development; (2) management, sales, or administration; (3) computer applications; and (4) teaching. Respondents were asked to note which of 14 work activities best represented the work they did at their jobs. Then their responses were grouped into the four areas of primary or secondary work activities.11 The survey results, presented based on sex (Figure 1.9) and race/ethnicity (Figure 1.10), reveal that men employed in the S&E industrial workforce are significantly more likely to be engaged in scientific and technical work such as research and development and computer applications, while women’s job responsibilities are relatively more likely to include teaching.
___________________
9Falkenheim and Burrelli. 2012. Diversity in Science and Engineering Employment in Industry. NSF 12-311, available at www.nsf.gov/statistics/infbrief/nsf12311/.
10Falkenheim, workshop presentation.
11The description of the primary and secondary work activities as provided on the survey is as follows: (1) research and development work activities include basic research, development, and design; (2) computer applications includes computer programming, systems or applications development; (3) teaching includes teaching; (4) management, sales, or administration includes accounting, finance or contracts, employee relations, quality or productivity management, sales and marketing, or managing and supervising; and (5) other includes categories of production, operations, or maintenance; professional services; or other activities. “Other” work activities were included in the total but were not broken out separately. The specific wording of the survey question was: “The next question is about your work activities on your principal job. Which of the following work activities occupied at least 10 percent of your time during a typical work week on this job?” Respondents were to mark “Yes” or “No” for each of the following: (1) Accounting, finance, contracts; (2) Basic research – study directed toward gaining scientific knowledge primarily for its own sake; (3) Applied research – study directed toward gaining scientific knowledge to meet a recognized need; (4) Development – using knowledge gained from research for the production of materials and devices; (5) Design of equipment, processes, structures, models; (6) Computer programming, systems of applications development; (7) Human resources – including recruiting, personnel development, training; (8) Managing or supervising people or projects; (9) Production, operations, maintenance (e.g., chip production, operating lab equipment); (10) Professional services (e.g., health care, counseling, financial services, legal services); (11) Sales, purchasing, marketing, customer service, public relations; (12) Quality or productivity management; (13) Teaching; (14) Other (applicants were allowed to write in an answer). Next, applicants were asked “On which two activities in [the question above] did you work the most hours during a typical week on this job?” For details about the specific wording of the questions, see: http://nsf.gov/statistics/srvyrecentgrads/surveys/srvyrecentgrads_2008.pdf, page 7.
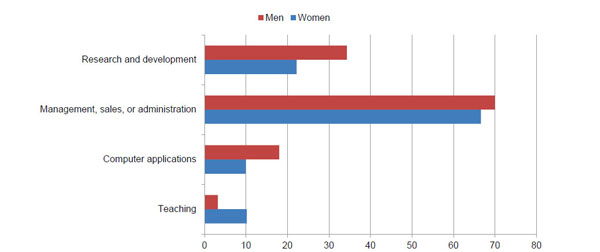
FIGURE 1.9 Primary/Secondary Work Activity of Scientists and Engineers Employed in Industry by Sex, 2008 (percent).
NOTE: Totals sum to more than 100 percent because respondents could select both a primary and secondary work activity.
SOURCE: NSF/NCSES, SESTAT 2008.
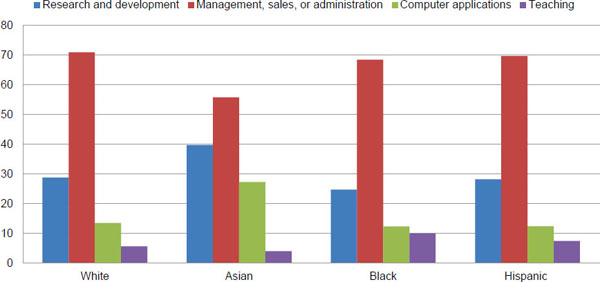
FIGURE 1.10 Primary/Secondary Work Activity of Scientists and Engineers Employed in Industry by Race/Ethnicity, 2008 (percent).
NOTE: Totals sum to more than 100 percent because respondents could select both a primary and secondary work activity.
SOURCE: NSF/NCSES, SESTAT 2008.
Management jobs accounted for approximately 1 million of the 10.2 million scientists and engineers working in industry in 2008. Among male scientists and engineers who are employed in industry, 15 percent are in managerial positions. Only 5 percent of female scientists and
engineers employed in industry are managers.12 Broken down by management level, the data show that among scientists and engineers in industry, men were more likely than women to be top-level executives, managers, and administrators, and mid-level S&E managers. Non-S&E mid-level managers are also more likely to be men than women (Figure 1.11).
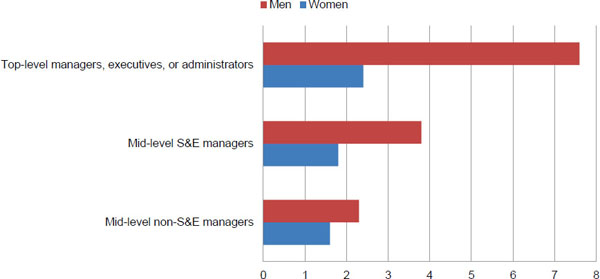
FIGURE 1.11 Percentage of Scientists and Engineers Employed in Industry, by Managerial Occupation and Sex, 2008.
NOTE: Percent is based on those who are managers.
SOURCE: NSF/NCSES, SESTAT 2008.
Further analysis of the management data reveals that male Asian, black, and Hispanic scientists and engineers working in industry are less likely than whites to be managers.13 Indeed, white male scientists and engineers in industry are much more highly represented among managers (72 percent) than either white women (about 11 percent) or representatives of any other race or ethnicity regardless of sex (Figure 1.12C). Asian men represented 5.8 percent of top-level managers, Asian women 2.2 percent, URM men 5.2 percent, URM women 4 percent, and “other” men and women (native Hawaiians or other Pacific Islanders and individuals reporting more than one race) 0.9 percent each.
Falkenheim concluded by presenting data comparing the percentages of the total US population by sex and race/ethnicity with all scientists and engineers employed in industry by sex and race/ethnicity, and those who are top-level managers by sex and race/ethnicity (Figure 1.12).
___________________
12Falkenheim, workshop presentation.
13Falkenheim, workshop presentation.
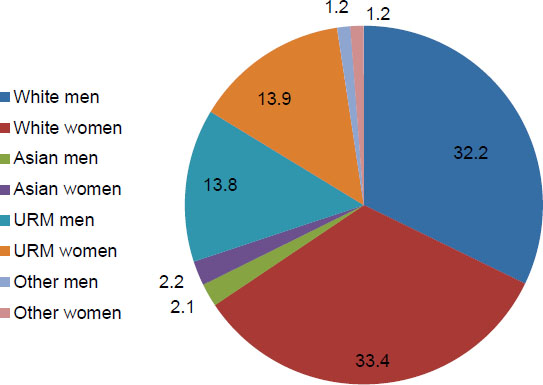
FIGURE 1.12 (A) US Population by Sex and Race/Ethnicity, 2008.
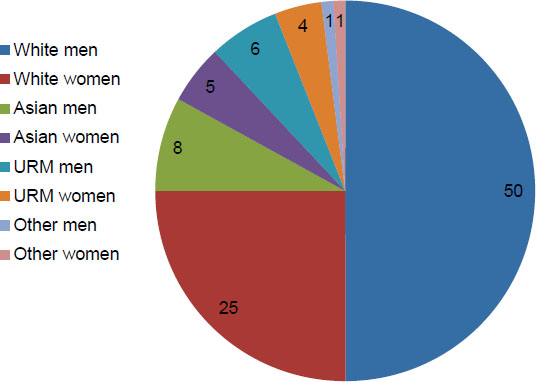
FIGURE 1.12 (B) Scientists and Engineers Employed in Industry, by Sex and Race/Ethnicity, 2008.
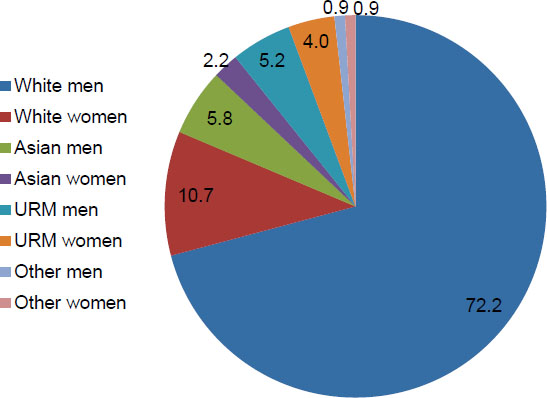
FIGURE 1.12 (C) Scientists and Engineers Employed in Industry Who Are Top-level Managers/Executives, by Sex and Race/Ethnicity, 2008.
NOTES: URM = underrepresented minority (Hispanics, blacks, and American Indians/Alaska Natives); other = native Hawaiians or other Pacific Islanders and individuals reporting more than one race.
SOURCES: NSF/NCSES, Women, Minorities, and Persons with Disabilities in S&E, 2011; SESTAT, 2008.
The data reveal stark contrasts for women and URMs who work in S&E industries. In 2008, white men made up 32 percent and white women 33 percent of the US population. Yet white men accounted for 50 percent of the scientists and engineers employed in industry, and they are further overrepresented as top-level managers (72 percent). White women represented 25 percent of scientists and engineers employed in industry, but only 11 percent of the top-level managers. Black men and women each represented 6 percent of the US population but only 2 percent of the S&E workforce, where black men represented 2 percent of top-level managers and black women 1 percent; thus, although they are underrepresented in the S&E industrial workforce, they are proportionally represented as top-level managers. Hispanic men and women, who each made up 8 percent of the US population, accounted for 3 percent and 2 percent, respectively, of scientists and engineers working in industry and 4 percent and 1 percent of top-level managers in industry.14 Several workshop participants hypothesized that a disaggregation of these data by industry would show further variance.
DISCUSSION OF DATA AND SUGGESTIONS FOR FUTURE RESEARCH
Participants raised questions and made suggestions for future research that may provide a more comprehensive and nuanced picture of female and underrepresented minority scientists and engineers working in industry.
It was pointed out by some workshop participants that accounting for age might yield a better sense of trends over time; for example, baby boomers are working longer, and this lack of job turnover may exacerbate the challenge of recruiting more underrepresented minorities to science and engineering jobs in the coming decade. In addition, while many believe that the situation of
___________________
14Falkenheim, workshop presentation.
URMs has improved over the last 25 years, this assumption should be scrutinized with data. Falkenheim noted that while available data indicate that younger respondents are more diverse, the situation is complex; for example, there are many Asian immigrants in the science and engineering workforce, but they are not always younger. It is clear that the absolute number of underrepresented minority scientists and engineers is growing, however. Duane Dunlap, associate dean at Purdue University, cautioned that if the trends in industry are similar to those in academia, people may tend to stay in their jobs longer due to the economic downturn, which may affect trends in the career paths of women and URMs. The long-term trends therefore remain uncertain.
Considering the data indicating that underrepresented minorities constitute roughly the same proportion of both scientists and engineers in industry and top-level S&E managers in industry, Herman White, senior scientist at Fermi National Accelerator Laboratory, suggested that this may reflect a selection bias at the point of hiring. In other words, perhaps the only underrepresented minorities being hired are those who are perceived to have the greatest potential to advance. Falkenheim responded that she and her colleagues interpreted the data differently: They concluded that there is no drop-off of underrepresented minority men moving up into management, but there is for other groups. For example, Asians are overrepresented in the S&E industrial workforce but underrepresented in top-level management. Also, while women are represented in the S&E workforce, they are not moving up into management at the rates one might expect. Falkenheim suggested that these data may be the result of policies in effect for previous generations.
As a point of clarification, Falkenheim noted that for the purposes of this dataset, “functional disabilities” were recorded. The number of respondents with disabilities is small, and they tend to be older people whose disabilities appear over time rather than those who enter their careers with functional disabilities.
When Rick Stephens, senior vice president at the Boeing Company, asked if more recent data exist, Falkenheim explained that the NSF data are very high-quality but take time to collect and analyze. One participant suggested that NSF might collaborate with other organizations that collect industry-specific data, such as the annual Aviation Week survey, thereby gaining access to more recent data.
For discussions of primary and secondary work activity versus level of career attainment, Suzanne Jenniches, vice president and general manager (retired) at Northrop Grumman Corporation, cautioned against confusing “field” (e.g., pharmaceuticals) with “occupation” (e.g., research and development).
Regarding areas that may need further research, a question arose about the correlation between degree levels and advancement to management for underrepresented minorities: Is a PhD a ticket to rise in management for women and URMs? Or is race perhaps a larger determining factor in career pathways to management for underrepresented minorities? Because available data do not enable researchers to answer these questions, they were suggested for research and discussion.15
Some participants noted that experience indicates the substantial and beneficial effects of mentoring; further research could assess whether mentoring changes perceptions of minorities’ ability to advance—both self-perceptions and perceptions of those in a position to make decisions regarding advancement. One way to get at this correlation may be to ask respondents
___________________
15Another suggestion for further research would be to learn whether those who left stayed in S&E fields overall, left for promotions in the S&E fields overall, or left S&E fields entirely due to bias, perceptions, or inadequate support.
whether they have access to mentors, what helps them feel qualified, and what factors affect whether or not they look for a new job.
A final research question suggested by some participants concerned internal mobility. Many participants perceive that the way to work up to management positions is through the ranks of a single company. Others believe that one can attain a management position by leaving one’s company and seeking advancement through a more senior position in a different company. To study these issues, additional questions for research could include whether senior technical positions—those at a pay and recognition level equivalent to management—exist in these companies, and whether the visibility of these S&E senior technical positions helps retention. There may also be a correlation between length of time at one company and achievement of a top-level management position. White remarked that it is appropriate to bear in mind, however, that not all scientists and engineers working in industry want a management position, preferring instead to remain practicing scientists and engineers.
The session concluded with Falkenheim’s invitation for workshop participants to submit further feedback and suggestions for questions to include on future surveys on any topics of relevance, including questions about primary and secondary work activities. More focused and targeted questions may address a range of concerns and provide a more nuanced understanding of differences across fields, as well as a better understanding of what S&E employees actually do on their jobs.


