
Foundations for Monitoring Climate–Security Connections
Conclusion 6.1 sets out the five types of key phenomena for which monitoring to anticipate national security risks related to climate events is needed:
- Climate and other biophysical environment phenomena;
- The exposures of human populations and the systems that provide food, water, health, and other essentials for life and well-being;
- The susceptibilities of people, assets, and resources to harm from climate events;
- The ability to cope with, respond to, and recover from shocks; and
- The potential for outcomes of inadequate coping, response, and recovery to rise to the level of concern for U.S. national security.
There is substantial variation in the degree to which the expert communities that study and analyze these phenomena have achieved consensus about a set of key variables that are essential for monitoring. In many cases the foundation for identifying, collecting, and analyzing basic data is still under construction. The sections in this appendix reflect the committee’s judgment about some of the major data and monitoring needs and capacities related to the five types of key phenomena above. In addition, as discussed in Chapter 6, there are significant challenges associated with developing and applying the analytic techniques needed to turn ever-increasing amounts of data into useful information.
CLIMATE AND OTHER BIOPHYSICAL ENVIRONMENT PHENOMENA
The effects of human activity on the natural environment coupled with natural changes in the physical climate system make long-term monitoring of the global climate system crucial both to understanding the variability and changes in the Earth system and for providing inputs to model-based prediction schemes. As the human population continues to increase, so too will global demands on agricultural, water, and energy resources. Analyzing regional climate impacts and assessing human vulnerabilities will require high-frequency and spatially dense observations as well as information on the change and rate of change of the global climate system. Regional and national networks must be developed, particularly in regions currently experiencing an increased demand on natural resources. If sufficient observations are not collected, the ramifications will be serious, including less accurate weather forecasts and an inability to monitor natural hazards.
As discussed in Chapter 6, in 1998 the Intergovernmental Panel on Climate Change (IPCC) and the United Nations Framework Convention on Climate Change (UNFCCC) established specific requirements for systematic climate observations and a sustained observing system. Those requirements included supporting research to understand more fully the causes of climate change, to predict future global climate change, and to characterize extreme events important to impact assessments, adaptation, risks, and vulnerability. In 2003 the Second Adequacy Report on the Global Observing System (Global Climate Observing System, 2003) concluded that while improvements had been made in the global observing system, deficiencies remained in the global coverage and quality of ocean, atmosphere, and terrestrial measurements. The report concluded that satellite observations over all domains were essential to the global observing system and that they must continue uninterrupted. Despite such urging, however, U.S. satellite observation capabilities are expected to decline by 25 percent over the next 8 to 10 years, according to a recent National Research Council (NRC) report (National Research Council, 2012) on NASA’s implementation of the Decadal Survey. (See further discussion below.)
The Global Climate Observing System, sponsored by the World Meteorological Organization, the United Nations (UN) Educational, Scientific and Cultural Organization, the UN Environmental Program, and the International Council for Science, is charged with advising the community on global climate observations and overseeing implementation based on UNFCCC standards. In 2010 the organization developed a list of 50 essential climate variables (ECVs) that are possible to implement globally and whose observation could yield significant progress toward meeting the UNFCCC requirements (Global Climate Observing System, 2010). These ECVs are
concerned with atmospheric conditions over land, sea, and ice and include such variables as temperature, wind speed and direction, pressure, cloud properties, and carbon dioxide levels. Ocean ECVs include sea surface and subsurface temperature and salinity, ocean color, sea ice, sea level, oxygen, and nutrients. Most terrestrial observations focus on ground water, water use, snow cover, land cover, and soil moisture.
The ECVs represent a consensus on a broad and comprehensive set of parameters to document Earth’s climate system. Designed primarily to characterize key aspects of the Earth system, they are aimed more at informing scientific analysis more than policy decisions. There have, however, been several attempts to develop indices based on the ECVs that would yield an integrated measure of climate impacts that could be more useful for policy analysis. One such index is the U.S. Climate Extremes Index (CEI). It was developed as a “monitoring and communications tool to help U.S. citizens and policymakers identify possible trends or long-term variations in a variety of climate extremes indicators” (Gleason et al., 2008). The CEI is composed of five parameters: monthly minimum and maximum temperatures, daily precipitation, days with and without precipitation, and the Palmer Drought Severity Index (PDSI) (Palmer, 1965). Temperature is important for monitoring a variety of phenomena, including heat waves, cold waves (including freeze events such as late spring freezes), and even unusually warm or cold months and seasons that can have effects on a variety of sectors. Precipitation is the basic building block for monitoring precipitation deficits and excess, including drought and heavy rain events. Air pressure is important for monitoring storms, heat waves, and other events, while water vapor is important for monitoring the potential for heavy rain events and drought. The PDSI is a dryness indicator based on a combination of recent temperature and soil moisture observations.
The CEI was tailored for the continental United States. Currently there is an effort to develop a CEI that would provide a more globally integrated picture of the current state of climate extremes. However, the development of such a global CEI has been hampered by a lack of data availability in many regions and for most of the ECVs. A white paper prepared for the 2011 World Climate Research Programme Open Science Conference (Trenberth et al., 2012) concluded that although the data for ocean and atmospheric ECVs have adequate global coverage over a long enough time and sufficient quality, data for terrestrial measurements are seriously deficient. It also concluded that although existing in-situ data cover most of the high-priority regions, spatial and temporal coverage could be improved. It called for more integration of satellite data as well as for new observations that would provide information about such areas as climate change mitigation and adaptation efforts. Data at regional and local scales on such factors as soil moisture, stream flow, and sea surface temperature
that are related to climate events, are extremely inadequate. Soil moisture, for example, is important for monitoring drought as well as for estimating the potential for flooding. Streamflow is a good large-area integrator of short- and longer-term moisture conditions for a basin, a region, or even a continent. Sea surface temperature is especially important for tracking El Niño–Southern Oscillation events.
The white paper found that such data, as well as detailed hourly information on variables such as precipitation intensity, distribution, frequency, and amount of precipitation, are necessary for predicting extreme events on regional scales. Because there are not yet adequate data in these areas, it may be necessary to develop global indicators in an incremental fashion—for instance, by adding one or two parameters at a time or by beginning with specific regions that allow early development, such as Europe or Australia.
Numerous analyses have documented the linkages between global climate change and environmental sustainability (e.g., National Research Council, 2010a, 2010b, 2010c). One example is the way in which changes in ocean and atmospheric circulation force corresponding changes in ocean temperatures, which reach the ice shelves, resulting in land ice loss, sea level rise, and, ultimately, coastal erosion. Likewise, changes in precipitation patterns can affect the snowpack and surface hydrology, thereby affecting agricultural productivity. And increased carbon dioxide emissions absorbed by the ocean lead to increased ocean acidity, which destroys the marine organisms that provide food sources for other marine life and thus negatively affects fisheries. To understand these relationships it is necessary to measure a broad and diverse set of the variables that connect global climate change with human life-supporting systems such as those providing for food, energy, water, and health. Global-scale indicators and metrics based on a broad spectrum of observations can provide some advance warning of the impacts of global climate change (National Research Council, 2010b). Sea level rise is one such indicator, for example, because it is a function of oceanic, land ice, and hydrologic processes. However, to obtain better estimates and projections of rising sea levels it will be necessary to make better sustained observations of such variables as sea state, atmospheric wind speed and direction, sea-ice extent, the mass balance of mountain glaciers and ice sheets, and river discharge.
The United States and other countries do not currently have national strategies for sustaining long-term environmental observations. Joint efforts in support of the UNFCCC and IPCC are encouraging international collaboration, and many nations have recognized the need for a fully implemented observing system. However, funding is a major obstacle. Major gaps in satellite and in-situ observations are developing because of the loss of several key satellites, such as Cryosat, the Orbiting Carbon Observa-
tory, and Glory, and because of the reduced maintenance on the Tropical Ocean Atmospheric Array of ocean buoys and on land-based carbon towers. Delays or cancellation of other satellites will further increase the data gap. Lack of data will severely impair the ability of climate scientists to understand and forecast changes from interactions and feedbacks in the Earth system and will limit the information available to users and decision makers. Serious consequences will include less accuracy in forecasting and in the projecting of natural hazards and extreme events; as these events affect a growing population that is already placing significant stress on Earth’s systems and is expanding into areas exposed to likely climate hazards, the consequences will only grow with time.
The national and international efforts noted above have focused mainly on understanding and anticipating climate changes, climate events, and some of their direct consequences. The field has made progress in setting priorities, but its emphasis has not been on security issues. Such an emphasis would require types of monitoring not mentioned above. A considerable number of the types of monitoring relevant to security issues were identified in a previous report from the NRC, Monitoring Climate Change Impacts (National Research Council, 2010b). We note that many of the environmental variables that are important to human life-supporting systems cannot be measured readily or with sufficient resolution and accuracy from satellites and instead require place-based measurement and automated interrogation and assimilation. Examples of such variables include the quality of agricultural land, the condition of aquifers, and the ranges of key pests and pathogens.
In addition, to our knowledge there has as yet been no serious priority setting among environmental measurements, looking at the issue through the lens of security analysis. Thus the priorities noted here and in the previous NRC effort (National Research Council, 2010b) provide only a starting point toward prioritizing climate and environmental monitoring needs for security analysis purposes. Efforts to develop priorities should aim at identifying a small number of composite indices designed for the specific purposes of analysis or early warning. Progress will require additional work, which should be conducted through collaborations involving climate scientists, environmental scientists, social scientists, and security analysts. An effective monitoring system is feasible in principle, but it will require an authoritative setting of priorities, the integration of climate and social and political stress indicators, and the development of reliable protocols for international collaboration.
EXPOSURE TO POTENTIALLY DISPRUPTIVE CLIMATE EVENTS
Exposure refers to the presence of people, livelihoods, environmental services and resources, infrastructure, or economic, social, or cultural assets in places that could be adversely affected (Intergovernmental Panel on Climate Change, 2012:3). For security analysis it is important to recognize that different climate hazards matter for different places because each population and location of interest has a particular pattern of exposures and susceptibilities to harm as well as of abilities to cope and respond. Therefore, monitoring of exposures needs to include both changes in the frequency and intensity of potentially disruptive climate events and changes in the societal conditions that affect which people and things are exposed to harm from specific events and the different exposures of different segments of societies. This section focuses on the monitoring of people and things. It is, of course, equally important to monitor the hazards. Although some hazards, such as large-scale floods, are easy to monitor, others (e.g., droughts) are not presently well monitored. The following are, in our judgment, some of the monitoring requirements that are most important for estimating exposures to potentially disruptive climate events.
Population Estimates on Spatially Disaggregated Scales
Understanding how hazards might affect human societies requires a basic understanding of where people are located with respect to the hazards, and estimates of exposed populations form a fundamental building block of any vulnerability assessment. The most basic indicator is the number of people residing in a given area, sometimes called the headcount. In some cases one wants to know more demographic detail than simply the headcount, for example, the age structure, the number of orphans, the percentage of female-headed households, and so on. Such information is often available in national censuses.
In some cases the most important variable to estimate is not the number of residents in an area, but the total number of people located in the area at a given time, regardless of their residence. This total number of people in an area, including both residents and nonresidents, is sometimes referred to as the ambient population. For example, many of the people exposed to the Asian tsunami in 2004 were tourists, who were not counted in the local censuses. In other cases a region may have large numbers of migratory workers whose exposure is relevant to understanding risk but who are not counted in the censuses. An example is China prior to the 2008 financial crisis, when a large number of people located in vulnerable areas along the coast were migrant workers from the interior.
In many climatically fragile areas, people respond to shifting climatic
patterns by taking part in seasonal migration. Some massive population movements (e.g., the Hajj) also take place at times of major holidays. Such dynamics can not only affect estimates of exposure, but also influence the emergence of a hazard (e.g., infectious disease). For some hazards it may be helpful to estimate population distributions on an even finer time-scale (e.g., hourly); in some large urban areas the number of people present varies by orders of magnitude over the course of a day.
There are a handful of databases that have been used to generate estimates of these phenomena. Of these the Gridded Population of the World (GPW), produced by Columbia University, and LandScan, produced by Oak Ridge National Laboratory, are the most widely used. Regional collections are also available. (For a recent review see Tatem et al., 2012.) GPW integrates national census data using the highest spatial resolution available; LandScan estimates ambient population using census data along with spatial correlates of population location.
Such information is useful across the entire life cycle of hazard assessment, preparedness, and response. Well before an event of concern, such information is relevant for risk assessment and planning for reducing susceptibility among exposed populations. As an expected event approaches, the information is relevant for preparedness and crisis response planning (evacuation, resource mobilization, etc.). And in post-crisis periods, it is relevant for damage assessment and reconstruction planning; at this stage, census-derived data are no longer relevant, and estimates must be made afresh using ground surveys and satellite imagery.
The main weaknesses of the available data are the temporal lags (decennial censuses are inadequate for many purposes) and the lack of spatial resolution.
Location and Characteristics of Critical Infrastructure
Some risks are more a function of the exposure of critical infrastructure than of the exposure of populations. In such cases, it is important to monitor the locations and key characteristics of such infrastructure as power plants, roads, railroads, ports, telecommunications centers, hospitals, prisons, government buildings, and key manufacturing facilities. It is important that, in addition to monitoring, there should be an ongoing assessment of the adequacy of this infrastructure and of whether plans are in place for backup procedures if the adequacy standards are not yet met.
Publicly available global databases on such infrastructure are not considered adequate. Data on roads, for example, are available but are outdated and of very low accuracy, while other infrastructure information is not available except in commercial proprietary databases (mainly from the insurance industry and large engineering firms) and from classified military
databases. There is an effort under way to compile a global exposure database for use in earthquake modeling1 that will represent the most comprehensive public database of this type when complete. However, because it is oriented toward modeling economic loss rather than modeling security threats, it cannot be expected to meet all needs for security assessments.
Information on infrastructure exposures would be useful at all stages of the life cycle of potentially disruptive events: early on for risk assessment and planning, and later on for damage assessment and response prioritization.
Land Use and Land Cover
Patterns of land use affect vulnerability to hazards and also constitute an integral aspect of exposure. Whether a given area is devoted to commercial agriculture, subsistence agriculture, grazing, dense urban settlement, or wilderness will make a difference on how a given hazard affects security dynamics. For example, a prolonged drought in an area with significant subsistence agriculture and grazing will likely result in population movements, whereas such a response would be less likely in an area with other land uses.
There are standard classification schemes for characterizing land use and land cover, and these form the basis for generating indicators. Indicators that characterize different types of agricultural activity and different levels of urbanization would be particularly useful.
A number of global databases measure land use and land cover, with satellite imagery providing the most important input, along with significant validation from ground-based observations. There are a number of sources of global data on land cover change, including NASA’s Land-Cover/Land-Use Change Program,2 the Global Land Cover Facility at the University of Maryland,3 and the U.S. Geological Survey.4 Other sources provide land use data for specific counties or regions. For example, the Department of Global Ecology of the Carnegie Institution for Science, based at Stanford University, compiles high-resolution data on forest cover and related variables for tropical regions.5
These databases are considered accurate enough for use in global modeling and other broad exercises, but their accuracy and precision within specific regions is low. Their precision is low enough, for example, that they
__________________________
1 GED4GEM. See http://bit.ly/KCzpyj (accessed November 15, 2012).
2 See http://lcluc.umd.edu/data_information.php (accessed November 15, 2012).
3 See http://esip.umiacs.umd.edu/index.shtml (accessed November 15, 2012).
4 See http://landcover.usgs.gov/index.php (accessed November 15, 2012).
5 See http://claslite.ciw.edu; http://cao.stanford.edu (accessed November 15, 2012).
tend not to discriminate between subsistence and commercial agriculture or between different levels of urbanization. They also tend to have difficulty in characterizing pasture, a critical land use category for understanding climate impacts. Moreover, the databases tend to disagree widely in delineating urban extents.
Data on land use and land cover are most useful when used for risk assessment and planning in the early stages of the life cycle of potentially disruptive events.
SUSCEPTIBILITY TO HARM
Susceptibility is the likelihood of immediate harm to a population, community, society, or system as the result of exposure to a climate event. Thus, susceptibility is an indicator of the extent that an event would create disruptive change in the short term in that population, community, society, or system. For security analysis, it is important to identify factors that influence the general susceptibility of populations to all types of climatic shocks and stresses as well as the susceptibility to specific types of climate-induced events, such as a flood or a pandemic. This section discusses monitoring needs for measures of general susceptibility before turning to a few key areas of specific susceptibility: food, water, and health.
Monitoring of General Susceptibility
A number of factors influence general susceptibility, including various economic, demographic, social, and environmental conditions in a region; the form and quality of the infrastructure and the built environment (Intergovernmental Panel on Climate Change, 2007, 2012); and the presence or a recent history of violent conflict (Barnett, 2006; Barnett and Adger, 2007; Brklacich et al., 2010). In most cases it is not only the values of the variables that are relevant but also the direction and rate of change in those variables. For example, while the level of poverty in a region is an indicator of general human well-being and therefore of susceptibility to harm, there is additional value in knowing whether the level of poverty is increasing. If it is—even if poverty in the population does not seem particularly high to start with—this would suggest that well-being is deteriorating and that the potential for harm from climatic shocks may be increasing because financial and other assets that previously would have allowed households to cope with exposure to climate shocks are being depleted and because the construction of protective infrastructure is lagging far behind and further exposing populations to risk (Parry et al., 2009).
In addition to determining which types of susceptibility factors should be monitored, it is also critically important to consider the appropriate scale
or level of analysis for assessing and monitoring the susceptibility of specific populations. A susceptibility assessment may apply to an entire population or to a defined subset of a population (such as a particular ethnic group) within a politically bounded region, such as a city, state, or country, or within various types of functional regions, such as urban neighborhoods, border zones, agricultural areas, hydrologic basins, and so forth. As a general rule, susceptibility monitoring should emphasize locations that are currently or potentially of security concern, but it should also pay attention to regions where major humanitarian or other types of crises may arise or where large migration inflows or outflows may be likely.
It is also important to recognize that many of the factors that influence susceptibility to future climatic shocks and stress are already in flux as the result of ongoing environmental and climatic changes (Paavola, 2008) and of non-climatic processes, including globalization and urbanization (O’Brien and Leichenko, 2007; Leichenko and O’Brien, 2008). For example, rapid rates of deforestation on the hill slopes surrounding a city, which are often associated with population immigration, will exacerbate the susceptibility of a region to extreme precipitation events. Areas where susceptibility indictors are rapidly changing—especially when these changes suggest that susceptibility is increasing—also merit special attention because these are regions where social and political turmoil may be more likely, particularly if the regions have a recent history of violent conflict.
Measurements of economic conditions provide an indication of the financial and material well-being within a population or region and of the capacity to withstand climate-related shocks and stresses. Regions or population subgroups with low or deteriorating levels of per capita income and financial assets, high levels of poverty, high levels of unemployment, or high levels of income inequality can be expected to be more susceptible to harm from climatic risks and hazards. Economic diversity also has an important influence on susceptibility. Regions or populations that depend on a single agricultural commodity for their livelihoods and where alternative livelihood options are limited also tend to be more susceptible to harm from all types of climatic shocks and stresses, particularly those affecting their main source of livelihood. Potential indicators of economic well-being and economic diversity include per capita income, poverty rates, levels of inequality, unemployment rates (overall and by age cohort), percentage of the labor force in agriculture, and share of agricultural production by crop.
Many of these basic economic variables are regularly catalogued by international organizations such as the World Bank, which maintains databases on variables at the level of the nation-state for most countries.6 National-level information on agricultural production and crop yields is
__________________________
6 See http://databank.worldbank.org/data/home.aspx (accessed November 15, 2012).
available from the International Food Policy Research Institute7; other data sources are discussed later. Many national governments also collect economic data at both the national and subnational levels, but for less-developed countries the availability and reliability of these data are limited, and many countries do not release their routinely collected economic data. Subnational data are also available in datasets of the Center for International Earth Science Information Network at Columbia University; these datasets contain subnational estimates of indicators of economic well-being, including poverty, inequality, unmet basic needs, and food security, for a large number of countries.8 One important limitation of using existing data from many publicly available secondary sources is that the underlying source data, such as national population censuses, are updated relatively infrequently. These datasets provide reasonable estimates of baseline conditions, but they would need to be supplemented with primary data collected for specific regions of interest in order to gauge current conditions or to assess changes over shorter periods of time.
Demographic and social conditions are another group of factors that influence susceptibility to harm from climatic shocks and stresses. Regions with high rates of population growth, particularly from immigration, can be expected to be more susceptible to many climate risks because, as discussed in Chapter 5, new immigrants to a region are often poorer than long-time residents, are likely to lack knowledge of local environmental conditions, and tend to live in hazard-prone areas such as flood plains. Highly urbanized areas concentrate people and may therefore increase the disruption that would result from events experienced there; on the other hand, it may be easier in highly urbanized areas for response efforts to reach affected people. Regions with high shares of elderly residents or of young children also tend to be more susceptible to multiple hazards because these groups rely on others for their safety and well-being. Regions with low levels of education and literacy—both of which are indicators of human capital—would also be expected to be more susceptible to harm from a variety of climate events (Cavallo and Noy, 2010). In regions with high levels of gender inequality, females could be expected to be more susceptible to harm from climate events than males because of a relative lack of assets and a lack of access to resources that may be available to men. The health status of populations also influences susceptibility to harm from such hazards as food insecurity, poor water quality, and exposure to infectious disease agents.
Potential demographic and social variables to monitor include population growth rate, rate of immigration, share of the population that is over
__________________________
7 See http://www.ifpri.org/dataset/agro-maps-mapping-agricultural-production-systems (accessed November 15, 2012).
8 See http://sedac.ciesin.columbia.edu/theme/poverty (accessed November 15, 2012).
age 65, share of the population that is under age 12, education levels, literacy rates, and female literacy rates. As with the economic variables listed above, many of these demographic indicators are regularly cataloged at the national level by international organizations and at the subnational level by national governments. As discussed in the section on exposure, detailed population estimates at the subnational level are also available via satellite-based datasets. However, subnational coverage for indicators of dependency, literacy, and gender inequality are limited for developing countries and may require new data collection efforts, such as household surveys, in regions of security concern.
Another factor that influences susceptibility to extreme climate events is the built environment and physical infrastructure, particularly for urban populations in developing countries. Many of the variables that are relevant to exposure, such as the quality of housing and building stock and the presence and pattern of informal housing settlements, also influence the amount and type of physical damage done and the loss of life that occurs following exposure to climatic events. The characteristics of a city or urban region’s physical infrastructure, particularly the maintenance of piped water supplies, transportation networks, and electricity grids, all influence the susceptibility of the region’s population to harm from extreme climate events affecting that infrastructure. Poorly maintained water supply systems are more likely to be contaminated during flood events; improperly maintained bridges are more likely to collapse or experience significant damage when exposed to extreme weather; and inadequate or poorly maintained electrical and communication grids may be down for longer-than-normal periods following exposure to extreme events. The most important variables to monitor and the best data sources for characterizing the built environment and physical infrastructure were discussed in the section on exposure.
A region’s natural capital, including its natural physical assets and ecosystem services, influences the quality of life and livelihood options in a region. As discussed below in relation to food security and water security, regions with degraded or deteriorating environmental conditions tend to be more susceptible to harm or disruption from various climatic events. In addition to the environmental factors associated with water and food security, such as soil degradation and the quality and reliability of freshwater supply, other indicators of the conditions of natural assets include the rate of deforestation in a region and the rate of wetland or mangrove loss. Sources of data for the latter were discussed above.
For all types of extreme climate events the capacity of a region’s governing institutions and the presence of social capital influence the likelihood that a population will be harmed. Some potential areas to monitor include the density of social networks, the level of public spending per capita, the transparency of governing institutions, and the degree of corruption in
governing institutions. Data sources and limitations are discussed in the section on coping.
The presence or recent history of conflict is another important indicator of susceptibility to harm from climatic shocks and stress. Conflict damages infrastructure and life-supporting systems and undermines the capacity of institutions to prepare for and respond to climatic hazard events (Barnett, 2006; Barnett and Adger, 2007; Brklacich et al., 2010). Populations living in regions where conflict is present are highly susceptible to harm from climate risks and hazards. Possible variables to monitor and data sources are described in the section below on the stability and fragility of social and political systems.
Monitoring Water Security
The section on exposure earlier in this chapter addressed the monitoring of some of the climate-related variables that affect water supply along with other aspects of physical geography. Measurements of these variables will provide some of the baseline conditions needed for identifying and tracking changes. Generally speaking, climate change and climate events will produce conditions of both too little water (droughts) and too much (floods), and these will interact with the physical baseline conditions. Assessing susceptibility requires the additional consideration of the many ways in which human activity will affect the baseline. Many of those factors, such as increasing population and urbanization and changing patterns of agriculture and food consumption, would be part of monitoring general patterns of susceptibility and are relevant to water security if the measurements match the locations where water security is an issue. As discussed in several chapters, this combination of physical and socioeconomic trends means that, over the next decade and beyond, many regions are likely to face significant water challenges, including shortages, insufficient quality, and competition over water for different purposes. In discussions about monitoring water security it may be helpful to make a distinction between use-related variables (both demand and use) and water-management–related variables.
Use-related variables. Water use can be measured in a number of ways, and care must be taken in comparing different metrics. The quantity of water withdrawn or consumed from surface water and groundwater for human purposes is the most frequently used measurement of water use. Some withdrawn water may be returned to the surface or to groundwater after use; water consumption refers to the water that, for one reason or another, is not returned to the system. Other considerations of water use are its availability when needed and its quality with respect to different purposes.
A measure that captures both water supply and demand and that under-
pins several concepts is water supply per capita per year, which divides the total average renewable water supply in an area by its population. Water stress is defined as the situation when a country or region reaches a point at which annual water supply is less than 1,700 cubic meters per person per year (Office of the Director of National Intelligence, 2012; for reference, in the United States the total amount of water used per capita is 2,500 cubic meters per year). Water scarcity occurs when a country’s or region’s annual water supply is less than 1,000 cubic meters per person per year.
It is not yet possible to obtain comprehensive and consistent data on water availability and use for most parts of the world (Gleick, 2011). The UN Food and Agriculture Organization maintains the Aquastat database, which assembles information about “water resources, water uses, and agricultural water management from a variety of sources, with an emphasis on Africa, Asia, Latin America, and the Caribbean.”9
The degree of access to safe drinking water and sanitation provides one basic measure of water development and conditions as well as of societal capacity. Because one of the UN’s Millennium Development Goals is major improvements in access to drinking water and sanitation, there are regular reports about progress toward that goal (United Nations, 2012). There are also a number of sources of data on access to safe drinking water and sanitation, such as the Demographic and Health Surveys, a project of the U.S. Agency for International Development (USAID).10
The 2010 NRC report Monitoring Climate Change Impacts proposed six hydrology variables to assess climate-change impacts on water supply as well as measurement approaches and rationales for their links to environmental sustainability. The six variables are the volume (or mass) of water stored in parts of the terrestrial system; seasonal snow cover and snow water equivalent, and their seasonal progression; fluxes of water through the land–water system; water quality; lake, river, and reservoir ice cover; and the contribution to sea level rise from land water storage (National Research Council, 2010b). Complementing these variables with others that capture how water supply and demand are managed would provide the capacity to monitor water security.
Management-related variables. By “management-related variables” we mean both those variables that reflect the management of “internal” water supplies—that is, those that fall within the jurisdiction and control of national governments—and also variables related to transboundary water management issues. Both internal and transboundary supplies, and the populations that rely on them, are susceptible to harm from climate change and events. The monitoring of national and transnational water manage-
__________________________
9 See http://www.fao.org/nr/water/aquastat/main/index.stm (accessed November 15, 2012).
10 See http://www.measuredhs.com/Who-We-Are/About-Us.cfm (accessed November 15, 2012).
ment will rely in part on qualitative analysis and expert judgment, and it could complement the more general monitoring of government capacity and patterns of conflict and cooperation.
In monitoring internal water management, one would want to have information about the components of the water management system as well as about its capacity. The former category would include how decisions about pricing and allocation are made, the current conditions of the water infrastructure (e.g., dams, levies, canals, and water treatment facilities) and of projected developments, and how the water infrastructure is used to manage water flow. The capacity of the system could be gauged by such factors as current and projected investments in technology or management improvements, especially those intended to address scarcity, and assessments of the quality and legitimacy of pricing and allocation. It could be also useful to know how politicized water issues are in a region, which could be assessed by monitoring popular media using either events data techniques or the newer technologies to capture social media.
The components of an assessment of transboundary water management would include the number and type of agreements about the use of water as well as some of their specific components, such as allocation mechanisms and procedures for dispute resolution. In assessing capacity, it could be helpful to track patterns of cooperation or conflict over water to identify anomalies or emerging trends. As with the political dimensions of internal water management, it could be helpful to understand how elites frame water issues and to determine the nature and level of politicization.
There are several sources of information that can be used in the monitoring of some of the management issues. One of the best known is the Water Conflict Chronology of the Pacific Institute, with data on cases from 3000 BCE to 2010.11 Another is the International Water Events Database, maintained by the Institute for Water and Watersheds at Oregon State University, which captures various events reported in the media between 1950 and 2008 and codes them along a conflict–cooperation scale from –7 to +7.12 Both databases capture internal as well as interstate events. As discussed in Chapter 6, the investments being made in improving the capacity to monitor media sources, such as including more types of sources in more languages, could aid in identifying emerging patterns of conflict and cooperation earlier and in more specific areas.
__________________________
11 Current, sometimes overlapping categories of types of conflicts now include measures that may be relevant to questions of future changes, such as increases in terrorist activity (Water Conflict Chronology: http://www.worldwater.org/conflict.html [accessed June 23, 2012]).
12 For more information, see http://www.transboundarywaters.orst.edu/database/interwatereventdata.html (accessed November 15, 2012).
BOX E-1
Environmental Indications and Warnings
Freshwater is an essential resource for civilization that is tightly coupled to climate and weather. We live in a world today that is significantly more water stressed than at the beginning of the century, and we can expect it to get worse. Demand for freshwater has increased approximately eight-fold in the past century because of population growth and economic development. At the same time, climate changes are affecting the annual renewable supply and distribution of freshwater by altering temperature and precipitation regimes.
These changes have been recognized as a security concern by the U.S. National Intelligence Council, which concluded that “during the next 10 years, water problems will contribute to instability in states important to US national security interests” (Office of the Director of National Intelligence, 2012:iii). In order to stay abreast of potential threats to U.S. national security posed by emerging freshwater security issues, an early warning capability called Environmental Indications and Warnings (EIW) has been developed to monitor a wide range of climate and water security indicators in order to identify troublesome patterns and vulnerable regions.
Each month EIW issues global reports to analysts that provide localized information about current and historical anomalous conditions, with projections nine months into the future, by using the National Oceanic and Atmospheric Administration seasonal climate forecasts to forewarn of possible events:
- Synoptic global “hot spot” maps that provide the ability to spot emerging issues at subnational scales that deserve a more detailed analysis (see Figure E-1, right);
- Water security case studies that provide regional historical context with which to assess how current freshwater conditions compare with past events and to determine which pose a societal threat;
- Detailed sectoral assessments of how freshwater stress is affecting pastoral and agricultural lands, electrical power generation, and urban water systems; and
Box E-1 describes a major U.S. government–funded project to monitor a wide range of climate and water security indicators in order to identify troublesome patterns and vulnerable regions.
Monitoring Food Security
In the domain of food security, the important conditions to monitor include growing conditions for the food crops that are important to a region (whether grown locally or imported), production levels for these crops,
- Statistical analysis to assess trends in the prevalence of extreme events and also the relationships between freshwater stress and specific national security–relevant outcomes.
EIW systematically monitors acute and persistent freshwater anomalies, integrates measures of environmental stress with political and socioeconomic factors, calculates a suite of indicators that reflect place-based sensitivity to stress, and provides analysts with easy-to-interpret products. While EIW draws extensively on open scientific research, it processes this information in a manner that is driven by and uniquely suited to the needs of national security analysts.
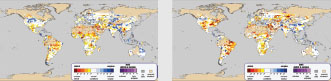
FIGURE E-1 Hot spot maps: Composite freshwater surpluses and deficits. These maps present composite pictures of freshwater surpluses and deficits for the three years from July 2009 through June 2012 (left) and the three months from April through June 2012 (right). The three-year period is useful for highlighting regions with persistent deficits and surpluses, and the three-month period is useful for highlighting short-term anomalies. The colors yellow through dark red represent increasingly severe deficits, while cyan through dark blue represent increasingly severe surpluses. Shades of purple are used to depict regions that exhibit aspects of both surplus and deficit at the same time. Note, for example, that the region along the border between the United States and Mexico is experiencing both short-term and persistent drought.
SOURCE: Material provided by the U.S. government.
grain storage levels, susceptibility to large price increases in food or energy prices, global prices of major food commodities, local food prices, the incidence of new strains of crop and livestock diseases, and the nutritional status of populations. With regard to the impact of extreme events, one would want to monitor both supply-disrupting natural disasters in net food exporter countries (e.g., the United States, the European Union, Canada, Russia, Australia, etc.), which cause rising food prices and thus increase the likelihood of social unrest abroad, and demand-disrupting natural disasters in net importer countries (e.g., the Middle East and North Africa
region), which tend to depress incomes, and thus the ability for people to feed themselves.
It would be useful to monitor several of these conditions to be able to identify potential problem areas months to a year in advance. For example, monitoring grain storage levels would help to foresee times when supply shocks could translate into large spikes in local and global food prices. Specific indicators would include the ratio of global stocks to global annual consumption and the stock/consumption ratios in countries that have limited capacity to import food. Historically, data have been compiled and reported by the U.S. Department of Agriculture,13 but many analysts question the reliability of these estimates for many countries. Some countries, such as China, have historically had limited interactions with global food commodity markets, so levels of their stocks have been less important for global prices (Dawe, 2009; Wright, 2011); however, that situation has likely changed, at least in the case of China, which is now a major importer of corn and soybeans.
Monitoring of susceptibility to large price increases in food or energy would help to foresee which areas are most likely to experience rapid increases in commodity prices. Important indicators would be the fraction of food consumption derived from imports, the levels of subsidies provided by the government, and the level of governmental financial resources available to sustain those subsidies in the face of rapid price increases. As discussed in Chapter 4, countries in the Middle East and North Africa are particularly dependent on food imports. Many other countries, such as in Western Africa, are dependent both on food and energy imports, and so increases in the price of one could compromise the ability of governments to provide the other. Current efforts to monitor reliance on imports and levels of subsidies and government resources include the World Bank’s Development Indica-tors14 and the UN’s Food and Agriculture Statistical Databases.15
A number of other indicators are particularly useful to monitor in order to identify potential problem areas weeks to months in advance. For example, the monitoring of food prices is important for identifying and predicting near-term threats to food security, both in urban areas and also in rural areas where most of the poor are net food buyers. Global commodity prices are a specific class of relevant indicators that provide an easily accessible measure of global food availability. The UN Food and Agriculture Organization (FAO) regularly monitors food prices and produces an
__________________________
13 See http://www.usda.gov/oce/commodity/wasde (accessed November 15, 2012).
14 See http://data.worldbank.org/indicator/TM (accessed November 15, 2012).
15 See http://faostat.fao.org (accessed November 15, 2012).
aggregate food price index16; some researchers have proposed that a food price index above 210 is a strong predictor of unrest throughout the world (Lagi et al., 2011). The International Monetary Fund monitors global prices of all major commodities, including major food grains.17
It would also be important to monitor specifically how countries react during episodes of high food prices. Many countries react by imposing export bans on commodities, exacerbating the situation and risking global system shocks. It is more difficult to monitor local food prices than to monitor global prices, but in many areas it would provide a much more reliable indicator of the cost-of-living challenges faced by local populations. The Famine Early Warning Systems Network (FEWS NET; see Box E-2) currently monitors local food prices and other factors relevant to food security throughout many countries in Africa and a number elsewhere (Brown et al., 2012), but its coverage does not extend to a number of areas of interest for U.S. national security.
A related indicator is expectations of future price changes. Interestingly, there is evidence that increased food price volatility actually decreases the likelihood of unrest, presumably because consumers then tend to view high food prices as temporary. It would therefore make sense to monitor the level of food volatility in recent months as well as the tone of media coverage or social network messages about the state of food availability and food prices.
The monitoring of crop and livestock diseases, particularly new diseases to which current crop varieties and livestock breeds are very susceptible, would help identify the potential for rapid and large losses in local—and possibly global—food supplies. A specific indicator could be the reported incidence of known threats by local crop and livestock experts. Some monitoring capabilities do now exist or are in the process of being established. For instance, the emergence of a new wheat stem rust in Uganda in 1999 posed a considerable threat to global wheat supply (Singh et al., 2008), and it spurred a new initiative to monitor global wheat rusts.18 For livestock, monitoring systems exist in a number of developed countries, but surveillance in many countries is currently limited. Ongoing efforts to improve livestock disease surveillance include those led by USAID19 and by the Global Early Warning System, a “joint system that builds on the added value of combining and coordinating the alert and disease intelligence mechanisms of OIE [Organization for Animal Health], FAO, and WHO
__________________________
16 See http://www.fao.org/worldfoodsituation/wfs-home/foodpricesindex/en (accessed November 15, 2012).
17 See http://www.imf.org/external/np/res/commod/index.aspx (accessed November 15, 2012).
18 See http://wheatrust.org (accessed November 15, 2012).
19 See http://www.vetmed.ucdavis.edu/ohi/predict/index.cfm (accessed November 15, 2012).
BOX E-2
Famine Early Warning Systems Network
Created in 1985, the goal of the Famine Early Warning Systems Network (FEWS NET) is to “to lower the incidence of drought- or flood-induced famine by providing to decision makers, timely and accurate information regarding potential food-insecure conditions. With early warning, appropriate decisions regarding interventions can be made.”a Funded by the U.S. Agency for International Development, the project is a collaboration among national, regional, and international partners, including expert field personnel on the ground.b “FEWS NET professionals in Africa, Central America, Haiti, Afghanistan, and the United States monitor and analyze relevant data and information in terms of its impacts on livelihoods and markets to identify potential threats to food security.”c A range of products provide alerts, monthly status reports, outlooks, and in-depth studies that make up FEWS NET’s on-the-ground coverage of 23 countries, mostly in Africa, but also including Haiti, Afghanistan, and countries in Central America. Less extensive coverage is provided for 15 more countries through partner-based monitoring. In all of its locations, FEWS NET has a strong focus on capacity-building and collaboration with local stakeholders in the countries of coverage.
To provide continuous assessments of overall food and water security as well as famine risk, FEWS NET monitors a number of different kinds of data within an overall framework of analysis that divides countries into relatively homogenous livelihood zones representing key features of how people assure their food security (through agricultural production, pastoralism, trade, etc.). FEWS NET relies on a combination of physical and socioeconomic indicators to estimate and predict the degree of, and changes in, the food security conditions of vulnerable countries.
[World Health Organization] for the international community and stakeholders to assist in prediction, prevention, and control of animal disease threats, including zoonoses, through sharing of information, epidemiologi-cal analysis and joint risk assessment.”20
Finally, the nutritional status of populations potentially affected by large decreases in food production or increases in food price is an important indicator of the way such events would affect food security.
Monitoring Health Security
Current and projected climate variability and climate change raise concerns about the population health burdens of a variety of climate-sensitive health outcomes. Those of potential interest to national security include malnutrition, which was mentioned above in discussing food security, and
__________________________
20 GLEWS: see http://www.glews.net (accessed July 24, 2012).
FEWS NET was one of the earliest users of satellite imagery to monitor rainfall and crop conditions in the developing world, and it now also looks at longer-term global climate variabilityd to help understand future threats to food security and to inform priorities for climate adaptation activities. FEWS NET’s groundbreaking use of food prices and “commodity market networks, market integration, the geographic and economic distribution of food commodities, cross border trade” (Famine Early Warning Systems Network, 2008:1) has led to new ways of seeing the nature of socioeconomic threats to food security in some countries—significantly different patterns of food pricing within countries; strikingly divergent global food price influences in different regions; and local prices that track closely with global prices in some places, but in others they do not. The goal of all this work is to provide humanitarian and developmental decision makers with credible, comparable, and spatially detailed information about current food security, the need for external food assistance, the nature of underlying vulnerabilities, and threats to food and water security along with the opportunities that exist to alleviate these conditions.
__________
aU.S. Geological Survey. See http://earlywarning.usgs.gov/fews/dp_overview.php (accessed July 9, 2012).
bFEWS NET is implemented by a team consisting of private firms (Chemonics International, Inc. and Kimetrica, Inc.) and several U.S. government agency partners: the U.S. Geological Survey, the National Aeronautics and Space Administration, the National Oceano-graphic and Atmospheric Administration, and the U.S. Department of Agriculture. See http://www.fews.net/ml/en/info/Pages/default.aspx?l=en (accessed July 9, 2012).
cFEWS NET. See http://www.fews.net/ml/en/info/Pages/default.aspx?l=en (accessed July 9, 2012).
dSee http://chg.geog.ucsb.edu/products/Trend_Analysis/index.html (accessed November 15, 2012).
pandemics such as influenza or yellow fever. Other health outcomes, such as morbidity and mortality due to changes in the frequency, intensity, duration, and spatial extent of extreme events or to changing air and water quality, while potentially significant at local and regional scales, would be unlikely to lead to national security concerns. There may always be exceptions, however. For example, the 2008 cholera epidemic in Zimbabwe affected approximately 92,000 people, with more than 4,000 deaths (Intergovernmental Panel on Climate Change, 2012). The outbreak lasted from August 2008 until June 2009 and ultimately seeded epidemics in other countries. Weather was a crucial factor in the outbreak, with recurring point-source contaminations of drinking water sources amplified by the onset of the rainy reason. The outbreak was primarily centered in urban areas and had a relatively high case fatality rate of 4 to 5 percent (while less than 1 percent is typical). Shortages of medicines, equipment, and staff contributed to the magnitude of the epidemic.
Monitoring is recommended for emerging infectious diseases because
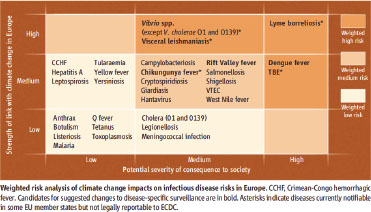
FIGURE E-2 Weighted risk analysis of climate change impacts on infectious disease risks in Europe.
SOURCE: From Lindgren et al. (2012). Reprinted with permission from the American Association for the Advancement of Science.
there is a long history of such diseases surprising societies and causing high morbidity and mortality, sometimes accompanied by social disruption (Lindgren et al., 2012). It is not necessary that there be a large number of cases to cause social disruption—as demonstrated, for example, by outbreaks of Ebola. An analysis of climate change-related impacts on emerging infectious diseases of possible concern for Europe is summarized in Figure E-2.
The figure highlights the fact that even well-developed public health infrastructures, such as those in Europe, need modifications to their surveillance and monitoring systems in order to protect their populations from a changing climate. The situation in developing countries is much more challenging. In response to a Presidential Directive in 1996, the U.S. Department of Defense established the Global Emerging Infections Surveillance and Response System, with the mission of monitoring newly emerging and re-emerging infectious diseases among U.S. service members and dependent populations (Clinton, 1996). The U.S. Armed Forces Health Surveillance Center, Division of Global Emerging Infections Surveillance and Response System Operations (AFHSC-GEIS) coordinates a multidisciplinary program to support the International Health Regulations. The goal of the program is to link datasets and information into a predictive surveillance program that generates advisories and alerts on emerging infectious disease outbreaks
(Witt et al., 2011). Datasets and information are derived from eco-climatic remote sensing activities; ecologic niche modeling; and arthropod vector, animal–disease host/reservoir, and human disease surveillance for febrile illnesses. The program includes 39 funded partners working in 92 countries (Russell et al., 2011).
From October 1, 2008, to September 30, 2009, the program identified 76 outbreaks in 53 countries (Johns et al., 2011). The program is characterizing and validating eco-climate anomalies for predictive surveillance for a range of vector-borne and waterborne and zoonotic diseases, including Rift Valley fever, Crimea–Congo hemorrhagic fever, Ebola and other viral hemorrhagic fever outbreaks, malaria, leishmaniasis, and enteric diseases (Fukuda et al., 2011; Money et al., 2011; Witt et al., 2011). Influenza and other respiratory diseases are included in the surveillance activities (Burke et al., 2011). These activities could be enhanced to consider how climate variability and change could alter the risks of outbreaks in geographic regions of interest.
Other organizations monitoring emerging infectious diseases include the U.S. Centers for Disease Control and Prevention; the European Centre for Disease Control; the WHO Global Alert and Response (GAR) system, which includes the Global Outbreak Alert and Response Network; and the Program for Monitoring Emerging Diseases (ProMED) reporting network at the International Society for Infectious Diseases. Diseases covered by GAR include
- Avian influenza
- Influenza
- Crimean–Congo hemorrhagic fever
- Ebola hemorrhagic fever
- Meningococcal disease
- Pandemic influenza (H1N1)
- Rift Valley fever
- Severe Acute Respiratory Syndrome (SARS)
- Smallpox
- Yellow fever
Monitoring these networks can provide insights into changing infectious disease patterns, whether caused by climate change or other factors. In addition, it would be useful to monitor vaccine levels to know whether there will be an adequate supply if a large outbreak should occur. For example, there is an international stockpile of 2 million doses of the yellow fever vaccine,21 but this would be insufficient if there was a large outbreak.
__________________________
21 See http://www.who.int/csr/disease/yellowfev/global_partnership/en/ (accessed November 15, 2012).
From 1995 to 2009 dengue fever, a disease carried by the same mosquito that can carry yellow fever, infected 8.88 million people in Latin America and the Caribbean, with 2,870 deaths (Diaz-Quijano et al., 2012). Brazil alone had more than 1 million cases of dengue fever in 2010.22
Ideally, the vectors carrying diseases such as yellow fever should be monitored so as to enhance the opportunities for preparedness. However, there is limited consistent and long-term monitoring of most mosquitoes and other vectors, including the yellow fever vector, and, as far as we are aware, there has been no effort to look for range expansions that could develop as a result of climate change (Hayden, 2012).
Monitoring how vectors are distributed around their current range could provide valuable information on emerging risks. For example, Canada has active and passive surveillance of the geographic distribution of the vector that carries Lyme disease, which is now spreading because of warming temperatures and the introduction of ticks to new regions (Ogden et al., 2010). Ogden and colleagues recently developed predictive maps of the geographic spread of the tick Ixodes scapularis in order to identify emerging areas of Lyme disease risk (Koffi et al., 2012). Further understanding of the possible impacts of a changing climate and disease transmission dynamics and better long-term datasets could suggest other opportunities for identifying regions at risk of other emerging diseases (National Research Council, 2001). Monitoring Aedes mosquitoes, for example, would be helpful for anticipating the spread of yellow fever, dengue, and chikungunya. Monitoring health outcomes during and following extreme weather and climate events, such as flooding and cyclones, could be useful for detecting the beginnings of epidemics of diseases such as cholera.
COPING, RESPONSE, AND RECOVERY—AND THEIR POLITICAL CONSEQUENCES
Key Factors
Given that disruptive natural events are never equal or equitable in their societal impacts and that governments are expected to provide emergency assistance and then to organize, if not lead, disaster recovery, social and political stresses are to be expected in the aftermath of such an event. However, the short-, medium-, and long-term outcomes of those stresses vary greatly, and the different outcomes have significant monitoring implications. As discussed in Chapter 5, the available evidence on the relationships between potentially disruptive climate events and actual social and
__________________________
22 See http://new.paho.org/hq/dmdocuments/2011/dengue_cases_2010_May_20.pdf (accessed November 15, 2012).
political disruptions suggests that the following four factors are important: coping capacity; response capacity; surge capacity; and the likelihood of effective response. Governments of affected countries, as well as other response organizations, do not always use their response capacity fully and effectively. Some are more likely than others to have an effective response. This has implications both for response to particular events in the short term and for longer-term social and political stability.
Together these factors provide a foundation for understanding and assessing the likely short-term social and political effects of climate-related events. They also interact with other basic social and political conditions, including the levels and forms of political opposition, to affect the likelihood of recovery over the longer term.
General Approaches to Monitoring
One way to think about the monitoring needs for social and political stresses caused by climate-related events specifically is to imagine a nation-state affected by a major climate-related disaster situation in which social and political stresses would not become serious enough to undermine or topple the government, destabilize the regime, or threaten the stability of the state itself. A key to a government having this level of stability in the face of disaster is the extent to which there is both broad and deep legitimacy for the state, the regime, the government of the time, and the leadership group. A state with a high level of legitimacy would have, in the period before the event, no significant portion of the general population and no specific groups that reject with potential or actual violence (a) the existence or current territorial configuration of the country; (b) the form of governing the national territory, that is, the “regime”; (c) the right of the current government or administration to in fact govern that territory; or (d) the methods or processes by which the incumbent authorities occupy their positions. In the context of disruptive events, it is useful to think of legitimacy as providing a public reservoir of support (or at least acceptance) for a regime, a particular government, or a leadership group when a natural event becomes, through the combination of human system exposures and vulnerabilities, a major disaster. The Netherlands, which has obviously significant exposure to natural hazards and particularly to hazards associated with climate change, is an exemplar of a state and government unlikely to be destabilized by a disaster.
By contrast, a state with a political system with weak legitimacy—and therefore one that may be vulnerable in the case of a climate-driven natural disaster—would be one in which a significant portion of the general population or specific groups reject with potential or actual violence (a) the configuration of the national territory (e.g., in the case of secessionist, sepa-
ratist, or independence movements), (b) the right of the current government or administration to rule (as evidenced by insurrections, insurgencies, or, in the case of opposition to authoritarian regimes, popular or democratic movements), or (c) the methods or processes by which the incumbent authorities came to be holding office (as evidenced by, on an increasing scale of violence, anti-government protests, demonstrations, or riots). The situation most likely to lead to problems would be a combination of all three rejections by multiple groups that agree on short-term goals (even if they differ on long-term goals), including at a minimum the ouster of the current authority figures. Such conditions would be conducive to the collapse or fall of the government or administration and possibly even to a regime change in the aftermath of the disaster. As discussed in Chapter 4, the case of Myanmar after 2008’s Cyclone Nargis, where a type of slow democratization is currently occurring, is a possible example, depending upon the final outcome of the process.
Many countries at serious risk of disasters, including several of national security interest to the U.S. government, are in the substantial and complicated middle area between these two ideal types of high-legitimacy and low-legitimacy regimes. Turkey, for example, is closer to the first type—a country in which a major natural disaster (e.g., a great earthquake affecting Istanbul) would likely not pose a threat to the regime (although perhaps to the incumbent authorities and possibly the government of the time). Pakistan, with a major earthquake or flood, could be closer to the second type because, although the regime survived devastating floods in 2010, the aftermath of such an event could provide the occasion for an Islamist or military usurpation of power that would change not only the authorities but also the government and, quite likely, the entire regime.
Considering that in the 21st century the standard for legitimacy in most countries is some form or approximation of a democracy, it is worth considering and monitoring the characteristics of a democratic political system that might make it resistant to erosion or collapse in the wake of a major disaster. That set would include (1) sustained levels of high socioeconomic development without stark inequities; (2) regularized and accepted mechanisms and channels to organize and express grievances; (3) low levels of violence, particularly political violence; (4) a sustained record of low public corruption; (5) full civil liberties, a free media, and regular and fair elections with peaceful turnovers of post-election positions; and (6) effective governance capacities from the national to the local level, including for extreme event emergency response and recovery.23
__________________________
23 An example of a regime’s stability under disaster can be seen in the situation that arose in Germany in August 2002 when devastating floods affected large areas and many cities and towns in the eastern part of the country. Interestingly, before the floods Chancellor Gerhard
A nation-state whose characteristics were a mirror image of these would likely have its stability threatened by a major disaster. Such a state would have: (1) low to middle levels of socioeconomic development, with stark inequities; (2) restricted, ineffective, or nonexistent mechanisms and channels to organize and express grievances; (3) high levels of violence, either currently or in the recent past; (4) sustained high levels of public corruption; (5) restricted civil liberties and media, fraudulent or non-competitive elections, and problematic turnovers of governing authority; and (6) ineffective or very limited governance capacities from the national to the local level, including for extreme event emergency response and recovery.24
Specific Monitoring Needs
These considerations suggest some specific monitoring needs for assessing the short-, medium-, and long-term effects of a major disaster or a sequence of disasters on social and political stability. In addition to the four factors introduced at the beginning of the section, monitoring should also be aimed at the following baseline and social and political conditions:
1. The coping capacities of the principal groups affected directly and indirectly by the event or sequence of events and the differences in coping capacity among the principally affected groups. Some existing indicators of social capital may serve as indicators of coping capacity (Aldrich, 2012).
2. The general response capacity, which can be monitored in part by observing the response capacities of responsible formal organizations. Response capacity is partly a matter of budgets and supplies (e.g., emergency shelter materials, water purification equipment, and food stocks). It also encompasses logistical capacities, the availability and training of general response personnel, and access to specialized personnel (e.g., first responders or medical personnel). Because capacity is meaningful only in relation to the costs of providing assistance—some of which, such as food prices, can be volatile— the costs of price-volatile supplies and equipment should also be monitored.
__________________________
Schröder was behind in the polls for the September 2002 elections. His opposition to the oncoming U.S. invasion of Iraq combined with an effective disaster response and then a carefully financed recovery plan brought him back electorally, and he won reelection, albeit with a much reduced majority (from 21 to 9) in the Bundestag.
24 These pre-conditions characterized Haiti when it was struck by a major earthquake in 2010, except that the United Nations and the community of nongovernmental organizations were providing most of the services normally associated with a state—and all Haitians were well aware of it.
3. Expectations of response on the part of the general public, key socioeconomic and cultural groups, and disaster-affected populations. This includes expectations of government emergency response capabilities and effectiveness as well as perceptions of government capabilities and effectiveness versus those of other domestic actors (e.g., the military or religious organizations in many countries), nongovernmental organizations in general, or outside donors. Expectations provide an important baseline indicator in advance of extreme events and can be measured by survey methods, perhaps as part of the more general efforts to survey public attitudes toward government discussed below. We are unaware, however, of any efforts to do such measurement systematically across countries for disaster-related issues. Perceptions of response after a disruptive event can be assessed in the same way and compared with the expectations to provide an indicator of the perceived adequacy of the response. The key dimensions of response perception include the effectiveness, transparency, and honesty of the responding organizations.
4. Surge capacity, one indicator of which is the availability of designated standby personnel and the funds to support them in the event of an emergency.
5. The likelihood of effective response. A baseline assessment could be provided by examining the track records of government and other response organizations in providing support to the affected populations or areas both generally and after past disruptive events, the history of national governments in allowing outside resources to flow to affected areas, and the record of national and local governments in delivering normal services to affected or potentially affected areas.
6. The direct and indirect social and economic impacts of the disaster (numbers killed, injured, and made homeless as well as the numbers of those whose livelihoods have been destroyed or jeopardized). The monitoring of these impacts, which is done in the aftermath of an event, could be done by class, race, ethnicity, gender, geography, political orientation, and so on. These factors are most important to monitor at the geographic level of the event, rather than at the national level. We recognize that some of this information may be difficult to collect, particularly in countries where some of these issues are likely to be sensitive and governments are either reluctant to ask the questions or else to make the information public. In such cases, it may be necessary to rely on indirect measures.
7. The impacts of actual response and recovery, which can be monitored through a number of attitudinal variables. These variables range from attitudes about specific responses to a disaster to attitudes about more general political and social conditions and capaci-
ties. These are normally measured by public opinion surveys asking for approval ratings, but they can also be assessed by examining the treatment of the government in free mass media. The attitudinal variables that can be monitored to assess the impacts of response and recovery can include
• Expectations of government disaster recovery capabilities and effectiveness by the general public, by key socioeconomic groups, and in the disaster-affected population.
• Perceptions of the effectiveness of government efforts in disaster recovery compared with efforts of other actors, institutions, or donors, assessed in the general public, key socioeconomic groups, and disaster-affected populations.
• Mobilization of disaster-related grievances by location, degree, type of grievance, population subgroup, and apparent purposes or goals. This monitoring should be particularly sensitive to concentrations of grievances by region, class, race, ethnicity, religious orientation, or other pre-existing societal cleavage.
• Attitudes toward incumbent authorities (i.e., the leaders or leadership group) from local to national levels. This can be assessed by approval ratings collected from general public samples, key socio-economic groups, and disaster-affected populations, and should be sensitive to the above sets of pre-existing societal cleavage.
• Attitudes toward the government or administration, measured by approval ratings among the general public, key socioeconomic groups, and disaster-affected populations from local to national levels. This monitoring should also be sensitive to the above sets of pre-existing societal cleavage.
• Attitudes about the underlying legitimacy or “rightness” of the nation, the state, the current government, and the incumbent authorities, monitored in the general public, key socioeconomic groups, and disaster-affected populations, and sensitive to the above pre-existing societal cleavages. In surveys or focus groups, legitimacy can be assessed directly by asking whether the current form of government is appropriate for solving national problems. It can be assessed indirectly by examining such indicators as provision of basic health and security services.
8. Social or political instability over the longer term. Potential indicators include
• Pre-existing levels of internal violence and political instability in the country of interest.
• Pre-existing levels of violence in neighboring countries and changes in those levels after the event or sequence of events in the country of interest.
• Attitudes toward or approval of the nation, state, current government, and incumbent authorities within key institutions (e.g., the military, private-sector commercial and industrial organizations, and churches or religious organizations and movements). This is normally assessed with standard forms of political analysis, although there may also be a role for monitoring general or specialized media.
• Mobilization of opposition by parties, groups, or movements that may attempt to take advantage of the post-impact disaster period and the recovery period to advance their interests and agendas. This monitoring should be particularly sensitive to differences between largely non-violent “in-system” opposition parties, groups, or movements versus “out-system” and more violence-prone entities, especially if the latter are organized along the lines of major pre-existing societal cleavages. This is assessed by standard forms of political analysis.
• The repressive capacities of the state and the degree to which these are enhanced, remain static, or are degraded by the climate event or sequence of disasters.
Examples of Monitoring Resources for Coping, Response, and Recovery
Response capacity. The increasing international attention in recent years to reducing disaster risks rather than simply responding when disasters occur has led to a number of major communication and coordination initiatives that also offer sources of information about national, regional, and international capabilities. For example, the UN International Strategy for Disaster Reduction Secretariat (UNISDR), as part of its initiative to create national platforms for disaster risk reduction (81 countries at the time of this report) is developing a database of national response capacity.25 Another UNISDR initiative is the Integrated Research on Disaster Risk’s Forensic Investigations of Disasters,26 launched in partnership with the International Social Science Council and the International Council for Science. Its goals are (1) to provide a baseline of the current state of the science in integrated research on disaster risk in order to measure the effectiveness of multiple programs, (2) to identify and support a long-term
__________________________
25 See http://www.unisdr.org/partners/countries (accessed November 15, 2012).
26 See http://www.irdrinternational.org/about-irdr/scientific-committee/working-group/forensic-investigations/ (accessed November 15, 2012).
science agenda for the research community and funding agencies, and (3) to provide a scientific basis to support policy and practice. All of these various activities are yielding data on, or at least relevant to, national disaster response capabilities and offer relatively inexpensive monitoring possibilities for the U.S. intelligence community.
Perceptions and attitudes. In addition to traditional political analysis and research, both inside and outside the government, there are a number of resources for data on public perceptions and attitudes. In particular, public opinion survey projects such as Afrobarometer,27 the Americas Barometer survey from the Latin American Public Opinion Project,28 Asian Barometer,29 and Arab Barometer30 are accumulating evidence about attitudes toward democracy, government performance, and a range of social and political issues.
Regime types and governance. The longstanding Polity project, now part of the Political Instability Task Force effort, provides data that support quantitative and comparative analysis of regime authority characteristics and transitions. The types of governing authority range from fully institutionalized autocracies through mixed, or incoherent, authority regimes (termed “anocracies”) to fully institutionalized democracies. The “Polity Score” captures this regime authority spectrum on a 21-point scale ranging from –10 (hereditary monarchy) to +10 (consolidated democracy) (Polity 4 Project, 2012).
Assessing the quality of governance has become a major focus for development assistance in recent years. Hundreds of datasets have emerged from donor agencies, governments, nongovernmental organizations, think tanks, and academia. (For a review of some of the “uses and abuses” of governance indicators, see Arndt and Oman, 2006.) Often used for research purposes because of their independence and freedom from member government influences, the annual datasets from Transparency International and Human Rights Watch are readily accessible and include various indicators for governance. The Worldwide Governance Indicators Project, produced by a team of scholars at the Brookings Institution with funding from the World Bank, is an example of a widely cited set of indicators from the world of intergovernmental organizations. It reports aggregate and individual indicators for six dimensions of governance: voice and accountability, political stability and the absence of violence, government effectiveness, regulatory quality, rule of law, and control of corruption. As explained on the World Bank’s
__________________________
27 See http://www.afrobarometer.org (accessed November 15, 2012).
28 See http://www.vanderbilt.edu/lapop (accessed November 15, 2012).
29 See http://www.asianbarometer.org/newenglish/introduction/default.htm (accessed November 15, 2012).
30 See http://www.arabbarometer.org/about.html (accessed November 15, 2012).
website, “These aggregate indicators combine the views of a large number of enterprise, citizen, and expert survey respondents in industrial and developing countries. The individual data sources underlying the aggregate indicators are drawn from a diverse variety of survey institutes, think tanks, non-governmental organizations, and international organizations” (World Bank, 2012). The data cover 213 economies for the period 1996–2010. A number of donor agencies also support national assessments. For example, as part of its Democracy, Human Rights, and Governance Program, USAID occasionally funds surveys that capture public experience with and perceptions of corruption.
Political instability and violence. A number of these resources were already noted in Chapter 5 as part of the discussion on assessing the evidence base for connections between climate change and security risk. The resources include the Uppsala Conflict Data Program,31 the Political Instability Task Force (Box 5-1), and the Peace and Conflict Instability Ledger (Hewitt et al., 2012). A description of major datasets on international conflict and cooperation is maintained as an online appendix to the Compendium Project of the International Studies Association.32
Cross-cutting projects. In addition to the Political Instability Task Force, another U.S. government effort to examine a number of factors that affect coping, response, and recovery is the USAID Alert List. Since 2004 the USAID has produced an annual report that ranks countries according to (1) their current level of fragility and (2) a forecast of their risk for conflict or political instability and then combines the two rankings to produce an assessment of the most vulnerable countries. The seventh report was produced in 2011. The report is based on quantitative analysis of unclassified, open source information, and although the actual list of rankings is not made public, details about the methodology and some general findings are available. For example, in 2009, 23 of the 29 most vulnerable countries were in Africa (Moore, 2010:4)
The concept of “fragility” refers to the extent to which interactions between state and society produce outcomes that are (1) effective and (2) legitimate; the USAID measure assesses states on these two dimensions independently, and the two assessments for a state are often very different.33 Of the 33 political, security, economic, and social indicators used to assess fragility, 16 are related to effectiveness and 17 to legitimacy. The forecasts of instability use a model developed by the Center for International De-
__________________________
31 See http://www.pcr.uu.se/research/UCDP/ (accessed November 15, 2012).
32 See http://www.paulhensel.org/compendium.html (accessed June 23, 2102).
33 Principal components analysis was used to calculate weightings based on the relative influence each indicator exerts on empirical relationships in the data, and those weights are then used to compute country scores.
velopment and Conflict Management at the University of Maryland. Its forecasts rely on a limited number of explanatory variables. In 2010 the project included an assessment of vulnerability to climate change based on a statistical model that analyzes global weather data and projects them forward. This approach permits physical climate hazards and human vulnerability to conflict to be disaggregated from the effects of climate change (Hewitt, 2012).
SUMMARY
The multitude of possible sources of data and indicators that could be applied to understanding climate-security connections is potentially overwhelming. This appendix attempts to provide an overview of major data sources and monitoring projects across the phenomena of interest of this project as well as a sense of the degree of consensus across research communities about key variables and indicators. It serves to illustrate the complexity and challenges associated with one of the report’s findings: Monitoring systems will require the integration of quantitative indicators of both environmental and social phenomena with traditional security and intelligence analytic methods.
REFERENCES
Aldrich, D.P. 2012. The politics of natural disasters (pre-print). In Oxford bibliographies in political science. Available: http://works.bepress.com/cgi/viewcontent.cgi?article=1019&context=daniel_aldrich (accessed October, 4, 2012).
Arndt, C., and C. Oman. 2006. Uses and abuses of governance indicators. Paris, France: OECD, Centre for Development.
Barnett, J. 2006. Climate change, insecurity, and justice. Pp. 115–130 in Fairness in adaptation to climate change, W.N. Adger, J. Paavola, M.J. Mace, and S. Huq, Eds. Cambridge, MA: MIT Press.
Barnett, J., and W. N. Adger. 2007. Climate change, human security and violent conflict. Political Geography 26(6):639–655.
Brklacich, M., M. Chazan, and H.G. Bohle. 2010. Human security, vulnerability, and global environmental change. Pp. 35–52 in Global environmental change and human security, R. Matthew, J. Barnett, B. McDonald, and K. O’Brien, Eds. Cambridge, MA: MIT Press.
Brown, M.E., F. Tondel, T. Essam, J.A. Thorne, B.F. Mann, K. Leonard, B. Stabler, and G. Eilerts. 2012. Country and regional staple food price indices for improved identification of food insecurity. Global Environmental Change 22(3):784–794.
Burke, R.L., K.G. Vest, A.A. Eick, J.L. Sanchez, M.C. Johns, J.A. Pavlin, R.G. Jarman, J.L. Mothershead, M. Quintana, T. Palys, M.J. Cooper, J. Guan, D. Schnabel, J. Waitumbi, A. Wilma, C. Daniels, M.L. Brown, S. Tobias, M.R. Kasper, M. Williams, J.A. Tjaden, B. Oyofo, T. Styles, P.J. Blair, A. Hawksworth, J.M. Montgomery, H. Razuri, A. Laguna-Torres, R.J. Schoepp, D.A. Norwood, V.H. MacIntosh, T. Gibbons, G.C. Gray, D.L. Blazes, K.L. Russell, and AFHSC-GEIS Influenza Surveillance Writing Group. 2011. Department of Defense influenza and other respiratory disease surveillance during the 2009 pandemic. BMC Public Health 11(Suppl. 2):S6.
Cavallo, E., and I. Noy. 2010. The economics of natural disasters. IDB Working Paper Series No. IDB-WP-124. Washington, DC: Inter-American Development Bank.
Clinton, W.J. 1996. Presidential decision directive NSTC-7. Washington, DC: The White House.
Dawe, D. 2009. The unimportance of “low” world grain stocks for recent world price increases. ESA Working Paper No. 09-01. Food and Agriculture Organization. Available: ftp://ftp.fao.org/docrep/fao/011/aj989e/aj989e.pdf (accessed August 10, 2012).
Diaz-Quijano, F., and E.A. Waldman. 2012. Factors associated with dengue mortality in Latin America and the Caribbean, 1995–2009: An ecological study. American Journal of Tropical Medicine and Hygiene 86(2):328–334.
Famine Early Warning Systems Network. 2008. FEWS NET strategy and vision for markets and trade. Washington, DC: FEWS NET. (Updated January 2008). Available: http://www.fews.net/docs/special/FEWSNETMarketandTradeStrategy2005-2010.pdf (accessed December 17, 2012).
Fukuda, M.M., T.A. Klein, T. Kochel, T.M. Quandelacy, B.L. Smith, J. Villinski, D. Bethell, S. Tyner, Y. Se, C. Lon, D. Saunders, J. Johnson, E. Wagar, D. Walsh, M. Kasper, J.L. Sanchez, C.J. Witt, Q. Cheng, N. Waters, S.K. Shrestha, J.A. Pavlin, A.G. Lescano, P.C.F. Graf, J.H. Richardson, S. Durand, W.O. Rogers, D.L. Blazes, K.L. Russell, and AFHSC-GEIS Malaria and Vector Borne Infections Writing Group. 2011. Malaria and other vector-borne infection surveillance in the U.S. Department of Defense Armed Forces Health Surveillance Center-Global Emerging Infections Surveillance program: Review of 2009 accomplishments. BMC Public Health 11(Suppl. 2):S9.
Gleason, K.L., J.H. Lawrimore, D.H. Levison, T.R. Karl, and D.J. Karoly. 2008. A revised U.S. climate extremes index. Journal of Climate 21:2,124–2,137.
Gleick, P.H. (Ed.). 2011. The world’s water, Volume 7. Washington, DC: Island Press.
Global Climate Observing System. 2003. The second report on the adequacy of the global observing systems for climate in support of the UNFCCC. April 2003 (GCOS-82, WMO/TD No. 1143). Available: http://www.wmo.int/pages/prog/gcos/Publications/gcos-82_2AR.pdf (accessed October 15, 2012).
Global Climate Observing System. 2010. Implementation plan for the global observing system for climate in support of the UNFCCC (2010 update). Geneva, Switzerland: World Meteorological Organization. Available: http://www.wmo.int/pages/prog/gcos/Publications/gcos-138.pdf (accessed August 6, 2012).
Hayden, M. 2012. The dengue vector mosquito Aedes aegypti at the margins: Sensitivity of a coupled natural and human system to climate change. Briefing to the Committee on Assessing the Impacts of Climate Change on Social and Political Stresses, January 12, Washington, DC.
Hewitt, J.J. 2012. 2011 alert lists: Methodological overview. Briefing to the Committee on Assessing the Impacts of Climate Change on Social and Political Stresses, March 1, Washington, DC.
Hewitt, J.J., J. Wilkenfeld, and T.R. Gurr. 2012. Peace and conflict 2012. Boulder, CO: Paradigm.
Intergovernmental Panel on Climate Change. 2007. Climate change 2007: Impacts, adaptation, and vulnerability. Cambridge, UK: Cambridge University Press.
Intergovernmental Panel on Climate Change. 2012. Managing the risks of extreme events and disasters to advance climate change adaptation. Special report of working groups I and II of the Intergovernmental Panel on Climate Change. C.B. Field, V. Barros, T.F. Stocker, D. Qin, D.J. Dokken, K.L. Ebi, M.D. Mastrandrea, K.J. Mach, G.-K. Plattner, S.K. Allen, M. Tignor and P.M. Midgley, Eds. Cambridge, UK: Cambridge University Press.
Johns, M.C., R.L. Burke, K.G. Vest, M. Fukuda, J.A. Pavlin, S.K. Shrestha, D. Schnabel, S. Tobias, J.A. Tjaden, J.M. Montgomery, D.J. Faix, M.R. Duffy, M.J. Cooper, J.L. Sanchez, D.L. Blazes, and AFHSC-GEIS Outbreak Response Writing Group. 2011. A growing global network’s role in outbreak response: AFHSC-GEIS, 2008–2009. BMC Public Health 11(Suppl. 2):S3.
Koffi, J.K., P.A. Leighton, Y. Petcat, L. Trudel, L.R. Lindsay, F. Milford, and N.H. Ogden. 2012. Passive surveillance for I. scapularis ticks: Enhanced analysis for early detection of emerging Lyme disease risk. Journal of Medical Entomology 49:400–409.
Lagi, M., K.Z. Bertrand, and Y. Bar-Yam. 2011. The food crises and political instability in North Africa and the Middle East. Available: http://arxiv.org/pdf/1108.2455v1.pdf (accessed October 4, 2012).
Leichenko, R.M., and K.L. O’Brien. 2008. Environmental change and globalization: Double exposures. New York: Oxford University Press.
Lindgren, E., Y. Andersson, J.E. Suk, B. Sudre, and J.C. Semenza. 2012. Monitoring EU emerging infectious disease risk due to climate change. Science 336:418–419.
Money, N.N., R. Maves, P. Sebeny, M. Kasper, M.S. Riddle, and AFHSC-GEIS Enteric Surveillance Writing Group. 2011. Enteric disease surveillance under the AFHSC-GEIS: Current efforts, landscape analysis and vision forward. BMC Public Health 11(Suppl. 2):S7.
Moore, F. 2010. Climate change in Africa. Testimony before the Subcommittee on African Affairs and Global Health, Committee on Foreign Affairs, United States House of Representatives, April 15. Available: http://gopher.info.usaid.gov/press/speeches/2010/ty100415.html (accessed July 9, 2012).
National Research Council. 2001. Under the weather: Climate, ecosystems, and infectious diseases. Committee on Climate, Ecosystems, Infectious Diseases, and Human Health. Washington, DC: National Academy Press.
National Research Council. 2010a. Advancing the science of climate change. Panel on Advancing the Science of Climate Change. Washington, DC: The National Academies Press.
National Research Council. 2010b. Monitoring climate change impacts: Metrics at the intersection of the human and earth systems. Committee on Indicators for Understanding Global Climate Change. Washington, DC: The National Academies Press.
National Research Council. 2010c. Adapting to the impacts of climate change. Panel on Adapting to the Impacts of Climate Change. Washington, DC: The National Academies Press.
National Research Council. 2012. Earth science and applications from space: A midterm assessment of NASA’s implementation of the decadal survey. Committee on the Assessment of NASA’s Earth Science Program. Washington, DC: The National Academies Press.
O’Brien, K., and R. Leichenko. 2007. Human security, vulnerability, and sustainable adaptation. New York: United Nations Development Programme. Available: http://hdr.undp.org/en/reports/global/hdr2007-8/papers/O’Brien_Karen%20and%20Leichenko_Robin.pdf (accessed August 10, 2012).
Office of the Director of National Intelligence. 2012. Global water security: Intelligence community assessment. Washington, DC: Office of the Director of National Intelligence.
Ogden, N.H., C. Bouchard, K. Kurtenbach, G. Margos, L.R. Lindsay, L. Trudel, S. Nguon, and F. Milord. 2010. Active and passive surveillance and phylogenetic analysis of Borrelia burgdorferi elucidate the process of Lyme disease risk emergence in Canada. Environmental Health Perspectives 118:909–914.
Paavola, J. 2008. Livelihoods, vulnerability and adaptation to climate change in Morogoro, Tanzania. Environmental Science and Policy 11:642–654.
Palmer, W.C. 1965. Meteorological drought. Washington, DC: U.S. Department of Commerce.
Parry, M., N. Arnell, P. Berry, D. Dodman, S. Fankhauser, C. Hope, S. Kovats, R. Nicholls, D. Satterthwaite, R. Tiffin, and T. Wheeler. 2009. Assessing the costs of adaptation to climate change: A review of the UNFCC and other recent estimates. London, UK: International Institute for Environment and Development and Imperial College of London, Grantham Institute for Climate Change.
Polity 4 Project. 2012. Polity 4 Project: Political regime characteristics and transitions, 1800–2010. Available: http://www.systemicpeace.org/polity/polity4.htm (accessed July 28, 2012).
Russell, K.L., J. Rubenstein, R.L. Burke, K.G. Vest, M.C. Johns, J.L. Sanchez, W. Meyer, M. Fukuda, and D.L. Blazes. 2011. The Global Emerging Infection Surveillance and Response System (GEIS), a U.S. government tool for improved global biosurveillance: A review of 2009. BMC Public Health 11(Suppl. 2):S2.
Singh, R.P., D.P. Hodson, J. Huerta-Espino, Y. Jin, P. Njau, R. Wanyera, S.A. Herrera-Foessel, and R.W. Ward. 2008. Will stem rust destroy the world’s wheat crop? Advances in Agronomy 98:271–310.
Tatem, A.J., S. Adamo, N. Bharti, C. Burgert, M. de Castro, A. Dorelien, G. Fink, C. Linard, J. Mendelsohn, L. Montana, M. Montgomery, A. Nelson, A.M. Noor, D. Pindolia, G. Yetman, and D. Balk. 2012. Mapping populations at risk: Improving spatial demographic data for infectious disease modeling and metric derivation. Population Health Metrics 10(1):8.
Trenberth, K.E., R. Anthes, A. Belward, O. Brown, E. Haberman, T.R. Karl, S. Running, B. Ryan, M. Tanner, and B. Wielicki. 2012. Challenges of a sustained climate observing system. Paper presented for WCRP Open Science Conference 2011, Denver, CO, October 24–28. (Revised February 15, 2012). Available: http://www.cgd.ucar.edu/cas/Trenberth/trenberth.papers/Trenberth%20paper%20OSC%20October%202011_v13.pdf (accessed August 5, 2012).
United Nations. 2012. The Millenium Development Goals report. New York: United Nations.
Witt, C.J., A.L. Richards, P.M. Masuoka, D.H. Foley, A.L. Buczak, L.A. Musila, J.H. Richardson, M.G. Colacicco-Mayhugh, L.M. Rueda, T.A. Klein, A. Anyamba, J. Small, J.A. Pavlin, M. Fukuda, J. Gaydos, K.L. Russell, and AFHSC-GEIS Predictive Surveillance Writing Group. 2011. The AFHSC-Division of GEIS Operations Predictive Surveillance Program: A multidisciplinary approach for the early detection and response to disease outbreaks. BMC Public Health 11(Suppl. 2):S10.
World Bank. 2012. World governance indicators. Available: http://info.worldbank.org/governance/wgi/index.asp (accessed July 28, 2012).
Wright, B.D. 2011. The economics of grain price volatility. Applied Economic Perspectives and Policy 33(1):32–58.


