
Appendix B
Status of the Profession
This appendix describes the demographics of astronomy, including the support by the two major funding agencies, NSF and NASA, and lists major ground-based facilities in operation. These data provide a context for the recommendations made in the main text of the report. Related topics are discussed in Chapter 3 and in the reports of the panels on Policy Opportunities and on the Status of the Profession in the Working Papers (NRC, 1991).
THE DEMOGRAPHICS OF ASTRONOMY
The Growth of Astronomy
Statistics from the American Astronomical Society (1990) and the American Institute of Physics (AIP; Porter and Kellman, 1989) characterize the demographics of the profession and show that the astronomical community has grown steadily over the last decade. After correcting the current membership of the American Astronomical Society (AAS), over 5,100, for foreign members and other small factors, the Status of the Profession Panel (Working Papers) estimated that the United States has approximately 4,200 working astronomers. This value represents a 42 percent increase since 1980 (Figure B.1). Publication records analyzed by Abt (1990) show that approximately 2,800 astronomers, about two-thirds of the profession, are actively engaged in research; the AAS and AIP surveys show that the remainder are involved mostly in teaching or administration.
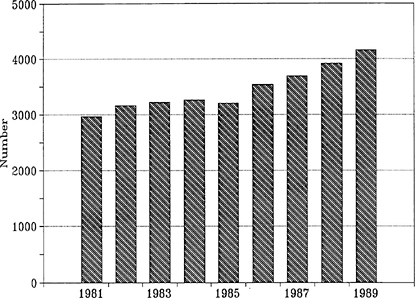
FIGURE B.1 The growth in the number of U.S. astronomers can be inferred from the membership of the American Astronomical Society (AAS), which has increased by 42 percent in the last decade. The numbers plotted were obtained by multiplying the AAS membership by 0.82 to account for foreign members in the AAS and other small corrections.
The number of doctoral degrees awarded for dissertations in astronomical topics over the last decade has averaged 125 degrees per year. However, the great scientific interest of astronomy has resulted in a flow of new people into the AAS, approximately 250 per year, that is about twice the rate of the production of PhDs in astronomy and astrophysics. Roughly half the people entering astronomy in the past decade were trained in a different science and subsequently migrated into the field.
Astronomy is being carried out by a young community. In 1987, the median age of U.S. astronomers was 42, the youngest of the 10 professional societies sampled by the AIP. Half the U.S. astronomers are currently between the ages of 35 and 50.
The percentage of women in astronomy has grown by almost 50 percent during the last decade, from 8 percent to 12 percent. Examination of the graduate student population shows signs of a slow, continuing growth in the number of women in astronomy. Recent surveys show that 12 percent of the doctoral degrees awarded by astronomy departments in 1987 went to women and that 20 percent of the total astronomy graduate population is female. These fractions are similar to or higher than the female membership of the AAS and suggest that the percentage of women in astronomy will continue to rise slowly during the 1990s.
Despite active recruitment efforts at universities and by NASA, ethnic
minorities remain significantly underrepresented in astronomy. Preliminary results from a survey of the AAS membership show that 93 percent of the AAS members classify themselves as white, 4 percent as Asian, and 1 percent as Hispanic. Afro-Americans constitute less than 0.5 percent of the AAS membership. These statistics reflect the situation in other sciences and must be addressed by an increased emphasis on science education and recruitment at all levels—primary and secondary school and college—as discussed in Chapter 7.
Astronomy as a Profession
The types of jobs that astronomers hold have changed over the last decade. The rapid growth of astronomy in the late 1960s and the concomitant youthful age of the astronomical faculty has meant that faculty retirements have been few and far between. This has, in turn, severely limited the number of tenured faculty positions that opened up during the last 10 years. Industrial and national research facilities employ increasing numbers of astronomers to carry out important astronomical research.
Academic institutions currently employ roughly half of the AAS members. Nearly 75 percent of those employed in academia hold permanent, tenured positions funded by state or private resources. Not including astronomers holding postdoctoral appointments, 17 percent of the academic astronomers hold jobs as research associates, semipermanent academic positions dependent on outside funding.
In the 1980s, the fraction of PhD astronomers working at universities decreased markedly, while the number of researchers depending on federal funding rose [see the report of the Status of the Profession Panel, Working Papers (NRC, 1991)]. A decade ago, 40 percent of the class of 1970 was working at universities, and 30 percent in tenured or tenure-track positions. In 1989, only 32 percent of the class of 1980 was working at universities, with 22 percent holding tenured or tenure-track positions. Twelve percent of the class of 1980 was working for industry, compared with 1 percent for the class of 1970. Fifteen percent of the class of 1980 was working in national laboratories, compared with 11 percent of the class of 1970 a decade ago. Finally, the rate of people leaving the field 10 years after receiving a PhD is constant at about 30 percent.
Industrial jobs, although often dependent on a company's ability to obtain outside funding, also have a degree of permanence. The percentage of U.S. astronomers who work in a corporate setting has nearly doubled over the last decade. In 1987, the number of astronomers who worked for industry or were self-employed exceeded the number who worked in Federally Funded Research and Development Centers, such as the national observatories.
TABLE B.1 Estimated Nonfederal Salary Support for U.S. Astronomers
|
U.S. Astronomers |
Salary Support (1990 $M) |
|
Approximate total—4,200 |
|
|
Median salary (1990$)—57,420 |
|
|
Average overhead rate—1.50 |
|
|
Fraction tenured or in tenure-track positions—0.51a |
|
|
Fraction of year supported (academics)—0.84 |
|
|
Total academic support |
154 |
|
Fraction employed in industry—0.09 |
|
|
Fraction of year supported (industry)—0.50 |
|
|
Total industry support |
16 |
|
TOTAL NONFEDERAL SUPPORT |
170 |
|
a Porter and Kellman (1989). |
|
THE FUNDING OF ASTRONOMICAL RESEARCH
Federal funding through grants and through the national observatories supports the research of most of the astronomical community. The NSF provides the major share of funding for ground-based astronomy, while NASA provides all the funding for space astronomy. Historically, ground-based optical astronomy has attracted additional private and state support, radio astronomy has depended heavily on federal funding, and space astronomy has been entirely federally supported. The report of the Status of the Profession Panel (Working Papers) notes that of all the articles appearing in the Astrophysical Journal in 1989, 40 percent cited NASA support, 40 percent listed NSF support, and 10 percent acknowledged other sources of federal funding. The NSF and NASA grant programs are of paramount importance to the health of the field. Important support for special projects is provided by the DOE, the DOD, and the Smithsonian Institution.
Astronomy has a long tradition of private and state support, including university salaries, modest support for faculty research, and occasional philanthropic donations of large research instruments like the Hale 5-m telescope and the Keck 10-m telescope. Using the data from Porter and Kellman (1989), it is possible to estimate that the nonfederal funding of astronomy in terms of salaries amounts to about $170 million per year (Table B.1). Including support for construction and operation of private or state facilities raises the total nonfederal level of support for astronomy to around $190 million per year. It should be pointed out that much of the salary support for university astronomers covers their teaching, rather than their research, activities.
The following analysis of funding trends is confined to the NSF and NASA
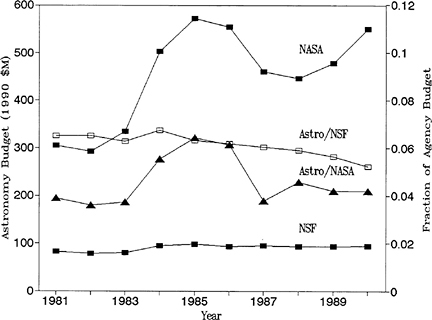
FIGURE B.2 Overall funding of astronomy by NASA and the NSF in constant (1990) dollars. The scale on the right shows the fractions of the two agencies' budgets devoted to astronomical activities.
astronomy programs. Figure B.2 shows the overall astronomy budgets for the two agencies and the fraction of the agency budgets devoted to astronomy. All references to funds have been converted to 1990 dollars using the Consumer Price Index cost-of-living index.
Support from the National Science Foundation
Historically, astronomy has received between 5 and 6 percent of the overall NSF budget. However, there has been a steady decline in this level to below 5 percent over the past decade (see Figure B.2). Funding from the NSF supports three major areas, the national centers, university observatories, and individual research grants (Figure B.3).
NSF grants range from small sums for the publication of conference proceedings to over $1 million per year for the operation of university observatories. The bulk of the grants program falls between these extremes and supports individual research projects. These grants make possible the research of individuals throughout the United States and provide for the training of the next generation of astronomers. Although the number of grants increased over the decade, Figure B.4 shows a steady erosion in the size of grants to individuals (excluding major grants for university observatories). With typical costs
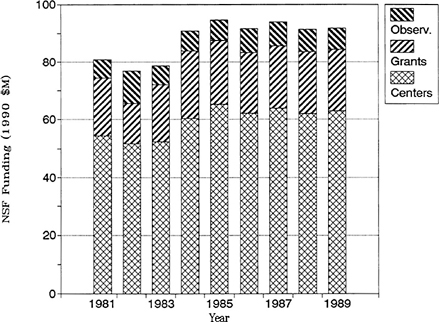
FIGURE B.3 The division between NSF funding of research grants and for the operation and construction of university observatories (observ.) and the national observatories (centers) over the last decade.
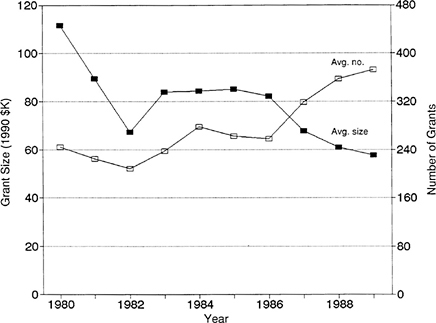
FIGURE B.4 The average size (1990 $K—solid rectangles) and number (open rectangles) of NSF research grants awarded in astronomy and astrophysics, corrected for the portion of the research budget devoted to operation and construction of university facilities.
of a summer salary, publications, and a graduate student salary, plus overhead, now exceeding $70,000 per year, the NSF grants program has dropped below a critical threshold. While an individual can, and often must, have more than one grant, such a system of support suffers from inefficiencies and often produces more proposals than research.
Support from NASA
Astronomy accounts for about 4 percent of the overall NASA budget and for about 25 percent of the budget of the Office of Space Science and Applications (see Figure B.2). Most of this money is spent on capital expenses associated with major observatory programs and increased temporarily during the mid-1980s, due in part to delays in the construction and launch of the Hubble Space Telescope. Figure B.5 shows the division between large programs (the Great Observatories); the moderate-scale Explorer program; and small projects, including the grants program, data analysis, and the Kuiper Airborne Observatory.
The NASA grants program increased during the 1980s, tracking the growth in the number of astronomers (Figure B.6). From 1982 to 1989, the average grant size remained stable at about $50,000. The small average size is due to the large number of small grants given to pay for observing with the International Ultraviolet Explorer (IUE). It should be pointed out, however, that the average grant is too small to support a postdoctoral fellow or, in some cases, even a graduate student. Many IUE researchers write multiple proposals to support themselves, their postdoctoral fellows, and their graduate students. In the rest of the NASA's astrophysics program, the grant sizes are significantly larger, about $83,000, although their size has decreased over the decade. The committee supports the efforts of NASA's Astrophysics Division to consolidate its large number of disparate grants programs into a smaller number.
NASA is becoming the dominant agency in astronomy grant funding. In 1982, NSF provided about 60 percent of the federal support for individual grants. By the end of the decade, NASA had provided more money for astronomy grants than had the NSF. Since several large, long-lived missions will be launched in the 1990s, NASA's grant support for data analysis is expected to increase even more.
ACCESS TO GROUND-BASED TELESCOPES
The telescopes currently used by the majority of astronomers are ground-based instruments operating at radio, optical, and infrared wavelengths. This section lists briefly the major instruments in use around the world at these wavelengths.
Americans want to participate directly in the thrill of discovery both
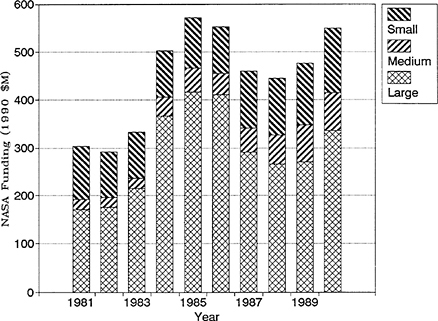
FIGURE B.5 NASA astronomy budget (1990 $M) divided between large programs, including the Great Observatories; moderate programs like the Explorers; and small projects, including research grants and the airborne program.
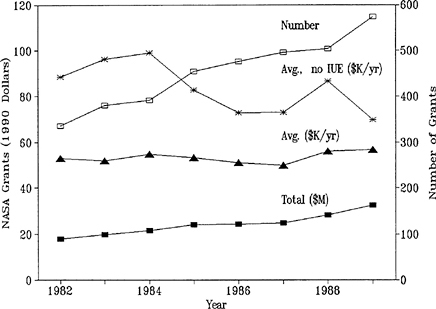
FIGURE B.6 NASA astronomy research grants program. The total program is shown in millions of dollars. Also shown are the average grant size (1990 $K/yr) with and without the IUE, and the total number of grants.
because of the excitement and the enlightenment that new knowledge of the universe gives and also because of the inspirational effect on young people who are considering careers in engineering and science. If we were not to have competitive ground-based facilities, the most important discoveries about the universe might well be made elsewhere and would most strongly stimulate and inspire young people of other countries.
Optical and Infrared Astronomy
The total area of the mirrors used for astronomical observation is a plausible, if imperfect, figure of merit for assessing the strength in optical and infrared astronomy of the United States relative to other countries. There is every reason to believe that the telescopes that will be built by other countries in the 1990s will be of the same quality as those planned for the United States and that these instruments will be located in comparably good sites. By this standard (Table B.2), Europe and Japan will be making great strides in optical astronomy, with major new instruments coming into operation in the 1990s. However, by the end of the century, U.S. astronomers will still have access to roughly one-third to one-half of the world's telescope area, depending on which private and national telescopes now under consideration are actually built.
Radio Astronomy
The major facilities for millimeter wavelength radio astronomy are discussed in Chapter 3 (see Table 3.2). The major facilities for centimeter wavelength astronomy are described in Table B.3 and Table B.4.
TABLE B.2 U.S. Fraction of World Telescope Area for Large (> 3 m) Telescopes
|
Telescope Name |
U.S. Fraction of Time |
Mirror Diam. (m) |
No. of Mirrors |
Date |
U.S. Fraction of Telescope Area |
|
|
Palomar |
1 |
5 |
1 |
1950 |
1.00 |
|
|
Lick |
1 |
3 |
1 |
1959 |
1.00 |
|
|
NOAO-KPNOa |
1 |
4 |
1 |
1974 |
1.00 |
|
|
CTIOa |
1 |
4 |
1 |
1975 |
1.00 |
|
|
AAT |
0 |
3.9 |
1 |
1975 |
0.81 |
|
|
Calar Alto |
0 |
3.5 |
1 |
1976 |
0.71 |
|
|
ESO |
0 |
3.6 |
1 |
1976 |
0.62 |
|
|
USSR |
0 |
6 |
1 |
1976 |
0.46 |
|
|
IRTFa |
1 |
3 |
1 |
1979 |
0.50 |
|
|
UKIRT |
0.15 |
3.8 |
1 |
1979 |
0.47 |
|
|
MMT |
1 |
1.8 |
6 |
1980 |
0.52 |
|
|
CFHT |
0.15 |
3.6 |
1 |
1980 |
0.50 |
|
|
Herschel |
0 |
4.2 |
1 |
1987 |
0.46 |
|
|
ESO NTT |
0 |
3.6 |
1 |
1989 |
0.43 |
|
|
Keck |
1 |
10 |
1 |
1991 |
0.61 |
|
|
ARC |
1 |
3.5 |
1 |
1991 |
0.62 |
|
|
WIYN |
1 |
3.5 |
1 |
1992 |
0.63 |
|
|
MMT-upgrade |
1 |
6.5 |
1 |
1994 |
0.65 |
|
|
Spec. Surveyb |
1 |
8 |
1 |
1995 |
0.70 |
(0.65)c |
|
VLT-1 |
0 |
8 |
1 |
1995 |
0.61 |
(0.56)c |
|
Keck-IIb |
1 |
10 |
1 |
1996 |
0.67 |
(0.56)c |
|
Columbusb |
0.75 |
8 |
2 |
1996 |
0.69 |
(0.56)c |
|
Japan |
0.1 |
7.5 |
1 |
1997 |
0.65 |
(0.51)c |
|
VLT-2 |
0 |
8 |
1 |
1997 |
0.60 |
(0.45)c |
|
Magellanb |
1 |
8 |
1 |
1997 |
0.61 |
(0.45)c |
|
VLT-3 |
0 |
8 |
1 |
1998 |
0.57 |
(0.40)c |
|
1 |
8 |
2 |
1997 |
0.62 |
(0.40)c |
|
|
VLT-4 |
0 |
8 |
1 |
1999 |
0.58 |
(0.37)c |
|
a Generally available to U.S. community. b Proposed. c Value in parenthesis is U.S. fraction if proposed U.S. telescopes are not built. |
||||||
TABLE B.3 Centimeter Wavelength Radio Telescopes—Major Filled Aperture Radio Telescopes
|
Instrument |
Diameter (m) |
Minimum Wavelength (cm) |
Location |
|
MPIR |
100 |
1.3 |
Bonn, Germany (1970) |
|
NAIC |
300 |
6 |
Arecibo, Puerto Rico (1963) |
|
NRAO GBT |
100a |
0.7b |
Green Bank, West Virginia (1995) |
|
a Effective projected aperture. b Long-term design goal 3 mm. |
|||
TABLE B.4 Centimeter Wavelength Radio Telescopes—Major Radio Interferometers
|
Instrument |
No. of Elements |
Element Size (m) |
Minimum Wavelength (cm) |
Maximum Size (km) |
Location |
|
MERLIN |
6a |
25–76 |
1.3 |
133 |
U.K. (1980) |
|
NRAO VLA |
27 |
25 |
1.3 |
35 |
Socorro, N. Mex. (1980) |
|
NRAO VLBA |
10 |
25 |
0.7 |
8,000 |
U.S. (1992) |
|
GMRT |
30 |
45 |
20 |
18 |
Puna, India (1993) |
|
Australia Telescope |
6b |
22 |
0.7 |
6 |
Australia (1990) |
|
a Seventh antenna to be in operation in 1991 will extend baseline to 220 km. b Seventh antenna to be added in 1991 will extend baseline to 115 km. |
|||||


