
Emerging Areas of Geospatial Intelligence
The National Research Council (NRC, 2010a) report New Research Directions for the National Geospatial-Intelligence Agency: Workshop Report identified five emerging subject areas that could potentially improve geospatial intelligence: geospatial intelligence (GEOINT) fusion, crowdsourcing, human geography, visual analytics, and forecasting.1 Although human geography goes back more than a century, technological and analytical developments have so changed the field that it is treated as an emerging area in this report. Among the emerging areas, there is an emphasis on crosscutting concerns such as threedimensional and spatiotemporal visualization, as well as linkages between geolocation, social media, crowdsourcing, and spatial analysis. GEOINT fusion covers the linkages, while each of the emerging areas shares the crosscutting concerns.
The five emerging areas are relatively computationally oriented and interdisciplinary, with concepts and skills taught across academic departments. Few are supported by degree programs or academic infrastructure (e.g., professional societies, journals), although these will come as the fields develop. This chapter describes each of the five emerging areas, including its origin, the knowledge and skills that are taught, and the scope of existing education and professional preparation programs.
GEOINT fusion is concerned with combining geographic information from multiple sources, whether structured or unstructured (e.g., sensor networks, databases, documents), to assess spatial or spatiotemporal phenomena for purposes such as tracking, prediction, or providing a common operational picture. For example, a situation assessment of an ongoing event such as the 2011 Arab Spring may fuse location-aware data from airborne or satellite sensors, social media (e.g., Twitter, blogs), news wires, and reports from observers on the ground. Fusion is important because assessments of a phenomenon from multiple sources of information are likely to be better than those from a single source.
Evolution
Research findings on GEOINT fusion began to be published in the 1980s. Early work provided a classification of use cases (White, 1999) for common tasks such as object refinement (e.g., observation-to-track association, target type and identification), situation assessment (e.g., identification of force structure, communications, and physical context), impact assessment (e.g., consequence prediction, susceptibility and vulnerability assessment), and process refinement (e.g., adaptive search and processing, resource management). These use cases have two dimensions—geographic footprint and temporal extent—as shown in Figure 3.1.
The simplest use case (level 0, subobject) fuses data at the granularity of a single location, such as a pixel in a remote sensing image. For example, a new image
__________________
1 Note that these terms differ slightly from those used in NRC (2010a).
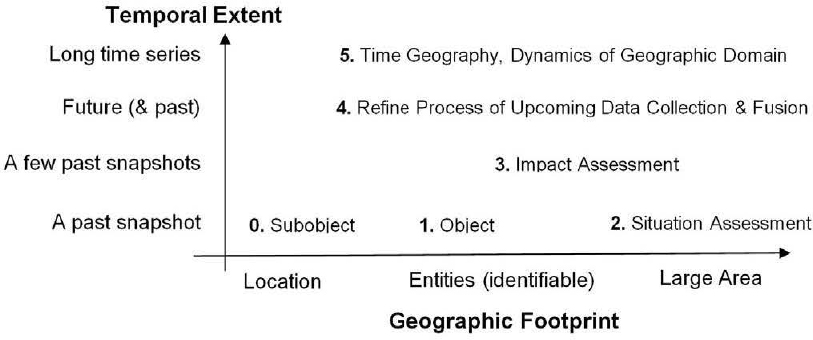
FIGURE 3.1 The complexity and methods used in GEOINT fusion depend both on the size of the geographical area (horizontal axis) and the length of the time period (vertical axis) being covered. In this figure, the classification of use cases is shown by these dimensions.
may be georegistered to a reference map by aligning specific image pixels to corresponding map landmarks. At level 1 (object/entity), information from multiple sensors with overlapping sensing ranges is combined to estimate properties (e.g., location, shape, size, type) of an identifiable entity, such as a vehicle or building. For example, a national air-traffic monitor room may track every aircraft using information collected from local air-traffic controllers. At level 2 (situation assessment), information from all sources is combined to estimate the impact of a recent event or behavior on a geographic area of interest. For example, an emergency manager may fuse weather prediction data sets, plume simulation maps, population density maps, and transportation maps to identify emergency evacuation routes.
The subobject, object, and situation assessment levels are often concerned with a single point in time (snapshot). However, multiple time frames can be considered at any level. At level 3 (impact assessment), a recent image may be compared with an older image to detect major changes in an object or geographic area of interest. For example, the impact of a forest fire may be assessed by comparing remotely sensed images before and after the fire. At level 4 (process refinement), the process of data collection and fusion is refined using what could be considered “control law” that depends on a utility function expressing the dependence of fusion quality on input quality. For example, fusion may be used to reconfigure the locations and trajectories of sensor platforms (e.g., satellites, aircraft, vehicles) to closely monitor an event (e.g., hurricane) or high-value target in order to improve the quality of fused output estimates of interest.
The late 1990s brought the establishment of the International Society for Information Fusion as well as two journals dedicated to information fusion: Journal of Advances in Information Fusion and Information Fusion. Conference discussions and publications have refined the use cases in new directions. For example, a long time series of snapshots may enrich traditional fusion with concepts from time-space geography ( Hägerstrand, 1967) and the dynamics of geographic domain ( Hornsby and Yuan, 2008), leading to a new use case (level 5). At the location (e.g., pixel) geographic footprint, a past time series of measurements can be used to determine a statistical distribution, which, in turn, can be used to evaluate future values for anomalies, regime-change points, and other factors. At an identifiable-entity geographic footprint, a time series of locations produced by multiple sensor measurements for an object can be fused to estimate the object’s trajectory, which can be processed further to identify its frequent locations, routes, schedules, and other spatiotemporal patterns (Shekhar et al., 2011).
One may even move beyond events to understand spatiotemporal interactions among event types and underlying processes. For example, a terrorism monitoring and prediction center could use fusion to estimate the parameters of a social-cultural model, which could then be used to assess risks of terrorist attacks at particular locations.
Knowledge and Skills
Fusion draws on many disciplines, including geographic information science, spatial statistics, remote sensing, computer science, electrical engineering, and physics. The concepts are taught at the university level under a variety of topics, such as map conflation (Saalfeld, 1988; Kang, 2009; Longley et al., 2010); spatial statistics (Bivand et al., 2008; Cressie and Winkle, 2011); spatial data mining (Shekhar and Xiong, 2008; Shekhar et al., 2011); data, sensor, or image fusion (Hall and Llinas, 1997; Pohl and Van Genderen, 1998; Hyder et al., 2002; Mitchell, 2010a, b); semantic web (Antoniou and Harmelen, 2004; Allemag and Hendler, 2011); and data, information, or schema integration (Batini et al., 1986; Sheth and Larson, 1990; Lenzerini, 2002; Dyché and Levy, 2006; Halevy et al., 2006). Increasingly this means using an interdisciplinary approach, especially as new data sources (e.g., sensor webs, social network data) are added to existing data sources (e.g., remote sensing). Searching for structure within large volumes of complex, multitheme, and multitemporal data (e.g., big data) also requires interdisciplinary skills, which will become increasingly important as data input sizes continue to grow. “Big data” are often defined by data volumes, variety, and uptake rates that are so large that they challenge the accepted methods of data aggregation, description, visualization, and analysis. Big data present important challenges to GEOINT fusion where current approaches are not scalable. Skills for dealing with these massive data agglomerations may require recruitment of data specialists.
A variety of skills are necessary to handle the workflow to produce GEOINT fusion. For situation awareness, for example, the workflow may include tasks such as identifying relevant sources, georegistering new information (e.g., aerial images), detecting and resolving inconsistencies and uncertainties across sources, characterizing new phenomena from data sources using models, and making cartographic and visualization decisions for presenting the information. Based on common workflows, the necessary skills for fusion include the following:
• Task-relevant source identification. During the 1980s, there were few geospatial intelligence data sources and most of the effort was dedicated to processing. However, advances in sensing, communication, and data management have greatly increased the number of potential sources. As a result, fusion is now leveraging an increasingly diverse array of information sources, including new physical sensors (e.g., videos from unmanned aerial vehicles), social media, and data sets gathered by governments, businesses, and scientists.
• Knowledge of common geospatial intelligence data sources. Data fusion often starts by merging data from multiple sources, which may have different data formats, geographic coordinate systems, geographic resolution, accuracy, and timeliness and are commonly handled by different domain experts. Knowledge of these differences is needed to load data into software systems, to merge data from multiple sources, and to resolve conflicts across data sources.
• Georegistration methods. Fusion often adds new information to a geospatial data set. For example, georegistering information from sources such as aerial imagery, Global Positioning System (GPS) tracks, and cell phones allows information on current locations of friends and foes to be added to a base map. Aerial imagery may be georegistered by identifying several landmarks common to the image and the base map and applying photogrammetric principles. A GPS track may be georegistered to a roadmap in an urban area by identifying the closest roads.
• Deriving new information from sources and managing uncertainty in a complex multisource environment. Some phenomena cannot be fully characterized from observations. Statistical and data-mining methods are used to remove anomalies, identify correlations across data sources, find clusters or groups, and classify or predict specific features using data sources as explanatory features. Evidential reasoning methods such as Bayes’ rule or the Dempser-Shafer theory of evidence may be used to estimate the most likely location and shape of a feature from the information available.
Optimization techniques from operations research are often required to develop solutions to complex combinatorial optimization problems across all fusion levels. Simulation models may be used to project phenomena, such as trajectories of chemical plumes.
• Geospatial intelligence information presentation. Fusion results are often presented on maps. Preparation of paper maps requires traditional cartographic skills, and preparation of electronic maps requires skills to leverage animation and interaction in context of computer screens, tablets, and cell phones.
• Workflow management. Workflow management systems may be used to specify fusion tasks and their interdependencies as well as to help keep track of progress and facilitate communication among team members. Workflows also enable fusion tasks to be handled within a data collection-analytical context, thus increasing the operational value of the fused data.
Education and Professional Preparation Programs
Although no degree programs are offered in GEOINT fusion, two universities have a research center in fusion: the State University of New York, Buffalo (Center for Multisource Information Fusion) and Pennsylvania State University (Center for Network-Centric Cognition and Information Fusion). In addition, some universities offer courses in various aspects of fusion, largely in computer science departments (e.g., Table A.6 in Appendix A). Semantic web courses are offered by many universities, including Johns Hopkins University, Georgia State University, and Lehigh University. Database interoperability and data integration courses are offered by the University of Southern California and by industry (e.g., Oracle, SAS, Sybase, IBM). Courses in multisensory data fusion are offered by a few universities (e.g., Pennsylvania State University; Arizona State University; Georgia Institute of Technology; University of California, Los Angeles; State University of New York, Buffalo) and by industry (e.g., Objectivity Inc., Applied Technology Institute). In addition, fusion topics are commonly discussed for a few weeks in courses on broader topics at many research universities. For example, geographic information science courses often discuss map conflation, and remote sensing and photogrammetry courses discuss image-to-image and image-to-reference (map) fusion. In addition, database courses discuss schema integration and data integration; signal processing courses discuss sensor fusion; and statistics, data mining, and spatial computing courses discuss spatial statistics and spatial data mining.
Graduate degrees in related areas (e.g., geographic information science, remote sensing, computer science and electrical engineering) allow a specialization in fusion through research projects and coursework from relevant disciplines. Degrees with a fusion specialization are available from universities with strong education and research presence in geographic information science, remote sensing, spatial statistics, computer science, electrical engineering, and physics. Examples include George Mason University; Georgia Institute of Technology; Ohio State University; Pennsylvania State University; Purdue University; University of California, Santa Barbara; University of Minnesota; and the University of Southern California.
Some professional programs in related broader areas (e.g., geospatial intelligence, geographic information science, security technologies, dynamic network analysis) provide opportunities to specialize in fusion by allowing students to choose a fusion-related capstone project and enroll in fusion-related elective courses. Such training opportunities are available at several universities, including George Mason University; Georgia Institute of Technology; Pennsylvania State University; Redland University; the University of California, Santa Barbara; and the University of Minnesota.
The term crowdsourcing was introduced by Jeff Howe in a 2006 article in Wired Magazine (Howe, 2006) and is defined in the 2011 Merriam-Webster dictionary as “the practice of obtaining needed services, ideas, or content by soliciting contributions from a large group of people and especially from the online community rather than from traditional employees or suppliers.”2 Crowdsourcing is related to participatory sensing, which shares the same principle of collecting data from a set of users working collaboratively (Estrin, 2010). The two terms are often used interchangeably, but the committee prefers the term crowdsourcing,
__________________
2 See <www.Merriam-Webster.com>.
which implies not only data collection but also other types of group activities, such as using performing work. Spatial information contributed by crowdsourcing is often referred to as volunteered geographic information. Because such information is collected by volunteers, it comes with challenges of accuracy, credibility, and reliability (Goodchild, 2007; Flanagin and Metzger, 2008). As the use of crowdsourced data grows, issues of data quality, uncertainty, trust, and conflation at the semantic level will increase in importance.
Evolution
Perhaps the earliest example of crowdsourcing was the Longitude Prize, a reward offered by the United Kingdom in 1714 to anyone who could develop a practical method to precisely determine a ship’s longitude. Another early example is the 19th Century Oxford English Dictionary, whose editors asked the public to index all words in English and provide example quotations for them (Winchester, 1998). The pace and scale of these volunteer initiatives has increased in recent years with the emergence of the Internet and social networking. Among recent high visibility efforts were the DARPA Network Challenge to collaboratively find marker balloons deployed by DARPA in the United States,3 and the Netflix Prize to develop algorithms for predicting how well users would like a film, based on their movie preferences.4 Openstreet Map,5 an editable map of the world, has been used by numerous companies (e.g., Waze) as their backbone mapping system. Openstreetmap.org had a remarkable success following the Haiti earthquake of January 2010, when volunteers worldwide created a new map from donated imagery in a few days. The crowdsourced map became the most accurate base for relief efforts (Zook et al., 2010).
Today, crowdsourcing plays a major role in creating information-rich maps, collecting geolocalized human activity, and working collaboratively. The convergence of sensing, communication, and computation on single cellular platforms and the ubiquity of the Internet and mobile web have allowed maps to be enriched with a variety of data. Early applications included traffic information collected from smartphones (Figure 3.2; Cheng, 2009; Hoh et al., 2012), available today from numerous companies (Google, INRIX, NAVTEQ, Waze, BeatTheTraffic.com). The concept was soon extended to enriching maps with other user-generated content, either through location-based services or posting from public records. Examples include maps of crime in Oakland,6 geolocalized real estate data (e.g., Zillow), photographic geolocalized postings (e.g., Flickr), pedestrian and sports GPS traces (e.g., Nokia7), and earthquake information (e.g., Figure 3.3).
The explosion of location-based services has led to the emergence of users sharing personal information (e.g., Facebook), professional information (e.g., LinkedIn), location (e.g., presence in a restaurant, at a landmark location; FourSquare), and social network activities (e.g., placing Facebook activity on maps; Loopt). This new information complements traditional cell tower information, which is already used in operational contexts (e.g., tracking al-Zarqawi by the U.S. military; Perry et al., 2006), by enriching available feeds using attributes disclosed knowingly or not, willingly or not, by the user.
Finally, new concepts of collaborative work are emerging. Wikipedia created a completely crowdsourced encyclopedia on a voluntary basis. It was followed by numerous services provided by volunteers, such as Facebook translation (Hosaka, 2008) and Yahoo! Answers. Amazon’s Mechanical Turk8 enables workers to remotely perform tasks at a distributed and large scale for money. This model represents a new trend in which the crowdsourced workers are active and follow directions. This type of activity has been used successfully for tagging, identification, labeling, parsing, clustering, and recognition.
Knowledge and Skills
Developing the technology for a crowdsourcing system requires knowledge of the problem domain as well as skills in computer programming (including parallel programming), data visualization, database design and management, operating systems, serviceoriented architectures, Internet applications, and the
__________________
3 See <https://networkchallenge.darpa.mil>.
4 See <http://www.netflixprize.com/>.
5 See <http://www.openstreetmap.org/>.
6 See <http://oakland.crimespotting.org/>.
7 See the Nokia Sportstracker program at <http://www.sportstracker.com/>.
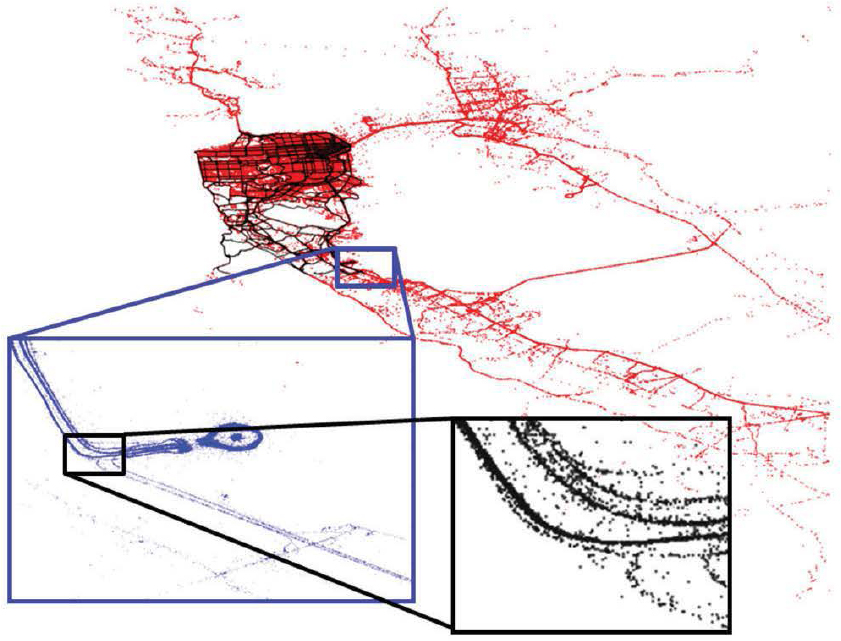
FIGURE 3.2 Example of crowdsourced GPS data, which were obtained by collecting tracks from San Francisco taxis through the Cabspotting program. Each point represents one GPS recording, sampled at an interval of one minute. Three different magnification levels show the detail obtainable from the data. The San Francisco Bay area is shown in red, the approach road to San Francisco International Airport is shown in blue, and the lanes on the Highway 101 intersection by the airport are shown in black. The road map for the Bay Area can be reconstructed from only one day of data. SOURCE: University of California, Berkeley, Mobile Millennium project.
ability to work with various types of data feeds. The technology has been developing rapidly, but a generic set of tools for implementation across applications has yet to emerge.
Building a crowdsourcing system requires the following knowledge and skills:
• Sensing, including hardware knowledge (any type of sensor), device knowledge (using phones or other devices to collect data), and software knowledge (e.g., collecting data from Internet activity).
• Signal processing and filtering, which are needed to remove noise from the data.
• Statistics, machine learning, and large-scale data analytics. Pattern matching, data mining, and statistical inference are needed to extract information from the large volume of data.
• Communications, cellular technology, mobile computing, and human-computer interaction, which are necessary because numerous crowdsourcing systems are based on cellular devices.
• Cloud computing and high-performance computing, which power most crowdsourcing applications.
The knowledge and skills needed to analyze crowdsourced data as well as the crowdsourcing process are
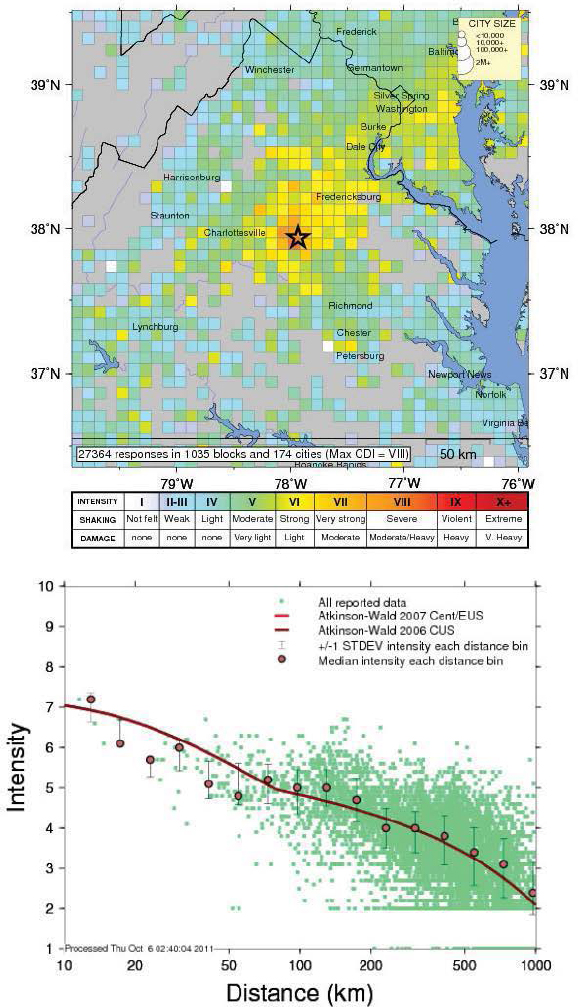
FIGURE 3.3 Example of crowdsourced data for earthquakes. The U.S. Geological Survey’s “Did you feel it?” program creates earthquake intensity maps from user responses. The top figure shows the geocoded intensities for the 2011 Virginia earthquake (magnitude 5.8). The bottom figure shows the intensity collected from user input as a distance from the epicenter (dots). The crowdsourced data is compared to model-based predictions (line). SOURCE: U.S. Geological Survey.
markedly different from those required to develop the technology. At a minimum, basic statistical and graphing skills are needed. Additional skills are needed to deal with data tagged with location and temporal information, including econometrics, error estimation, geospatial analytics, geospatial visualization, dynamic analysis, temporal clustering, social network analysis, dynamic network analysis, data mining, and text mining.
Education and Professional Preparation Programs
Crowdsourcing is not an established academic discipline. Students generally gain skills and knowledge in crowdsourcing through special projects carried out as part of a graduate curriculum. Most of the knowledge required for crowdsourcing lies outside traditional geospatial domains, as illustrated by the skills listed above. For this reason, training is distributed among academic departments and programs, including engineering (aerospace, civil, computer science, electrical, environmental, mechanical), statistics, geography, urban planning, and architecture (e.g., Table A.7 in Appendix A). A few multidisciplinary research institutes at universities offer knowledge and skills aligned with training in crowdsourcing, including the following:
• Center for Embedded Networked Sensing at the University of California, Los Angeles, which was one of the first centers to make academic contributions in the field and to offer a doctorate in participatory sensing (Estrin, 2010).
• Computer Science and Artificial Intelligence Laboratory at the Massachusetts Institute ofTechnology, which has a diverse faculty spanning most of the fields required for crowdsourcing.
• Wireless Information Network Laboratory at Rutgers University, which focuses on privacy and wireless information aspects of crowdsourcing.
• Algorithms Machines People at the University of California, Berkeley, which focuses on building systems that connect people to the cloud to solve hard problems using large data analytics algorithms and massive amounts of crowdsourced and other data.
In most cases, acquiring thorough knowledge of crowdsourcing requires a doctorate, although implementation skills can be obtained at the master’s level. For institutions such as the Massachusetts Institute of Technology, which has a thesis as part of its master’s program, or the University of California, Berkeley, which has a project as part of its master’s of engineering program, students will gain exposure to the topic through the research or project. In addition, many people involved with crowdsourcing are self-taught and learn by doing. Experts at this level are worldwide and often fall across the age spectrum. Two-year colleges have started to offer curricula to attract these casual practitioners, such as Android phone programming and scripting for web data scraping.
Finally, with the rise of Web 2.0 and the social web, numerous companies have trained engineers in house, enabling them to develop most of the skills needed for crowdsourcing. Several types of companies now have crowdsourcing skill sets, including the following:
• Companies which collect vast amounts of crowdsourced data by the nature of their products, such as Coogle, Facebook, Twitter, and FourSquare. Each of these companies has divisions or at least groups that focus on the internal development of data analytics tools for crowdsourced data.
• Companies that provide back-end support for systems which rely on crowdsourced data, such as infrastructure systems companies (e.g., IBM, HP) and traffic information companies relying on smartphone data (e.g., NAVTEQ Waze, INRIX).
• Companies that have developed a business around crowdsourced data analytics, such as SenseNetworks or Sensor Platforms, which were starting up when this report was written.
Human geography concerns the mapping of people, groups, organizations, sentiments and attitudes, norms, belief systems, social activities, and “ways of doing business” over space and time (Figure 3.4). It has been referred to by many names, including cultural geography, human terrain, rich ethnography, cultural mapping, social mapping, sociocultural context, and social
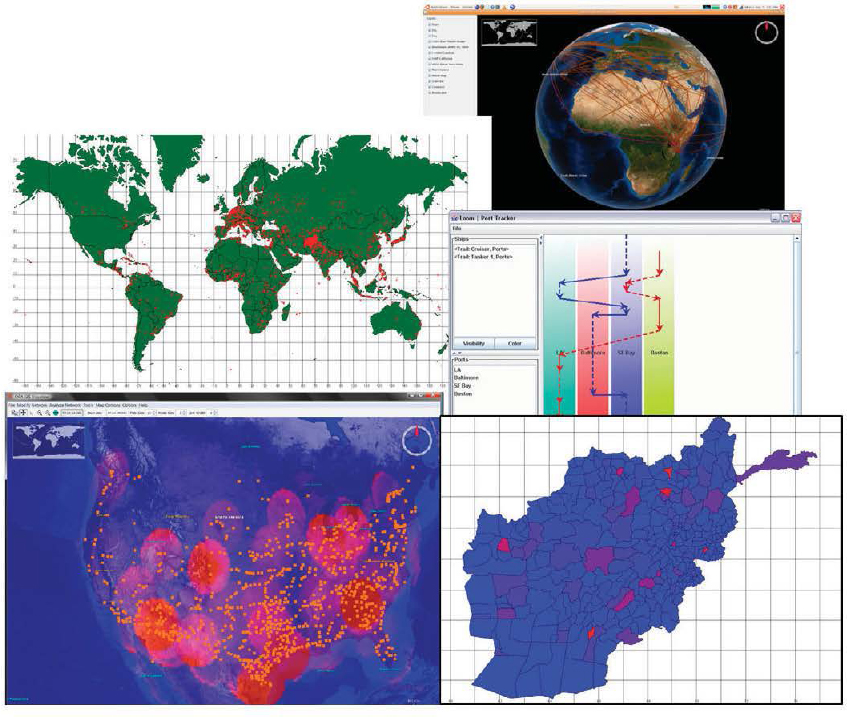
FIGURE 3.4 Different types of visualization used in human geography. (Top right) A social network (lines between the locations of participants) superimposed on a NASA Worldwind visualization of the globe. Such images are used to show the relation of social network ties to physical space. (Middle left) Map showing the density of a particular activity. Each dot indicates the location where an actor of interest has been seen. The background image is a standard ARCGIS shape file. (Middle right) Tracking information for two ships, used to track who or what was where when and to identify common paths. Solid lines show known movement between locations (colored columns) and dashed lines indicate inferred movement or lack of movement. Time is vertical and locations are horizontal. (Bottom left) Locations of actors of interest (dots) and secondary information about the spatial density of the betweenness of the nodes (clouds; e.g., Freeman, 1977). Such images are used to identify critical locations. Background image is from NASA Worldwind. (Bottom right) Heat map image of Afghanistan using a standard ARCGIS shapefile. Each region is colored by the number of times actors of interest have been in that region. The brighter the red, the higher the level of activity. Such images are used to understand the region of activity and identify points of intervention. SOURCE: All images were produced using ORA.
domain. The use of new technologies and methods, such as network analysis, graph-based statistics, and evolutionary agent-based modeling, distinguishes the emerging area of human geography from its roots as a subfield of geography, sociology, and anthropology.
Evolution
Although human geography has been around for more than a century, the decision to build a human terrain program for the wars in Iraq and Afghanistan
led to the rethinking of the role of human cultural knowledge. The human terrain program brought together information technology and a vast array of regional sociocultural information that had been scraped from the web, provided through social media, gathered from other open sources, and collected in the field. The data were analyzed using search and comparison techniques, social network analytics, geographic visualization, and statistics. The aim was to provide up-to-date, accurate information about the general sociocultural environment, current opinion leaders and persons with power, and climate, economic, and political conditions.
Increasingly, sociocultural information, both historical and current, is being placed on maps. New technologies that admit location capture (e.g., modern cell phones) are increasing the amount of location-based data on social and social interaction. Crowdsourcing, Ushahidi-style data captures (e.g., reports submitted by local observers via mobile phone or the Internet), location-based twitters, and so on are providing unprecedented levels of sociocultural information that is at least partially spatially tagged. With new data come new research opportunities and the ability to understand how space constrains and enables social and cultural activity. Illustrative new areas of research include geotemporal social media sampling, location identification from texts, and geonetwork analytics. The next decade will likely see major changes in the quality of sociospatial data presentation and new technologies for capturing, assessing, visualizing, and forecasting social data with a spatiotemporal context.
Knowledge and Skills
Human geography involves four main components:
1. Geo-enabled network analysis—mapping the network of who, what, how, why, and when to locations (e.g., the al-Qaeda social network).
2. Sentiment and technology dispersion—mapping the movement of ideas, activities, technologies, and beliefs as they move from location to location (e.g., the spread of revolution in the Middle East during the Arab Spring).
3. Cultural geography overviews—compendiums of diverse information on current leaders, languages, foods, habits, religions, etc., which are increasingly taking the form of web-based mashups. Such overviews and the tools for analyzing them formed the basis of human terrain efforts during the Iraq and Afghanistan wars.
4. Sociolinguistic ethnic characterizations— mapping which families, clans, and tribes are where (e.g., the tribal sociolinguistic heredity network).
Each of these areas requires different expertise. Some areas require technical expertise (e.g., programming, scripting) while others require the mastery of advanced conceptual frameworks and approaches (e.g., agentbased modeling, network analysis). These skills are not generally acquired in traditional courses on sensor assessment, cartography, or map interpretation.
An important skill in human geography is text mining: the process of deriving high-quality information from textual sources for analysis. Text, such as news articles, books, twitter feeds, and blogs, contain information about differences in the human condition across locations. Techniques for mining text are reasonably accurate for extracting the names of people, organizations, and locations from English texts. However, challenges remain in interpreting multiple languages, identifying the location of places, and distinguishing between place and person names (e.g., the city of Dorothy Pond, Massachusetts) and place and organization names (e.g., the White House). Both geographical expertise and text-mining expertise are needed to address these problems.
Education and Professional Preparation Programs
A comprehensive human geography program covers five core elements: (1) collection and coding of geomarked human data, (2) geo-enabled text analysis, (3) geo-enabled network analysis and dynamic network analysis, (4) computer simulation of human geography data and forecasts, and (5) geocultural analysis and overviews. Each of these has an associated set of methods and tools that students need to learn, including (1) tools for collecting social media and news data (e.g., TweetTracker, REA); (2) tools for natural language processing, text mining, and sentiment mining (e.g., AutoMap); (3) tools for metanetwork analytics and visualization (e.g., ORA, R); (4) tools for developing
agent-based and system dynamic simulations (e.g., MASON, Construct, Dynamo), with particular attention to the diffusion of information and the dispersion of beliefs and activities; and (5) qualitative ethnographic assessment, sociolinguistic characterization, sentiment analysis, text mining, and questionnaires. These elements are rarely taught at the undergraduate or master’s level. Most of the education is at the doctorate level (e.g., Table A.8 in Appendix A) or is offered through professional development or specialized training programs such as the Center for Computational Analysis of Social and Organizational Systems (CASOS) Summer Institute. Although many universities cover one or two of these elements in their doctorate programs, only two (Carnegie Mellon University and the University of Arizona) cover all five.
In addition, a number of universities are adding courses in the human-geography area to their doctorate programs. For example, the sociology programs at Cornell and the University of California, Irvine, and the computer science program at the University of Arizona all cover network analysis with courses related to geo-enabled network analysis. The George Mason University Center for Social Complexity and the University of Michigan Center for Complex Systems cover agent-based modeling that takes account of the spatial aspects of human behavior.
Programs that teach social network analysis (Box 3.1) are beginning to cover geo-enabled network analysis. Some programs that teach computer modeling are beginning to teach the programming and data acquisition techniques needed to create and use maps as a way of displaying human behavior. Two-year and community colleges have been among the first academic institutions to teach some of the basic skills needed to use and develop social networking tools and, to some extent, basic tools necessary for network analysis of social data, such as reading GPS signals. These programs are loosely based in media studies and computer science programs and are widespread across the nation.
Visual analytics is the science of analytic reasoning, facilitated by interactive visual interfaces integrated with computational power and database capacity (Thomas and Cook, 2005). Analytical reasoning is central to the analyst’s task of drawing conclusions from a disparate set of evidence and assumptions. The objective of visual analytics is to derive insight from voluminous, changing, vague, and often contradictory geospatial data and other information while avoiding human information overload (van Wijk, 2011). Some examples of information graphics used in visual analytics are shown in Figure 3.5.
Evolution
The growth in the quantities of information that require visual representation and analysis by humans and the increasing complexity of the associated data and analytical problems have given rise to visual analytics as a new scientific discipline (Andrienko et al., 2010). Visual analytics has formalized only recently, with a key publication in 2005 (Thomas and Cook, 2005) and more recently a series of special issues in journals (e.g., Keim et al., 2008; Stapleton et al., 2011).
Visual analytics has origins in cartography, geographic information science, computer vision, information visualization, and scientific visualization. In general, cartography deals with maps and geospatial data, geographic information science deals with spatial relations and spatial query and analysis, scientific visualization deals with data that have a natural physical or geometric structure (e.g., wind flows), and information visualization deals with abstract data structures (e.g., trees, graphs). Choice and reasoning are central to visual analytics.
Research and new directions in visual analytics include creating new information visualization methods, virtual imaging, semantic search, data fusion, dynamic network visualization, and user testing. In particular, methods that focus on how to integrate graphics into the problem-solving process itself has become a key research interest.
Knowledge and Skills
Visual analytics deals with amplifying human cognitive capabilities
• by increasing cognitive capacities and resources, such as memory;
BOX 3.1
Social Network Analysis
There has always been an implicit link between social network analysis and human geography. For example, proximity is a strong basis for individuals forming relations, with most relations weakening with distance. Social network analysis examines the structure of the relations connecting nodes (e.g., people, organizations, topics, events). Many of the earliest studies looked at networks of people connected by relationships such as kinship, mentoring, and works-with. These networks are represented as graphs (e.g., Figure), and matrix algebra or nonparametric network statistics are often used to assess these networks; to identify key nodes, critical dyads, and groups; and to compare and contrast networks (Wasserman and Faust, 1994). Social network analysis is a key methodology in the human geography toolkit.
Evolution. Social network analysis emerged prior to World War II, with early advances in frelds such as anthropology, sociology, and communications (Freeman, 2006). The past 10 years have seen a movement to broaden the field of social networks. Changes rnclude the transition from graph-theory-based metrics to a combination of graph-based and statistical measures, the expansion from small networks to very large-scale networks, the increased attention to communication and social media data, and the shift to geotemporal networks. This broader field is often referred to as dynamic network analysis and it is characterized as the study of the structure and evolution of complex sociotechnical systems through the assessment of weighted multimode, multilink, multilevel dynamic networks that are geo-embedded The field is supported by the quarterly journal Social Networks, the online journal of Social Structure, and an increasing number of specialty journals such as Social Network Analysis and Mining
Knowledge and Skills. The study of social networks is integral to fields such as statistics, sociology, organizational science, communication, computer science, and forensic science. However, the ubiquity of networks, the value of graphs as a representation, and the strength of structural thinking has increased the interest in networks in almost every scientific discipline. For example, network analysis has been used in sociology to study social and communications networks (Wasserman and Faust, 1994), in biology to study animal behavior (e.g., Krause et al., 2007), and in geography, civil engineering, ecology, and other disciplines to extend graphs to real or abstract space (Haggett and Chorley, 1969; Urban and Keitt, 2001; Adams et al., 2012). This increased interest has led to a proliferation of theories about how these networks form, evolve, and affect behavior. It has also led to new methods, such as dynamic networks techniques for sets of networks through time, and meta-network metrics for multimode, multilink data. Statistical approaches for assessing dynamics, information loss, and error provide the foundation for social network analysis. Social science approaches are used to study the dynamics within social networks (e.g., recrprocity, social influence, power) and the social, institutional, and historical contexts in which network ties are formed and broken.
Education and Professional Preparation Programs. Classes in social networks are taught in a number of U.S. universities, usually at the doctorate level. However, undergraduate textbooks and courses are starting to appear. Universities with multiple courses in this area include Carnegie Mellon University, University of Kentucky, Northeastern University, Northwestern University, Harvard, Stanford, Indiana University, and the University of California, Irvine. Courses are taught primarily in business and sociology departments, but also in anthropology, communication, management, organizational behavior, organizational theory, strategy, public policy, statistics, information science, and computer science departments. Network analysis in the geometric sense is taught in geography, mathematics, transportation science, computer engineering, and operations research programs.
Continuing education programs provide a primary venue for training in this area. For example, didactic seminars are conducted at the main social networks conference (the International Network for Social Network Analysis) for 2 days prior to the conference. Half-day and full-day training programs are often offered at management science, organization theory, sociology, and anthropology conferences. In addition, there are numerous multiday or week-long training programs, including the CASOS Summer Institute, the Lipari summer school, and the East Carolina University program for marine biologists.
• by facilitating search;
• by enhancing pattern recognition, often by restructuring relations within data;
• by supporting perceptual inference of structures and patterns that are otherwise invisible;
• by improving the ability to monitor large numbers of sensors and events; and
• by providing methods that support exploration and discovery.
Methods in visual analytics are based on principles drawn from cognitive engineering, design, and perceptual psychology (Scholtz et al., 2009). These methods provide a means to build systems for threat analysis, prevention, and response. Visual analytics therefore
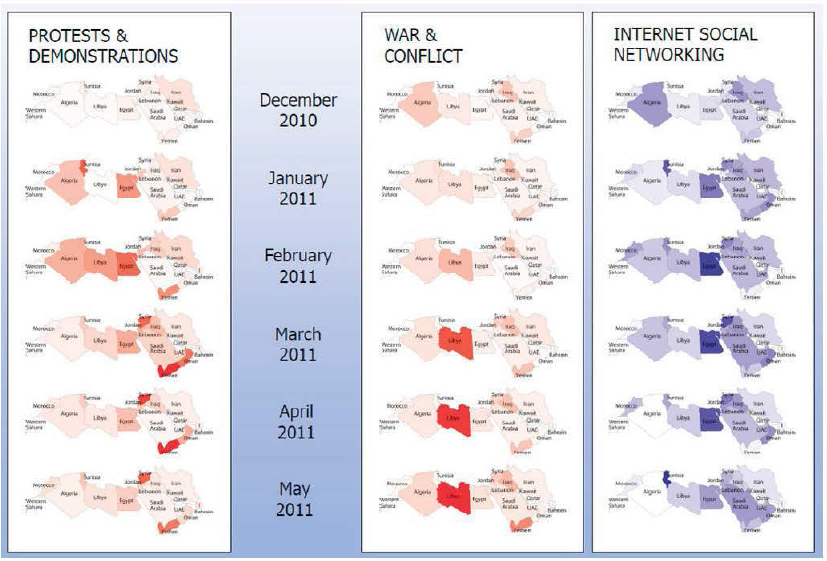
FIGURE Social network analysis is used to show changes in criticality of topics-protests and demonstrations, war and conflict, and Internet and social networking-for the Arab Spring countries. The degree centrality of the three topics (the extent to which a node is connected to other nodes) is based on tags for Lexis-Nexis news articles. The figure shows that the coverage of protests and demonstrations did not spread geographically, and that the change in relevance of the Internet and social networking did not spread in the same way as the revolutions. SOURCE Courtesy of JOrgen Pfeffer and Kathleen Carley, Carnegie Mellon University
expands the methods available to analysts but also creates a need for new sets of skills (Ribarsky et al., 2009). Many of these methods are highly dependent on the Internet and on graphics systems and standards.
The suite of skills necessary for research and practice in visual analytics includes an ability to program in scripting and numerical computing languages, an understanding of maps and graphics, the ability to think and reason spatially, and knowledge of user-centered design principles. For example, programming or scripting skills are needed to develop visualization tools or to extend existing tools, which are commonly targeted to particular applications. Searching for structure within large volumes of complex, multitheme, and multitemporal data (e.g., big data) requires interdisciplinary skills. Severing (2011) noted the importance of moving beyond specialization
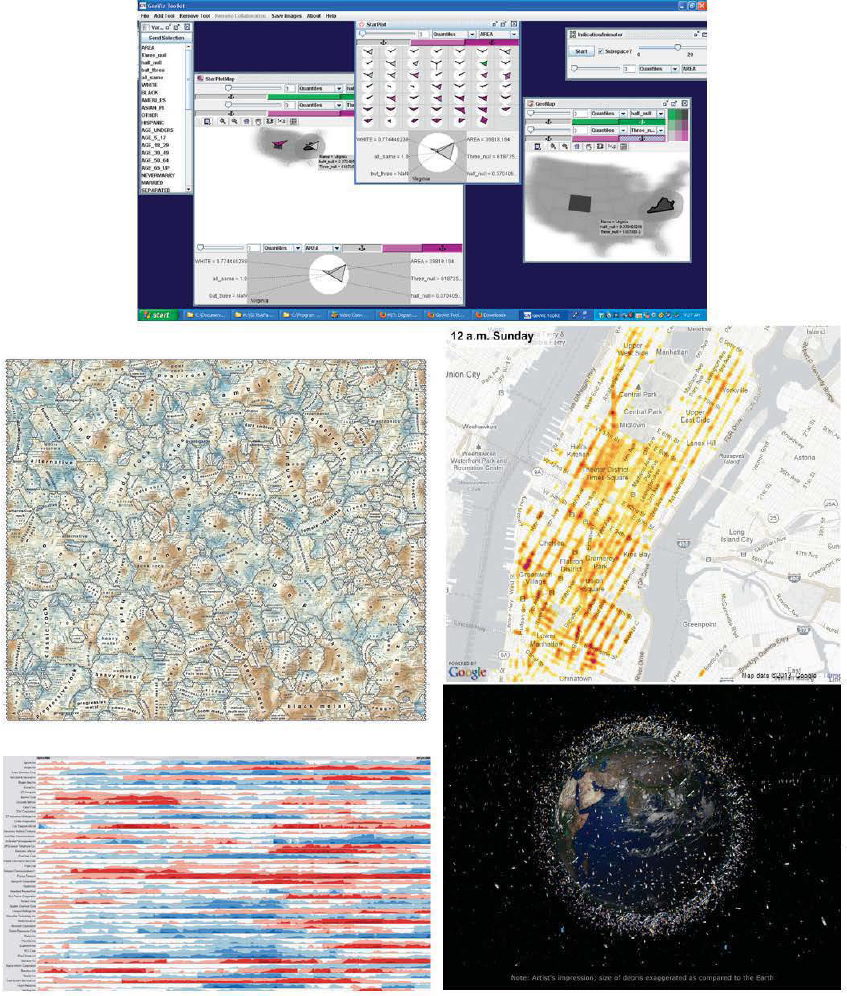
FIGURE 3.5 Examples of some information graphics used in visual analytics. (Top) Multimethod display. SOURCE: Screenshot from GeoViz Toolkit developed by Frank Hardisty, GeoVISTA Center. (Center left) A semantic landscape of the Last.fm Music Folksonomy using a self-organizing map. SOURCE: Joseph Biberstine, Russell Duhon, Katy Börner, and Elisha Hardy, Indiana University, and André Skupin, San Diego State University, 2010. (Center right) Heat map of wireless connections. SOURCE: Sense Networks. ( Bottom left) Synchronized time-series display. SOURCE: Hannes Reijner, Panopticon Software. (Bottom right) Debris objects in low Earth orbit. SOURCE: European Space Agency.
in one field and teaching interdisciplinary flexibility when dealing with big data (in his case for bioinformatics). These skills are rarely available in one person, so teaching and research in visual analytics is commonly carried out by groups of collaborative scholars with different disciplinary backgrounds.
Education and Professional Preparation Programs
Closest to a formal education in visual analytics are interdisciplinary graduate and undergraduate programs that have evolved from communications, visual arts, media studies, geography, computer vision, and human-computer interaction research. For example, at the University of California, Santa Barbara, it is possible to earn a Ph.D. in multimedia arts and technology while doing a considerable amount of coursework in visual analytics. Universities that offer suites of graduate-level classes in visual analytics include the University of North Carolina, Indiana University, the University of Washington, and the Georgia Institute of Technology (Table A.9 in Appendix A). The Georgia Institute of Technology also hosts an online library of materials (e.g., videos, recorded lectures, sample exams) intended for use in higher education in visual analytics.9
Methods used in visual analytics are often taught in discipline programs—such as information visualization, cartography, GIS, computer gaming, and computer graphics—although not as a central focus. Many 2-year and community colleges offer basic preparation in visual analytics through media technology, computer programming and scripting, graphic design, imaging and graphics, and human-computer interaction programs.
Research and on-the-job training in visual analytics are also offered by online businesses, gaming companies, and the open-source programming community. Visual analytics research has bases at both the Pacific Northwest National Laboratory and at the Oak Ridge National Laboratory. Private companies involved in visual analytics include Northrop Grumman and Oculus, Inc., a Toronto-based company working on the visual display of time-space tracks. The primary avenue for discussing visual analytics is national conferences, most based in the United States, such as InfoViz, Where2.0, and the Institute of Electrical and Electronics Engineers Symposium on Visual Analytics Science and Technology.
Forecasting is a technique that uses observations, knowledge about the processes involved, and analytical skills to anticipate outcomes, trends, or future behaviors. Forecasts are related to predictions and anticipatory intelligence. In general, forecasts attempt to estimate a magnitude or value at a specific time (such as 3-day forecast of temperature), whereas predictions estimate what may happen and the odds of it happening (such as predicting what fraction of people will develop skin cancer). Anticipatory intelligence combines computational methods (e.g., agent-based modeling, system dynamics, Bayes network models) with role playing and applications of game theory to generate integrated time-based simulations.
In the geospatial domain, forecasting needs to address what, where, when, and how events will unfold and how processes will evolve in space and time. Geospatial events and processes are a result of interactions among the natural and built environments as well as social and cultural systems across global, regional, and local scales.
Evolution
The ability to forecast future behavior is central to many scientific disciplines. Among the first disciplines to embrace quantitative methods for forecasting were meteorology and economics. Weather forecasts were made from data, charts, and maps until the late 1950s, when empirical methods began to be replaced by numerical weather forecasting (Lutgens and Tarbuck, 1986). Similarly, economic forecasts transitioned from methods using stationary and deterministic assumptions in the late 1960s (Khachaturov, 1971) to probabilistic or stochastic methods, then to complex simulations of dynamic, adaptive economic systems in 1990s and 2000s (Clements and Hendry, 1999; Gasparikova, 2007).
Recent advances in computational methods, econometrics, simulation, system dynamics, agent-based modeling, and game theory have allowed forecasters
__________________
9 See <http://vadl.cc.gatech.edu>.
to generate a range of possibilities to support decision making or scenario-based planning. The International Institute of Forecasters (IIF) was founded in 1981 to promote forecasting through multidisciplinary research, professional development, bridging theory and practice, and international collaboration among decision makers, forecasters, and researchers. A majority of its members are from the economics, business, and statistics communities. IIF publishes two journals: the International journal of Forecasting (a peer-reviewed academic journal started in 1985), and Foresight: The International journal of Applied Forecasting (a journal for practitioners, started in 2005).
Advances in sensor technologies and the increasing availability and timeliness of information have opened new opportunities for forecasting. Forecasts are now being made in areas ranging from ecology (Luo et al., 2011) to technology (NRC, 2010b) to sports ( Yiannakis et al., 2006). The concept of nowcasting— forecasts of local events in near-real time—has emerged for both physical and socioeconomic systems. For example, nowcasting systems to project the development and dissipation of convective storms 2 hours ahead were tested during the 2008 Beijing Olympics (Wilson et al., 2010). Nowcasting is considerably more challenging than forecasting. It is one thing to forecast population growth of a city over the next year; it is quite another to nowcast the population distribution downtown for emergency evacuation. Nowcasting demands rapid assimilation of massive amounts of data from multiple sources into model runs; scientific understanding of event evolution, the environment, and their interactions; and the ability to deal with measurement errors, incomplete data, or uncertain information in real time. Moreover, research shows that both computational models and human judgment are required to optimize the nowcast (Monti, 2010).
Geospatial intelligence forecasting can play a key role in informing a variety of decisions for military or security operations. Examples include determining optimal clothing based on weather forecasts (Morabito et al., 2011), strategic planning based on forecasts of political
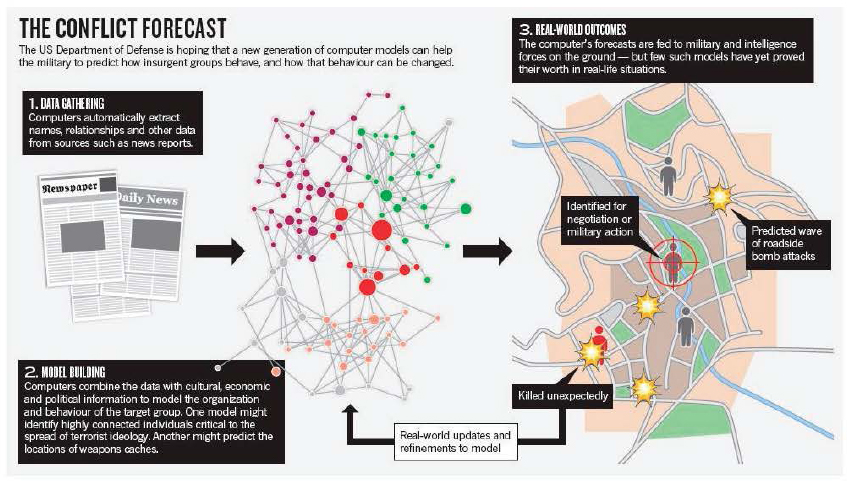
FIGURE 3.6 Example of geospatial intelligence forecasting. Data extracted from various sources, including structured data sets or unstructured texts, provide information about people, activities, and events. The information is analyzed using computer models to reveal the potential connections among people, activities, and/or events and to project possible future events. SOURCE: Reprinted by permission from Macmillan Publishers Ltd on behalf of Cancer Research UK: Web of War, Weinberger (2011).
instability (Goldstone et al., 2010) or other events that may threaten liberal democracies ( Anderson, 2010), and anticipating social or political change through cyber-empowered political movements, social disruptions, or cultural conflicts (Bothos et al., 2010; Paris et al., 2010; Weinberger, 2011; Figure 3.6). However, rigorous methods for forecasting social patterns and social changes have not yet been fully developed.
Knowledge and Skills
Robust forecasting methods build on a solid understanding of the composition and structure of a system and the embedded interactions among system components and between the system and its environment (Boretos, 2011). Geospatial forecasting requires both deep domain knowledge and advanced skills in spatiotemporal analysis, modeling, and synthesis. Examples include regression statistics, spatial and temporal interpolation techniques, space-time prisms and trajectory models, cellular automata and agent-based modeling, artificial neural networks, evolutionary and genetic algorithms, computer simulation and ensemble techniques, and scenario-based planning that anticipates multiple possibilities.
Forecasts in the context of geospatial intelligence need to integrate both geospatial processes and domain processes to reveal patterns, relationships, and mechanisms that drive state changes. For example, activity-based intelligence—the predictive analysis of the activity and transactions associated with an entity, population, or area of interest—depends on an understanding of environmental, social, and cultural factors; individual space-time behaviors; and the spatiosocial processes that move and regulate activities of groups and the society.
New methods and analytical tools emerging from the computational social sciences are changing the education and skills needed for geospatial intelligence forecasting. For example, new approaches are being developed to address the validation and calibration challenges of agent-based and other complex systems models. Tools such as the Integrated Crisis Early Warning System have been developed to predict political events such as insurgency, civil war, coups, or invasion. The increase in volunteered geographic information and geotagged images or communications brings the field a step closer to short-term and near-real-time forecasts of event progression, such as the spread of wildfire or disease, or of social dynamics, such as perception or activities planning.
Education and Professional Preparation Programs
No university programs offer degrees in forecasting, and many science-based or business-based curricula emphasize modeling instead of forecasting. Courses in advanced methods for spatial and domain-specific processes are taught at senior undergraduate or graduate levels in a wide range of disciplines, including statistics, computer science, information science, electrical engineering, civil engineering, meteorology, geography, economics, ecology, criminology, epidemiology, and urban and regional planning. Geospatial forecasting requires an integrative treatment of spatial and temporal data and is still considered an advanced, specialized area of research. The few advanced spatial modeling courses available are commonly tailored to the faculty’s research interest, rather than providing a comprehensive coverage of analytical and modeling techniques. Examples of universities with strong programs in agent-based modeling include Carnegie Mellon University, George Mason University, and the University of Michigan (see Table A.10 in Appendix A). The Massachusetts Institute of Technology has a strong program in system dynamics.
Time-series analysis is the foundation for forecasting, and relevant courses are commonly taught in meteorology, geography, geology, ecology, economics, political science, and other departments that emphasize modeling and projections. Students learn how to detect temporal trends and to project them into the future using techniques such as harmonic analysis, wavelet analysis, and historical event modeling. Examples of programs that offer courses in these areas include the University of Oklahoma and the University of Washington (meteorology); the University of California, Santa Barbara, and the State University of New York at Buffalo (geography); and Harvard University and Princeton University (economics and political science; see Table A.10 in Appendix A).
Space presents another important dimension of forecasts. In human geography, spatial diffusion theory, central place theory, and time geography offer
both conceptual and mathematical bases for spatial prediction, such as spatial interpolation, spatial gravity modeling, spatial regression, and spatial optimization. These traditional analog and mathematical modeling techniques are commonly taught in geography, geology, epidemiology, criminology, civil engineering, transportation science, urban and regional planning, and landscape architecture departments. A few universities offer advanced geocomputational methods for spatial prediction, such as Monte Carlo simulation, Markov chain modeling, cellular automata, agent-based modeling, geographically weighted regression, spatial self-organizing maps, spatial trajectory modeling, spatial niche modeling, spatial Bayesian statistics, and spatial econometrics. Example universities offering courses in the spatial aspects of forecasting include Arizona State University; Clark University; the University of Texas, Dallas; San Diego State University; the University of Utah; the University of Maryland; and Ohio State University.
Some community colleges or technology centers (e.g., GeoTech Center) offer basic statistics courses or computer modeling tools (such as STELLA), which can provide foundation training for beginners. Opportunities for professional training in forecasting are limited. Workshops or summer schools, such as those offered by the Spatial Perspective to Advance Curricular Education program,10 the Center for Spatially Integrated Social Science,11 and the University of Michigan, are perhaps the main form of training for advanced space-time methods or geocomputational techniques. Many of these workshops cover only the fundamentals. For economics and business, the IIF frequently offers training workshops for practitioners at their conferences.
__________________
10 See <http://www.csiss.org/SPACE/>.
11 See <http://www.csiss.org/>.


