
Status and Trends of Physical Activity Behaviors and Related School Policies
Key Messages
• Few children in the United States, probably no more than half, meet the currently recommended standard of at least 60 minutes of vigorous- or moderate-intensity physical activity daily.
o The proportion meeting the standard declines with age, with more elementary school children than middle and high school students achieving the goal. Boys are more likely than girls to meet the recommendation.
o During the past 30-40 years, probably even longer, the volume and intensity of daily physical activity among youth have gradually declined.
• Given the large proportion of total waking hours spent at school and in school-related activities, remarkably little is known about students’ physical activity behaviors during school hours and during school-related after-school activities. Despite some excellent research and a few good public health surveillance systems, current monitoring of overall and school-related physical activity behaviors among
youth and school-related policies and practices that enable or impede those behaviors is inadequate.
• An adequate description of the current status of and monitoring of changes in students’ school-related physical activity behaviors currently is not possible. Public health and education surveillance and research need to be enhanced so that the impact of efforts to increase students’ physical activity can be monitored.
• Policies are and will be important in creating an atmosphere in schools that enables, facilitates, and encourages children to be more physically active. Less clear are the factors that create an effective policy. An understanding is needed of what facilitators (e.g., funding, promotions, awards) and enforcers (e.g., less funding, job security) lead to policies that are fully implemented.
As discussed in further detail throughout this chapter, few children in the United States, probably no more than half, meet the currently recommended standard of at least 60 minutes of vigorous- or moderate-intensity physical activity daily (CDC, 2012b). In addition, the proportion meeting the standard declines with age, with more elementary school children than middle and high school students achieving the goal. Boys are more likely than girls to meet the recommendation. Finally, it can be said with reasonable certainty that during the past 30-40 years, probably even longer, the volume and intensity of daily physical activity among youth have gradually declined.
It is also known that because children and adolescents spend so many hours at school, school-related physical activity must be a large contributor to overall physical activity among youth. Not known, however, is exactly how large the overall contribution is or the contribution of each segment of the school day—transportation to and from school, physical education, recess, classroom time, and before- and after-school activities. It is known that over the past 40 years the proportion of children walking and biking to school has declined substantially; otherwise, there are at best rough estimates of the current physical activity behaviors, recent changes, or long-term trends associated with each of these segments of the school day.
Guidelines, recommendations, and policies from all levels of government (federal, state, district, local) and from various organizations (e.g.,
National Association for Sport and Physical Education, American College of Sports Medicine) are known to influence youth’s school-related physical activity. Understood as well is that the strength of that influence is, in turn, affected by incentives and enforcements associated with those guidelines, recommendations, and policies (see Figure 1-3 in Chapter 1). What remains unclear is which guidelines, recommendations, policies, incentives, and enforcements are most influential in today’s social milieu.
What should also be apparent is that, despite some excellent research and a few good public health surveillance systems, current monitoring of overall and school-related physical activity behaviors and school-related policies and practices that enable or impede those behaviors is inadequate. These deficiencies have arisen for several reasons. First, physical activity has only recently been acknowledged as a vital public health issue, so monitoring of the volume of physical activity at the population level is a recent objective with still insufficient priority. The Physical Activity and Health Branch of the Centers for Disease Control and Prevention (CDC) was not established until 1996, and the first formal federal-level physical activity guidelines were not published until 2008 (HHS, 2008). Second, physical activity is a notoriously difficult behavior to measure. Third, understanding of the types and amounts of physical activity relevant to health and health outcomes is still growing. The types and amounts of physical activity recommended for children and adolescents have changed several times in the past 20 years, frustrating efforts to monitor trends. Fourth, information is scarce on prevalence and trends for policies that may enable (or inhibit) physical activity. Examples include school- and district-level policies on recess and training for physical education teachers, as well as community or neighborhood policies on active transport to and from school. Monitoring of policies and practices is improving but needs expansion and maturation. Finally, schools and school districts vary greatly in size, resources, environmental setting, urbanization, population characteristics, traditions, and policies. Summary assessments and measures may capture the national gestalt but omit important differences among subgroups.
Physical Activity Versus Exercise
Physical activity is defined as all human movement; it is done at some rate of energy expenditure in all settings and for many different purposes. Exercise is a subcomponent of physical activity that is done for the purpose of increasing physical fitness. Intensity (i.e., rate of energy expenditure) is an important descriptor of physical activity because different intensities have different physiologic effects. Both physical activity and exercise encompass the full range of energy expenditure.
The purpose of this chapter is to describe the evidence supporting these general statements about the status and trends of the physical activity behaviors of school-age children and adolescents, as well as the school-related policies and practices that help determine those behaviors. Description of the status and trends of physical activity behaviors of youth requires, along the way, some discussion about the behaviors themselves, how they are measured, and how the current recommendations came into being.
Unless they take a nap or lie down to rest, all people are physically active from the time they get up in the morning until they go to bed at night. Physical activity is a necessary part of everything people do at home, work, or school; while going from place to place; and during leisure time. Few people in the United States, whether adults or children, expend a great deal of energy during physical activity, but they are always expending some. In the still-emerging field of physical activity and public health, physical activity is commonly defined as “any bodily movement produced by skeletal muscles that results in energy expenditure” (Caspersen et al., 1985, p. 126). Despite this straightforward definition, physical activity is a complex behavior with a wide variety of types and intensities. Types of physical activity may be categorized, for example, by type of movement (e.g., walking, skipping), by sport (e.g., soccer, badminton), by life context (e.g., at school, at home, during transportation), or by predominant physiologic effect (e.g., cardiorespiratory conditioning, muscle strengthening). Regardless of the categorization scheme, physical activity operates through multiple physiologic pathways to influence many health outcomes. Although physical activity can be categorized and discussed in many ways, aerobic activities are the most common and have the broadest physiologic and health effects. Aerobic activities are commonly categorized as being of sedentary, light, moderate, or vigorous intensity based on the rate of energy expenditure (see Box 2-1).
STATUS OF PHYSICAL ACTIVITY BEHAVIORS AMONG YOUTH
This section reviews what is known about the status of physical activity behaviors among youth, first for vigorous- or moderate-intensity activity, next for sedentary or light-intensity activity, and finally for vigorous- or moderate-intensity activity during the school day.
Vigorous- or Moderate-Intensity Physical Activity
Vigorous- or moderate-intensity physical activity is important for normal growth and development (see Chapter 3), including maintenance
BOX 2-1
Categories of Intensity of Physical Activity
Categories of Absolute Rate of Energy Expenditure
Aerobic activities are common and important. Such activities include walking, dancing, and playing soccer or basketball, all of which involve large muscle groups in rhythmic repetitive movement. Aerobic activities are performed at a pace that can be continued for more than a few minutes, and when done at higher-than-usual levels, improve the efficiency and capacity of the cardiorespiratory system (Powell et al., 2011).
Aerobic activities have commonly been categorized based on the rate of energy expenditure, or intensity, at least in part because high rates of energy expenditure were known to be important for fitness training and were presumed necessary to reduce the risk of heart disease. Although energy expenditure can be measured in various units (e.g., kilocalories, milliliters of oxygen consumption), metabolic equivalents (METs) have become the method of choice in public health circles. One MET is the rate of energy expenditure while a person is at rest and is equivalent to an oxygen uptake of about 3.5 ml/kg body weight × min. Because METs take a person’s body weight into account, the MET rate for any given activity is similar for all individuals. For adults, for example, the MET rate while sitting at rest is 1.0, for cooking or food preparation is 2.0, for walking at 3 miles per hour is 3.5, and for running at 5 miles per hour is 8.3. Because of their smaller size, immature motor patterns, and other physiologic differences, children’s energy expenditure for most activities is slightly higher than that for adults (Torun, 1983). Despite these differences, adult MET values provide the best approximation of energy expenditure for children for most activities. The exceptions are walking and running, for which equations based on age and speed should be used (Ridley et al., 2008).
Although rate of energy expenditure is a continuous variable, splitting the range into four categories has become standard (Pate et al., 2008) (see the table on the next page). This categorization scheme has facilitated conversation, epidemiologic analysis, surveillance, and public health recommendations. Although useful, the scheme and its arbitrary
cut-points have become rigid, obscuring the fact that rate of energy expenditure is a continuous variable and cut-points are arbitrary.
Categories of Intensity of Physical Activity
| Category | Range of Metabolic Equivalents (METs) | Examples of Activities |
| Sedentary Activity | ≤1.5 METs | Sleeping, lying down, sitting, watching television |
| Light-Intensity Activity | >1.5-<3.0 METs | Standing; walking slowly; everyday activities such as getting dressed, making a bed, cooking |
| Moderate-Intensity Activity | ≥3.0-<6.0 METs | Walking, table tennis, ball-room dancing |
| Vigorous-Intensity Activity | ≥6.0 METs | Running at various speeds, shoveling snow, mowing the lawn while walking with a hand mower |
of healthy body composition, and reduces the likelihood of acquiring risk factors for the development of chronic diseases later in life. The currently recommended dose of physical activity for children and adolescents is at least 60 minutes of vigorous- or moderate-intensity physical activity per day, with vigorous physical activity on at least 3 of those days (Strong et al., 2005; PAGAC, 2008).
In 2005 a panel was convened by the CDC specifically to consider the physical activity needs of children and adolescents (6-18 years of age). The
Relative Rate of Energy Expenditure
The rate of energy expenditure expressed in METs, kilocalories, or kilo-joules is an absolute measure of intensity. For all people, higher rates of energy expenditure require a greater level of effort, and the above categorical terms for the commonly used categories—sedentary, light, moderate, vigorous—reflect that fact. For most healthy and reasonably fit youth and adults, the categorical terms and the individual’s perceived level of effort closely align. Older and unfit persons, however, require a greater relative, or perceived, level of effort to accomplish a given physical activity (see the table below). For example, a healthy person with the capacity to expend energy at a rate of 12 METs feels as though he or she is performing vigorous activity when jogging (MET level above 7), whereas an older or unfit person with a capacity of only 5 METs feels as though he or she is performing vigorous activity when walking (MET level of 3-4). Recognizing that level of fitness determines the rate of energy at which physical activity can be performed is important when planning programs to improve the fitness of any individual or group.
Relative Intensity of Activity for Younger and Fit Persons and for Older and Unfit Persons
| Relative Intensity | Younger and Fit (12 MET capacity) | Older and Unfit (5 MET capacity) |
| Light | <3.2 METs | <1.8 METs |
| Moderate | 3.2-7.5 METs | 1.8-3.3 METs |
| Vigorous | ≥7.6 METs | ≥3.4 METs |
| SOURCE: Adapted from Table D-1 in PAGAC, 2008. | ||
panel reported beneficial effects of regular physical activity on muscular health, cardiovascular health, adiposity, blood pressure, blood lipid levels, self-concept, anxiety, depressive symptoms, and academic performance. The optimal dose was more difficult to determine for at least two reasons (see also Box 2-2). First, different health outcomes accrue from different doses. Second, research demonstrates a positive dose response rather an ideal dose. The panel concluded, however, that “school-aged youth should participate every day in 60 minutes or more of moderate to vigorous physi-
BOX 2-2
Dose of Physical Activity
The dose of physical activity, sometimes referred to as volume or amount, is a function of the type, frequency, duration, and intensity of the activity. Until recently, benefits appeared to derive almost exclusively from vigorous- or moderate-intensity physical activity, and almost all epidemiologic, clinical, and intervention research focused on that intensity range. Evidence derived from that research indicated that, for both adults and youth, health benefits are more closely related to the total dose of vigorous- or moderate-intensity physical activity than to any of the components of dose (i.e., type, frequency, duration, intensity) (PAGAC, 2008). Research has consistently demonstrated an inverse relationship between the dose of regular vigorous- or moderate-intensity physical activity and a wide variety of adverse health outcomes (e.g., heart disease, diabetes, functional limitation, depressive symptoms) (PAGAC, 2008).
Dose of vigorous- or moderate-intensity physical activity has been measured in a variety of ways, including minutes per week, kilocalories or kilojoules of energy expenditure, or even miles or minutes of running per week. A method frequently used to describe the dose of vigorous- or moderate-intensity physical activity is to multiply the time spent in the activity by its metabolic equivalent (MET) value (see Box 2-1). For example, running at 5 miles per hour (about 8 METs) for 20 minutes provides a dose of 160 MET minutes.
Accelerometers permit estimates of the total dose of physical activity performed in a day regardless of intensity (see also Box 2-3). By estimating intensity for every minute, accelerometers can provide an estimate of the total dose of vigorous- or moderate-intensity physical activity. Accelerometers are not yet able to “know” exactly what type of physical activity is being performed (e.g., cycling, stair climbing, raking, sweeping) and as a result may over- or underestimate the rate of energy expenditure. Nevertheless, the products are improving rapidly, and their capability to measure sedentary and light-intensity as well as vigorous- or moderate-intensity activities makes them an increasingly valuable tool.
The inverse relationship between dose of vigorous- or moderate-intensity physical activity and reduced risk of adverse health outcomes clearly demonstrates that larger doses provide more health benefits. Selecting a single dose to recommend has been more difficult, especially for youth,
because less research is available on this question, and the pattern of the dose-response curve is less well established (PAGAC, 2008). A composite of the findings for adults from 10 studies of regular physical activity and all-cause mortality indicates a curvilinear relationship, with the risk of mortality decreasing as the dose of regular vigorous- or moderate-intensity physical activity increases (PAGAC, 2008; Powell et al., 2011) (see the figure below). Four points are worth noting about the dose-response curve. First, there is no lower threshold for benefit; some vigorous- or moderate-intensity physical activity is preferable to none. Second, the slope is steepest at the left side of the curve, suggesting that the most rapid reduction in risk occurs when the least physically active people become slightly more active. Third, there is no obvious best dose, making a range of doses (e.g., 150-300 minutes per week of vigorous-or moderate-intensity physical activity for adults) as in the current U.S. guidelines (PAGAC, 2008) preferable to a single dose. Fourth, at levels of activity commonly achieved in the general population, there is no upper threshold above which risk ceases to decline, although the rate of decline decreases.
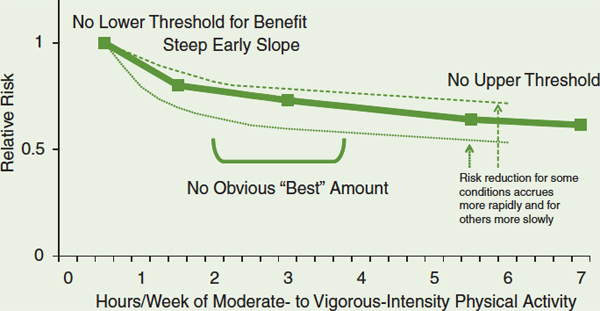
Risk of all-cause mortality by hours per week of vigorous- or moderate-intensity physical activity.
SOURCE: Adapted from PAGAC, 2008.
The available evidence indicates that the dose-response curves for the beneficial effect of regular vigorous- or moderate-intensity physical activ-
ity on the risk for type 2 diabetes, hip fracture, cardiovascular disease, coronary heart disease, stroke, depression, dementia, breast cancer, and colon cancer are similarly shaped (PAGAC, 2008) but with slightly different slopes (Powell et al., 2011); insufficient data are available with which to prepare similar dose-response curves for other health outcomes. Risk reduction accrues more rapidly for diabetes and hip fracture and less rapidly for breast and colon cancer. Risk reduction for cardiovascular disease, depression, and dementia appears to be quite similar to the curve for all-cause mortality. These differences are not surprising given the wide variety of physiologic pathways through which regular physical activity produces its various health benefits. The shape of the dose-response curve and the differences in the slopes of the curves for different health outcomes demonstrate the difficulty of identifying a specific dose or even a range of doses of vigorous- or moderate-intensity physical activity that should be recommended.
cal activity that is enjoyable and developmentally appropriate” (Strong et al., 2005, p. 736). In 2008 the Physical Activity Guidelines Advisory Committee also reviewed the scientific evidence relating to physical activity and the health of children and adolescents (PAGAC, 2008). That committee confirmed the benefits reported by the previous panel. The committee also agreed that it is difficult to select a minimal or optimal dose of physical activity for youth but reaffirmed the recommendation for 60 minutes or more per day of vigorous or moderate physical activity. The committee further commented that weekly activity should include some vigorous activity on at least 3 days and some activities to strengthen muscles and bones.
Available information indicates that relatively few youth achieve a daily dose of at least 60 minutes of vigorous- or moderate-intensity physical activity. Information on the proportion of youth who are vigorously active on 3 or more days per week is not available. However, about 10 percent of middle and high school students responding to the Youth Risk Behavior Survey (YRBS), conducted by the CDC and state health departments, self-reported that on no days in the previous week did they spend at least 60 minutes doing vigorous- or moderate-intensity physical activity, about 50 percent reported doing so on at least 5 days, and about 30 percent
reported meeting the recommended 7 days (CDC, 2012b) (see Figure 2-1). In a different ongoing national survey of 8th-, 10th-, and 12th-grade students—Monitoring the Future—fewer than half of students reported doing 60 or more minutes of vigorous activity every or almost every day (Delva et al., 2006).
Results from surveys measuring physical activity with accelerometers and including younger children similarly suggest that few children, especially older ones, meet the currently recommended volume of vigorous- or moderate-intensity physical activity. A study of accelerometer-measured physical activity among students in central Massachusetts found that almost all students in grades 1-6, but fewer than one-third of high school students, performed at least 60 minutes of vigorous- or moderate-intensity physical activity at least 5 days per week (Pate et al., 2002) (see Figure 2-2); the proportion of students meeting the 7-day recommendation would, of course, be lower. Also worth noting is that for high school students in this study, the accelerometer-estimated prevalence is about half the self-reported estimated prevalence for the same dose among students responding to the YRBS (see Figure 2-1). (See Box 2-3 on measuring physical activity.)
Results of other surveys confirm the decline in vigorous- or moderate-intensity physical activity with age (Nader et al., 2008; Troiano et al., 2008). Figure 2-3 displays the mean number of minutes of vigorous- or moderate-intensity physical activity per day rather than the proportion who
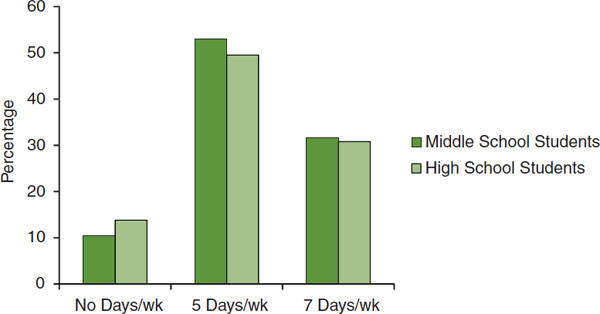
FIGURE 2-1 Percentage of middle and high school students reporting they engaged in no days, 5 days, or 7 days per week of 60+ minutes of vigorous- or moderate-intensity physical activity.
NOTE: The middle school estimate is the mean of 15 statewide surveys; the high school estimate is based on a nationwide sample.
SOURCE: CDC, 2012b.
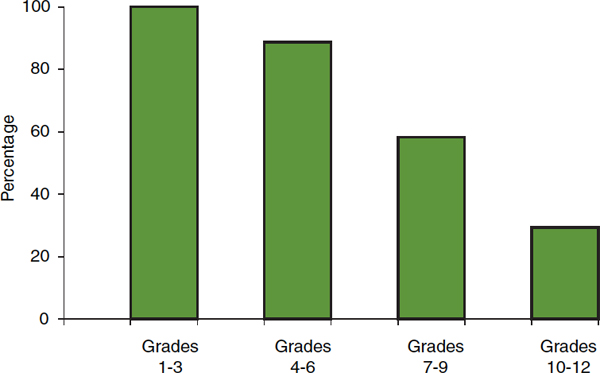
FIGURE 2-2 Percentage of students performing accelerometer-measured vigorous- or moderate-intensity physical activity for at least 60 minutes on at least 5 days per week, by grade.
SOURCE: Adapted from Pate et al., 2002.
BOX 2-3
Measuring Physical Activity
Physical activity has been measured in multiple ways—self-reported measures (e.g., surveys, activity logs); instrumental measures (e.g., pedometers, accelerometers), often called “objective” measures; and direct observation—none of which are completely satisfactory.
Self-report surveys, in which youth are asked to provide information about their physical activity behaviors, have been the most common method of measurement. They vary considerably in the detail requested and obtained. For example, the 3-Day Physical Activity Recall (3DPAR) asks about the predominant activity performed (a list of likely options is provided) and the intensity of that activity (light, moderate, hard, very hard) during each of 34 30-minute segments between 7 AM and midnight (Pate et al., 2003). The 3DPAR has been used with children as young as 5th grade (Powell et al., 2009) but understandably has been used largely as a research tool. In contrast, the Youth Risk Behavior Survey (YRBS),
used to monitor a number of important health-related behaviors of youth, currently asks the following question: “During the past 7 days, on how many days were you physically active for a total of at least 60 minutes per day? (Add up all the time you spent in any kind of physical activity that increased your heart rate and made you breathe hard some of the time.)” Self-reported data have been and will remain important. It is relatively inexpensive to obtain and can provide information about what specific activities were performed, as well as where and why. The YRBS, for example, inquires about participation in physical education classes and on sports teams. Self-reported information also has important limitations and weaknesses. Readers might try asking themselves the above question about physical activity during the past 7 days to realize how difficult it is to provide an accurate response. High school students likely are better than middle school students at answering such conceptually complex questions, and the questions as asked would be inappropriate for elementary school students—self-report has been discouraged as a mode of physical activity assessment for children less than 10 years old (Kohl and Hobbs, 1998). Moreover, even though students appear to answer personally sensitive questions (e.g., about their sexual behaviors) frankly, self-reported information is at risk of bias due to social acceptability and level of knowledge and experience. Self-reported data also are much more accurate for vigorous-intensity than for moderate- and light-intensity activities and generally overestimate the amount of vigorous- and moderate-intensity physical activity performed. Further, some studies have asked parents to provide information on the physical activity behavior of elementary-aged youth. The accuracy of parent proxy reports of children’s physical activity behavior has not been established.
Instrumental monitors, such as pedometers and accelerometers, provide more objective assessments of physical activity and are being used with increasing frequency. Pedometers and accelerometers, about the size of a watch, usually are attached at hip level to a belt or other article of clothing. Participants are instructed to wear them during waking hours for several days, often a week, except when bathing or swimming. Pedometers detect the vertical force associated with each step, and the output (number of steps taken) is reasonably straightforward. Accelerometers are more complex. They record the force of movements in up to three directions, and as they have become more sophisticated, require more complicated software to download and process the raw
data. The instruments avoid the subjective weaknesses of self-reported data but have their own problems. First, they must be properly calibrated to assess the existence and force of any movement. Moreover, accelerometers are reasonably good at detecting and quantifying common ambulatory movements (e.g., walking, running) but are not as good for stair climbing; cycling; water activities; or activities primarily of the upper body, such as sweeping or raking. In addition, the instruments cannot determine exactly what activity is being done, where, or why. The cut-points used to place movements in the common intensity categories (sedentary, light, moderate, vigorous) also may over- or underestimate the volume of activity depending on the predominant physical activity behaviors of the subjects under investigation (Matthews et al., 2008; Troiano et al., 2008), and they cannot assess relative intensity. Still, instruments measuring physical activity continue to improve and are becoming less costly, and they are useful across the full age spectrum. They appear to be the best method for collecting information about activities in the low and middle ranges of rate of energy expenditure and are expected to become even better with more research and experience.
Direct observation can be carried out with a number of reliable and valid tools (e.g., System for Observing Fitness Instruction Time [SOFIT], System for Observing Play and Leisure Activity in Youth [SOPLAY], System for Observing Play and Relationships in Communities [SOPARC]) developed to allow one or multiple observers to capture physical activity levels of youth across various settings and activities, such as physical education classes, recess, or leisure play in neighborhood settings (e.g., parks) (McKenzie et al., 1991). Observations capture information on sedentary (e.g., lying down or sitting), moderate-intensity (e.g., walking), and vigorous (e.g., running) physical activity behaviors from a sample of study participants. The observer can also record what activity is being done, where, and why. Some observation instruments also allow additional contextual information to be collected, such as social groups and social behavior during activities (System for Observing Children’s Activity and Relationships during Play [SOCARP]). Direct observation also has limitations, however: it is expensive, observers who collect the data must be trained in the use of the instruments, a sample of study participants rather than a census is observed, and observers must be physically present or capture the entire area on video for later review.
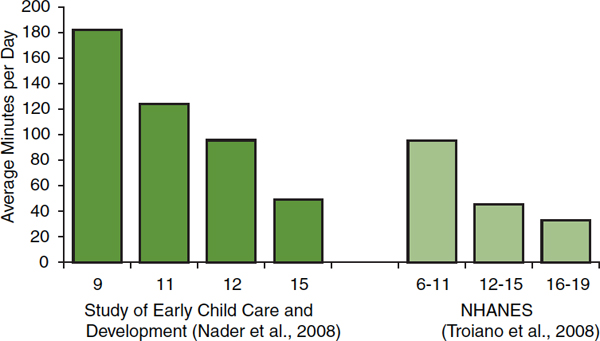
FIGURE 2-3 Average minutes/day of accelerometer-measured vigorous- or moderate-intensity physical activity by years of age and source.
NOTE: NHANES = National Health and Nutrition Examination Survey.
SOURCES: Nader et al., 2008; Troiano et al., 2008.
do or do not achieve a set number of minutes, as presented in Figures 2-1 and 2-2. These three figures illustrate some of the difficulties entailed in comparing studies that used different measurement methods (i.e., self-report versus accelerometer-measured) and different types of data summary (i.e., proportion meeting a specific standard versus average of the whole group).
In addition to the low proportion of children and adolescents meeting currently recommended physical activity levels and the decline in vigorous-or moderate-intensity physical activity with age, data from the above and other surveys indicate, almost without exception, that girls are less active than boys (see Figure 2-4). Patterns of activity by race/ethnicity are less clear. Large surveys (e.g., YRBS, Monitoring the Future) using self-reported information usually find that whites report more vigorous- or moderate-intensity physical activity than other racial/ethnic groups (Simons-Morton et al., 1997; Delva et al., 2006; CDC, 2012a). In the National Health and Nutrition Examination Survey (NHANES), however, in which physical activity is assessed using accelerometers, non-Hispanic blacks are the group with the most vigorous- or moderate-intensity physical activity (Troiano et al., 2008; Gortmaker et al., 2012). In a study of 6th-grade girls from six states, also using accelerometers to assess physical activity, white girls had the highest average number of minutes of vigorous- or moderate-intensity physical activity, while African American girls had the highest prevalence of meeting physical activity recommendations (Pate et al., 2006b). An
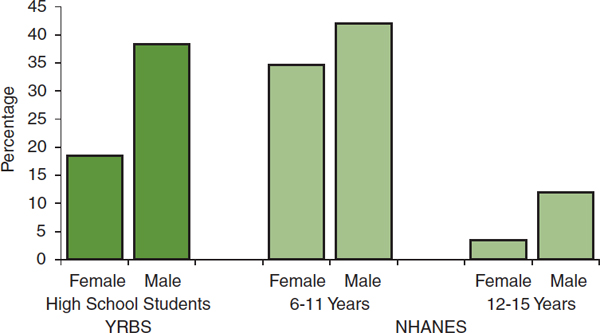
FIGURE 2-4 Percentage of youth reporting at least 60 minutes of vigorous- or moderate-intensity physical activity daily by sex: self-reported estimates from the Youth Risk Behavior Survey (YRBS) (2011) and accelerometer estimates from the National Health and Nutrition Examination Survey (NHANES) (2003-2004).
SOURCES: Troiano et al., 2008; CDC, 2012b.
analysis of youth aged 12-19 who performed treadmill tests as part of the NHANES found that about one-third of subjects failed to meet standards for cardiovascular fitness, but there were no significant differences in the prevalence of acceptable cardiovascular fitness among non-Hispanic white, non-Hispanic black, and Mexican American subjects (Pate et al., 2006a). Physical fitness and physical activity are different but directly related concepts. Finding no differences in cardiovascular fitness among groups suggests that there also are no differences in overall amounts of vigorous- and moderate-intensity physical activity.
Fewer data are available with which to assess the influence of socio-economic status on physical activity behaviors, and these data, too, provide no clear picture. Proxy information from the NHANES for children aged 6-11 indicate that a higher proportion from low-income than from high-income families meet current recommendations for vigorous- or moderate-intensity physical activity (Fakhouri et al., 2013). Self-reported information from children 9-13 years of age and their parents shows a slightly lower percentage (74 percent) of children from low-income (≤$25,000/year) than from high-income (>$50,000/year) families (78 percent) engaging in free-time vigorous- or moderate-intensity physical activity (CDC, 2003). This same survey did find that substantially fewer children from low-income (24 percent) than high-income (49 percent) families participate in organized physical activities because of transportation problems, expense, and lack of opportunities.
Despite limited information about differences, if any, in physical activity behaviors among racial/ethnic or socioeconomic groups, information about the variability of funding among school districts across the United States suggests that not all students have equal opportunities for participating in physical activity during the school day. Schools are funded by local and state governments, as well as the federal government. During the past 50 years, local and state governments have each provided about 45 percent of school funding, with the federal government providing about 10 percent. Considerable variation exists, however, among states and school districts in per-pupil expenditures for elementary and secondary education and in the sources of the funds.
In the 2008-2009 school year, per-pupil expenditures ranged from $6,612 in Utah to $19,698 in the District of Columbia (see Figure 2-5). The source of those funds also varied markedly among states. The federal portion of annual expenditures ranged from 4 percent in New Jersey to 16 percent in South Dakota (New America Foundation, 2012). The proportion of
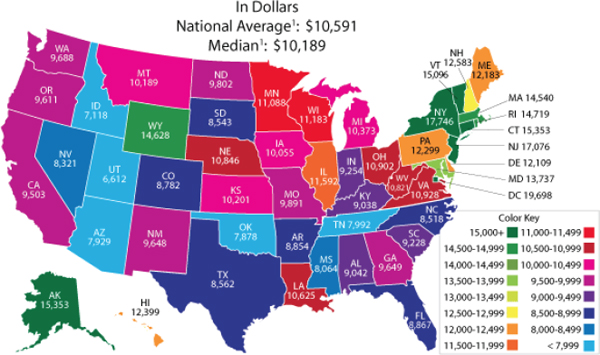
FIGURE 2-5 Per pupil expenditures for public elementary and secondary education in the United States, 2008-2009.
1U.S. estimates are for the 50 states and the District of Columbia.
NOTE: The prekindergarten student membership was imputed for some states, affecting the total student count and calculation of per pupil expenditures. Some values were affected by redistribution of reported expenditure values to correct for missing data items and/or to distribute state direct support expenditures.
SOURCE: U.S. Department of Education, 2009.
state funding, mainly from income and sales taxes, ranged from 86 percent in Vermont to 28 percent in Illinois; local funding, mainly from property taxes, ranged from 60 percent in Nevada to 3 percent in Hawaii.
Substantial within-state variation in per-pupil expenditures also exists. A general assumption is that the quality of education is directly linked to the quantity of funding. However, different systems have different levels of efficiency, and living costs and workforce salaries vary among and within states. In addition, educating children from low-income homes, those with disabilities, or those for whom English is a second language costs more. Various methods have been proposed for comparing funding levels among different school districts, including simple dollar-to-dollar comparisons; cost-of-living adjustments; and “level-of-effort” adjustments, such as proportion of total taxable state and local resources or state per capita gross domestic product (Epstein, 2011).
While the best way to measure and resolve differences in educational opportunities among and within states is uncertain, it is clear that substantial differences exist. Children and adolescents from low-income families are more likely to live in low-income school districts and have fewer resources for public education. It appears likely that fewer resources for education systems result in fewer opportunities for school-related physical activity. As noted above, however, information about the differences in physical activity behaviors among different racial/ethnic and socioeconomic groups is sparse and inconsistent.
Sedentary or Light-Intensity Physical Activity
Recent evidence indicates that light-intensity physical activity, although not likely a substitute for vigorous- or moderate-intensity physical activity, is beneficial to health. Research has focused on the detrimental health impact of sedentary-intensity physical activity, usually sitting or watching television, but the evidence can just as well be described as showing benefits from light-intensity physical activity (see Box 2-4). The relative merits of different levels and combinations of physical activity intensities are being investigated and discussed, but the lower end of the spectrum of rate of energy expenditure is now receiving attention previously reserved for the higher end.
An important aspect of sedentary-intensity physical activity is the large portion of waking hours it fills. Assuming about 15 hours per day of wakefulness, sedentary and light-intensity physical activities fill 80 percent of waking hours for youth who spend 3 hours doing vigorous- or moderate-intensity physical activities (see Figure 2-6). For youth just meeting the 60-minute daily recommendation for the latter activities, the former would fill 93 percent of the day. For the majority of youth not meeting the
BOX 2-4
Recognizing the Value of Light-Intensity Physical Activity
Thirty to 40 years ago, only vigorous physical activity was thought to provide reductions in disease risk. By the early 1990s, however, it was clear that moderate-intensity physical activities were healthful, too. The joint Centers for Disease Control and Prevention (CDC) and American College of Sports Medicine (ACSM) recommendations of 1995 formalized acceptance of the health benefits of moderate-intensity physical activity (Pate et al., 1995). Recognition that the benefits of regular physical activity did not require the effort, commitment, and skill of an athlete solidified the public health value of physical activity and has guided epidemiologic, intervention, and clinical research ever since. That outcome has been good. It led, however, to a rigid categorization of physical activity into the good (vigorous- or moderate-intensity) and the bad (sedentary or light-intensity). In some scientific reports and even in official documents (PAGAC, 2008), “physical activity” has been used to mean vigorous- or moderate-intensity physical activity. This usage has become common, making it difficult for many to accept emerging evidence for the health benefits of light-intensity physical activity.
Recent research among adults indicates that replacing sedentary activities with light-intensity physical activity while holding the volume of vigorous- or moderate-intensity physical activity constant provides health benefits (Hu et al., 2003; Healy et al., 2008a,b; Katzmarzyk et al., 2009; Wijndaele et al., 2010, 2011; Grøntved and Hu, 2011; Matthews et al., 2012). Data from a National Institutes of Health (NIH) and AARP study of more than 200,000 adults demonstrate that light-intensity physical activity augments the benefits of more intense physical activity (Matthews et al., 2012). At every volume of vigorous- or moderate-intensity physical activity, the risk of cardiovascular mortality increases as the volume of sedentary activity, assessed as hours of watching television, increases (see the figure on the next page). Worth noting is the essentially equivalent risk among those who do the most vigorous- or moderate-intensity physical activity and the most television watching and those who do no vigorous- or moderate-intensity physical activity and the least television watching (see the arrows in the figure).
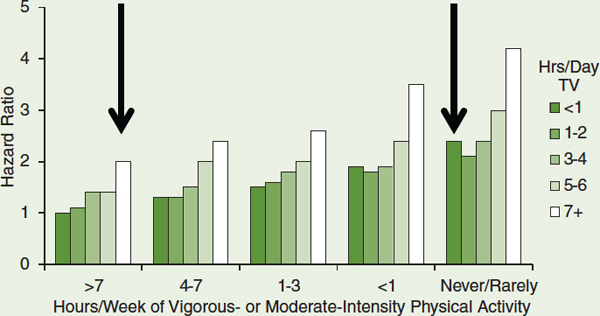
Cardiovascular mortality by hours per week of vigorous- or moderate-intensity physical activity and hours per day of television viewing.
SOURCE: Matthews et al., 2012. Reprinted with permission.
The health impact of sedentary-intensity physical activity among children and adolescents is likely the same. A qualitative review of 232 studies found a dose-response relationship between more sedentary behavior and unfavorable health outcomes, including unfavorable body composition, decreased fitness, lower scores for self-esteem and prosocial behavior, and decreased academic achievement (Tremblay et al.,
current recommendation for vigorous- or moderate-intensity physical activity, nearly the whole day comprises sedentary and light-intensity physical activities (Treuth et al., 2012).
Various suggestions have been made about what aspects of youth’s sedentary physical activity should be avoided and monitored, including limiting television viewing to less than 2 hours per day, limiting television viewing to less than 3 hours per day, limiting computer use to less than 3 hours per day, and limiting total media time to less than 2 hours per day (see, e.g., the Healthy People 2020 objectives [HealthyPeople.gov, 2012]).
Not surprisingly, surveys and studies of sedentary behavior among children and adolescents have used various methods of data collection
2011). Cohort studies among youth that have controlled for vigorous- or moderate-intensity physical activity have yet to demonstrate a relationship between reductions in sedentary activity (which is the same as increases in light-intensity activity) and health or risk factor outcomes (Carson and Janssen, 2011; Ekelund et al., 2012).
The implications of these findings for behavioral recommendations regarding beneficial physical activity are still under discussion. Sedentary activities fill about half the waking hours of children and adolescents (probably relatively less for children and more for adolescents). Sedentary and light-intensity activities together fill 80-95 percent of waking hours (see Figure 2-6). More remains to be learned about the differences in health improvement, academic performance, and classroom behavior engendered by different intensities of physical activity. It is clear that the physiologic effects differ for different intensities. Higher-intensity activities, for example, provide greater cardiovascular fitness and lower cardiovascular mortality risk at all volumes of sedentary activity. Most likely, different intensities provide different benefits. The current consensus is that children and adolescents need some vigorous activity daily for maximum current and future health. Light-intensity physical activity can now be viewed as a healthy shift away from sedentary physical activity as well. Higher rates of energy expenditure are preferred over lower rates across the full range of intensities. The behavioral differences between sedentary-intensity and vigorous- or moderate-intensity physical activities are considerable, and interventions to discourage the former and promote the latter can be expected to be quite different.
(e.g., self-report, accelerometer, proxy), have assessed different aspects of sedentary-intensity physical activity (e.g., total sedentary time, watching television for more than 2 or 3 hours), and have reported the data in different formats (e.g., percentage meeting a specified requirement, mean minutes of sedentary physical activity). Taken together, the results of these surveys and studies indicate that children and adolescents spend a great deal of time in activities requiring very low energy expenditure. The results also indicate that girls are more likely than boys and older adolescents are more likely than children to engage in these low-energy activities, although the differences are generally smaller than for vigorous- or moderate-intensity physical activity.
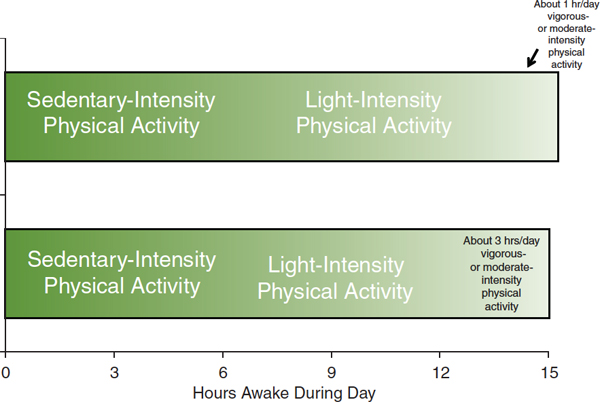
FIGURE 2-6 Approximate number of hours spent during the day at different levels of energy expenditure.
SOURCE: Treuth et al., 2012.
Data from the YRBS and the NHANES are the most frequently cited. Based on accelerometer-assessed physical activity, youth aged 6-19 engage in sedentary physical activity 6-8 hours per day (Matthews et al., 2008) (see Figure 2-7). Figure 2-7 also provides estimates of the average time per day spent using different types of media (TVB, 2012). Reports from the YRBS suggest that about one-third of both middle and high school students report watching television for at least 3 hours per day. In response to a different question, those in this age group (not necessarily the same students) report using a computer for at least 3 hours per day (CDC, 2012b). Other reports (Anderson et al., 2008; Sisson et al., 2009; Wright et al., 2009) and a review (Pate et al., 2011) are available. Data from two reasonably comparable studies demonstrate the reduction in vigorous- or moderate-intensity physical activity and the rise in sedentary and light-intensity activity as girls grow from age 5 to 8 to 12 (Janz et al., 2005; Pate et al., 2006b) (see Figure 2-8).
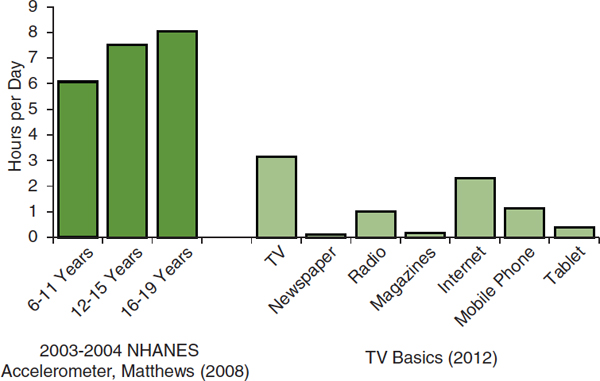
FIGURE 2-7 Hours per day spent in sedentary activity by age group, ages 6-19, and hours per day using different media sources, ages 13-17.
NOTE: NHANES = National Health and Nutrition Examination Survey.
SOURCES: Matthews et al., 2008; TVB, 2012.
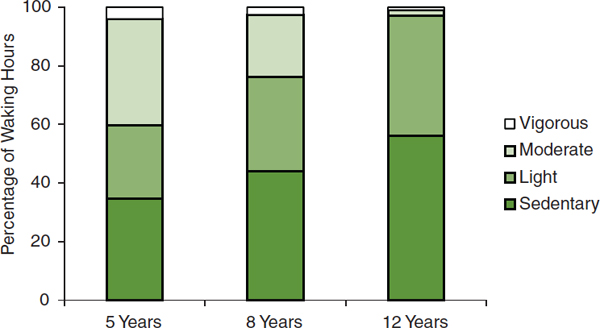
FIGURE 2-8 Percentage of waking hours spent in sedentary, light, moderate, and vigorous physical activity by girls aged 5 and 8 (all from Iowa) and aged 12 (from Arizona; California; Louisiana; Maryland; Minnesota; South Carolina; and Washington, DC).
SOURCES: Janz et al., 2005; Pate et al., 2006b.
Vigorous- or Moderate-Intensity Physical Activity During the School Day
In the United States, elementary and secondary school students spend 180 days every year at school. On those days, about 6.5 hours, or about 40 percent of their waking hours, make up the official school day. Including time spent going to and from school and in school-related after-school activities, students spend half or more of the available hours of every school day at school or going to and from school. Given the large proportion of total waking hours spent at school and in school-related activities, remarkably little is known about students’ physical activity behaviors during school hours and during school-related after-school activities.
A recent analysis of the potential impact of select school-based policies indicates that the current dose of vigorous- or moderate-intensity physical activity at school could be substantially increased (Bassett et al., 2013; see Figure 2-9; see also Chapter 7):
• Compared with no physical education, a usual physical education class adds about 23 minutes of vigorous- or moderate-intensity physical activity to a student’s day.
• Using a standardized high-quality physical education program can add another 5 minutes. High-quality or enhanced physical education
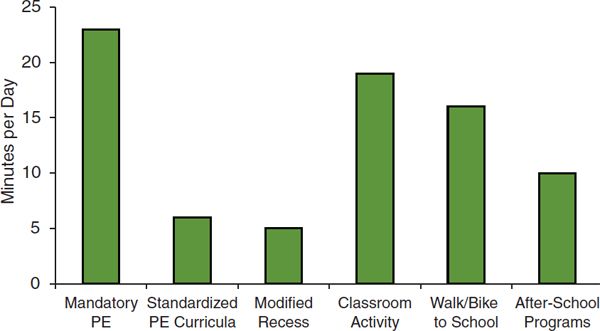
FIGURE 2-9 Minutes per day of vigorous- or moderate-intensity physical activity gained by implementing school-based policies.
NOTE: PE = physical education.
SOURCE: Bassett et al., 2013.
programs strive, among other things, to devote at least 50 percent of physical education time to vigorous- or moderate-intensity physical activity.
• Programs that enable and encourage more vigorous- or moderate-intensity physical activity during recess by providing age-appropriate equipment, blacktop games, and/or adult encouragement and supervision can add another 5 minutes.
• Inserting vigorous- or moderate-intensity physical activity into the classroom by incorporating physical activity into the lesson or by providing specific activity breaks can add about 19 minutes per day above the usual time.
• Walking or biking to school compared with being driven can add about 16 minutes of vigorous- or moderate-intensity physical activity to the school day.
• After-school activity programs can add another 10 minutes of vigorous- or moderate-intensity physical activity per school day.
Despite evidence that policies and programs can increase vigorous-or moderate-intensity physical activity among children and adolescents on school days, only rough estimates are available, at best, of students’ baseline physical activity behaviors at school and during school-related activities. Therefore, only rough estimates can be made of the volume of vigorous- or moderate-intensity physical activity that is being and could be achieved.
Physical Education
Children in elementary and middle school spend about 10-40 percent of their time in physical education classes engaged in vigorous- or moderate-intensity physical activity (Simons-Morton et al., 1993, 1994; McKenzie et al., 1996; Sallis et al., 1997; Belsky et al., 2003; McKenzie et al., 2006). On average they have two physical education class periods per week, each for about 30 minutes (Belsky et al., 2003). Assuming that 35 percent of physical education time is spent in vigorous- or moderate-intensity physical activity, children spend an average of 4 minutes per school day doing vigorous- or moderate-intensity physical activity in physical education classes (see Table 2-1). If elementary school students had 30 minutes of physical education daily (150 minutes per week) and middle school students had 45 minutes of physical education daily (225 minutes per week), the estimated number of minutes per day spent doing vigorous-or moderate-intensity physical activity during physical
TABLE 2-1 Estimated Current and Potential Minutes of Vigorous-or Moderate-Intensity Physical Activity on School Days for Physical Education, Classroom Physical Activity, Recess, Total School Hours, Active Transport, and After-School Sports and Activity Programs for Elementary, Middle, and High School Students
| Physical Education | Estimated Current Minutes | If Daily Physical Education (min) | If Enhanced Daily Physical Education (min) |
| Elementary | 4 | 11 | 15 |
| Middle | 4 | 16 | 23 |
| High | 4 | 16 | 23 |
| Classroom Physical Activity | Estimated Current Minutes | If Enhanced Classroom Activity (min) | |
| Elementary | ? | ≥19 | |
| Middle | ? | ≥19 | |
| High | ? | ≥19 | |
| Recess | Estimated Current Minutes | If Enhanced Recess (min) | |
| Elementary | 9 | 14 | |
| Middle | 9 | 14 | |
| High | Not applicable | Not applicable | |
| Total School Hours | Estimated Current Minutes | If Daily Physical Education (min) | If Enhanced Daily Physical Education, Classroom Activity, and Recess (min) |
| Elementary | ≥15 | ≥21 | ≥49 |
| Middle | ≥15 | ≥26 | ≥57 |
| High | ≥ 5 | ≥21 | ≥42 |
| Active Transport (walking/biking) | Estimated Current Minutes | If Proportion of Students using Active Transport Doubled (min) | |
| Elementary | 2 | 4 | |
| Middle | 2 | 4 | |
| High | 1 | 3 | |
| After-School Activity Programs | Estimated Current Minutes | If All Students Participated (min) | |
| Elementary | ? | ≥10 | |
| Middle | ? | ≥10 | |
| High | ? | ≥10 | |
SOURCES: Simons-Morton et al., 1993, 1994; McKenzie et al., 1996, 2006; Sallis et al., 1997; Belsky et al., 2003; Ridgers et al., 2005; Delva et al., 2006; Tudor-Locke et al., 2006; Lee et al., 2007; Fairclough et al., 2012; Gauthier et al., 2012; Rush et al., 2012; Bassett et al., 2013.
education would increase to 11 minutes and 16 minutes, respectively. If the proportion of time in vigorous- or moderate-intensity physical activity during physical education were increased to 50 percent through the use of standardized high-quality physical education programs, the average time per day would increase to 15 minutes and 23 minutes for elementary and middle school students, respectively. High school students also average 2 days per week of physical education classes (Delva et al., 2006). If the proportion of time they spent in vigorous- or moderate-intensity physical activity during physical education were assumed to be similar to that for primary school students, they would average 4 minutes per day currently, 16 minutes per day if they attended the classes daily, and 23 minutes per day if the classes were both daily and of high quality (see Table 2-1). These estimates are a bit lower than those in a recent analysis (Bassett et al., 2013).
Classroom Physical Activity
Information is insufficient with which to estimate the amount of vigorous- or moderate-intensity physical activity in which an average student engages during usual instructional classroom time. As noted earlier, it is estimated that classroom physical activity could add 19 minutes of such activity to every school day (Bassett et al., 2013), perhaps at the primary and secondary school levels (see Table 2-1).
Recess
An estimated 97 percent of primary schools have regularly scheduled recess for about 30 minutes per day (Lee et al., 2007), and children spend roughly 30 percent of their time at recess doing vigorous- or moderate-intensity physical activity (Ridgers et al., 2005), for an estimated average time per day in vigorous- or moderate-intensity physical activity during recess of 9 minutes. As noted, enhanced-quality recess (e.g., providing age-appropriate equipment, blacktop games, adult encouragement and supervision) could add an estimated 5 minutes (Bassett et al., 2013), for a total of 14 minutes per day (see Table 2-1).
Total During School Hours
The committee found few estimates of total vigorous- or moderate-intensity physical activity or step counts during school hours. The estimates it did find are from a limited number of schools and only one in the United States (Tudor-Locke et al., 2006; Fairclough et al., 2012; Gauthier et al., 2012; Rush et al., 2012). Together, these estimates suggest that about 40 percent of the usual volume of physical activity takes place during school hours, but no estimate of the total energy expenditure or time in vigorous- or moderate-intensity physical activity was available. The estimates in Table 2-1 suggest that primary school students currently spend at
least 15 minutes per school day and high school students at least 5 minutes per school day engaged in vigorous- or moderate-intensity physical activity during school hours. With high-quality daily physical education, enhanced-quality recess, and vigorous- or moderate-intensity physical activity inserted into usual classroom activities, the estimated minutes per school day would be at least 49, 57, and 42 minutes for elementary, middle, and high school students, respectively (see Table 2-1). These totals do not include vigorous-or moderate-intensity physical activity that might accrue during other parts of the school day, such as during the lunch break, or for the upper grades movement from one classroom to another.
Active Transport
Students who walk or bike to school average 16 minutes per day of vigorous- or moderate-intensity physical activity during transit (Bassett et al., 2013). Currently, approximately 13 percent of primary school students, 11 percent of middle school students, and 8 percent of high school students usually walk or bike to school (McDonald, 2007; McDonald et al., 2011). Thus, the average minutes per day of vigorous- or moderate-intensity physical activity during active transit for all students is 2 minutes for elementary and middle school students and 1 minute for high school students. Because many students live too far from school to be able to walk or bike (Falb et al., 2007; McDonald, 2007; McDonald et al., 2011), a doubling of the current prevalence of students using active transport is perhaps as much as could be expected without the creation of numerous smaller schools nearer children’s homes or major changes in school busing practices. The average number of minutes for all students would then increase to 4 minutes per day for elementary and middle school students and 3 minutes per day for high school students. Of course, for those students who can walk or bike to school, active transport provides the full 16 minutes of vigorous- or moderate-intensity physical activity.
After-School Interscholastic and Intramural Sports, Physical Activity Clubs, and Other After-School Programs
Despite the growing popularity of these after-school activities, no good estimates of the number of participants exist. As noted earlier, after-school activity programs for elementary and middle school students are estimated to add 10 minutes per day of vigorous- or moderate-intensity physical activity (Bassett et al., 2013).
TRENDS IN PHYSICAL ACTIVITY BEHAVIORS AMONG YOUTH
This section reviews trends in physical activity behaviors among youth, examining in turn vigorous- or moderate-intensity activity, sedentary and light-intensity activity, and physical activity not necessarily related to school.
Vigorous- or Moderate-Intensity Physical Activity
Although estimates of children and adolescents currently achieving the recommended volume of vigorous- or moderate-intensity physical activity vary depending on how the data were collected, it is clear that few children are sufficiently physically active. An important question is whether the current status of physical activity among youth is an improvement, a worsening, or no different relative to previous years. If the situation is improving (i.e., children have been becoming more active), no changes or new efforts may be warranted; if the situation is stable or worsening, actions are needed. Few data sources provide clear and convincing evidence on trends in children’s level of physical activity, but taken together the evidence is persuasive that children and adolescents in the United States have become increasingly less physically active over the past 40-50 years.
The YRBS provides self-reported information on physical activity among high school students for 1993-2011. Although the data span 20 years, trends in vigorous- or moderate-intensity physical activity are obscured because the survey questions have been modified over time to align with changes in the recommended volume of physical activity for youth (annual surveillance reports from CDC’s website for 1995, 1997, 1999, 2001, 2003, 2005, 2007, 2009, and 2011) (see Figure 2-10 and Box 2-5). The largest change is an increase from 70 percent in 1995 to 84 percent in 2005 in the percentage of students who participate in physical education and who report averaging more than 20 minutes per class exercising or playing sports. In 2011 there was a sharp increase over 2009 in the proportion of students reporting at least 60 minutes of vigorous- or moderate-intensity physical activity on at least 5 days in the preceding week (37 percent to 50 percent) and a corresponding decline in the number reporting that much activity on no days of the preceding week (23 percent to 14 percent) (see Figure 2-10). These sharp changes are thought to be an artifact arising from a shift in the format of the questionnaire such that students had fewer opportunities to describe the types and amounts of their physical activity.
A clear example of a decline in physical activity among youth is the decrease in the proportion of schoolchildren walking or bicycling to school. Between 1969 and 2001, this proportion dropped from 42 percent to
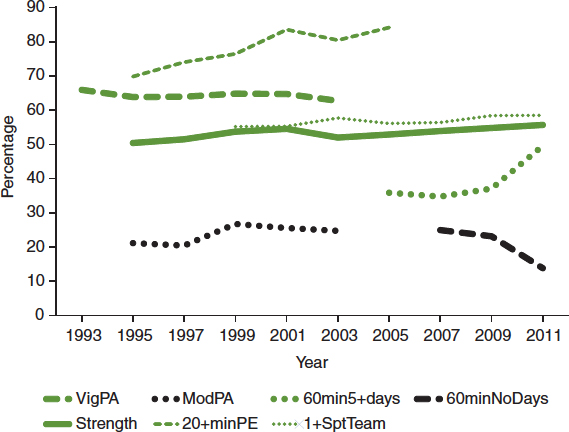
FIGURE 2-10 Percentage of high school students meeting physical activity recommendations, doing strength training, playing on one or more sports teams, and engaging in 20 minutes or more of vigorous- or moderate-intensity physical activity during physical education.
NOTES: VigPA = activities that caused sweating and hard breathing for at least 20 minutes on at least 3 of the 7 preceding days; ModPA = walked or biked for at least 30 minutes on at least 5 of the 7 preceding days; 60min5+days = physical activity that caused increased heart rate and hard breathing for a total of at least 60 minutes on at least 5 of the 7 preceding days; 60minNoDays = physical activity that caused increased heart rate and hard breathing for a total of at least 60 minutes on none of the 7 preceding days; Strength = activities such as push-ups, sit-ups, or weight lifting on at least 3 of the 7 preceding days; 20+minPE = among students who attended physical education classes, exercised, or played sports for more than 20 minutes during an average physical education class; 1+SptTeam = played on at least one sports team run by the student’s school or community groups during the 12 months before the survey.
SOURCE: CDC, 2012a.
13 percent; among children living within 1 mile of their school, it dropped from 86 percent to 50 percent (McDonald, 2007) (see Figure 2-11).
Sedentary or Light-Intensity Physical Activity
The above-noted evidence accumulated during the past decade indicating the health benefits of light-intensity physical activity compared with sedentary-intensity activities has spurred interest in monitoring trends in
BOX 2-5
Progression of the Recommended Dose of Physical Activity for Youth
The dose of physical activity recommended for youth has changed during the past 30 years (see the table below). Initially, with little information specific to youth available, the recommended dose for adults, children, and adolescents was the same. As knowledge accumulated and the special needs of children and adolescents were taken into account, the dose recommended for the latter age groups differed from that recommended for adults.
Changes Over Time in the Recommended Volume of Physical Activity for Children and Adolescents
| Year | Recommendation | Comment |
| 1985 | Vigorous physical activity for 20+ min/day on 3+ days/week | Same as recommendation for adults; activity should be continuous |
| 1995 | Vigorous physical activity for 20+ min/day on 3+ days/week or moderate physical activity for 30+ min/day on 5+ days/week | Same as recommendation for adults; activity can be accumulated during the day in 8- to 10-min bouts |
| 2005 | 60+ min/day of mainly vigorous- or moderate-intensity physical activity | Recommendation specifically for children and adolescents; activity should be varied, developmentally appropriate, and enjoyable |
Dose is the amount, or volume, of physical activity performed (see Box 2-2). For aerobic activities, dose is determined by the frequency, duration, and intensity of the activity. During the late 1970s and 1980s, the dose recommended for adults and children was 20 min or more of continuous vigorous activity on 3 or more days per week (HHS, 1984; ACSM, 1988). This recommendation, based largely on the dose required
for short-term training response in young adults (Simons-Morton et al., 1988), assumed that benefits were derived only from vigorous physical activity. By the mid-1990s, consensus had been reached that health benefits accrued from moderate-intensity physical activity as well, and the recommended dose was expanded to include either the dose of vigorous physical activity previously recommended or a dose of 30 min or more per day of moderate-intensity physical activity on 5 or more days per week (Pate et al., 1995; HHS, 1996). The dose of vigorous-intensity activity and the dose of moderate-intensity activity could be accumulated in segments as short as 8-10 min in length.
In 2005 a panel convened by the Centers for Disease Control and Prevention specifically to consider the physical activity needs of children and adolescents (aged 6-18) recommended that “school-aged youth should participate daily in 60 minutes or more of vigorous- or moderate-intensity physical activity that is developmentally appropriate, enjoyable, and involves a variety of activities” (Strong et al., 2005, p. 736). The 2008 report of the Physical Activity Guidelines Advisory Committee, noting a direct relationship between the volume of physical activity in youth and cardiorespiratory fitness, muscular strength, less adiposity among youth of normal weight, cardiovascular and metabolic health, bone mineral content and density, and several mental health outcomes, reiterated the value of 60 minutes or more of vigorous- or moderate-intensity physical activity per day for important health benefits (PAGAC, 2008). The committee further commented that weekly activity should include some vigorous activity on at least 3 days and some activities to strengthen muscles and bones.
these two types of physical activity. One of the difficulties has been deciding which sedentary behaviors to monitor. Use of accelerometers in recent years has enabled researchers to measure total sedentary time, but long-term trends have depended on self-reported data, primarily regarding television viewing time and more recently also time spent watching videos, playing video games, and using a computer. Television viewing time has been monitored, often for business reasons, for a number of years. The average number of hours children and teens spent watching television daily declined
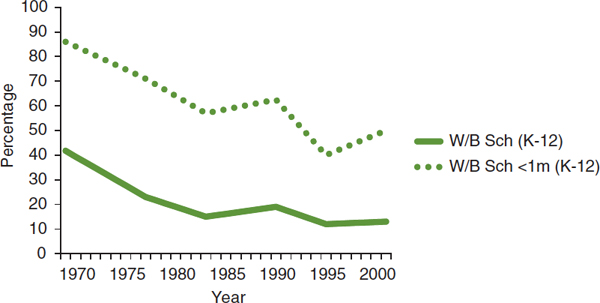
FIGURE 2-11 Percentage of students walking or bicycling to school.
SOURCE: McDonald, 2007.
slightly during the early 1990s, from about 3.3 hours per day to about 3 hours per day, and rose during the 2000s to about 3.4 hours per day (see Figure 2-12) (TVB, 2012). If television use includes DVDs, prerecorded shows, or television shows on other platforms (e.g., Internet, cell phone), then total television use has increased since the late 1990s, as has the use of computers for purposes other than schoolwork (Rideout et al., 2010). The prevalence of high school students reporting on the YRBS that they watched at least 3 hours per day of television declined from 38 percent in 2003 to 32 percent in 2011, while the prevalence of using computers for at least 3 hours per day increased from 21 percent in 2005 to 31 percent in 2011 (CDC, 2012a).
Physical Activity Not Necessarily Related to School
As noted, indirect and inferential evidence from several different types of research suggests that children and adolescents today are less physically active than previous generations. For example, comparisons with traditional cultures indicate a decline in routine physical activity. Old Order Amish and Old Order Mennonite cultures eschew modern conveniences. Comparisons of accelerometer-measured routine physical activity among children from traditional Amish and Mennonite cultures and samples of U.S. and Canadian children indicate that the former children are more physically active (Tremblay et al., 2005; Esliger et al., 2010; Hairston et al., 2012). Children from Maryland’s Eastern Shore spent 53 minutes per day less in vigorous- or moderate-intensity physical activity and 34 minutes per day less in light-intensity physical activity than the Old Order Amish children
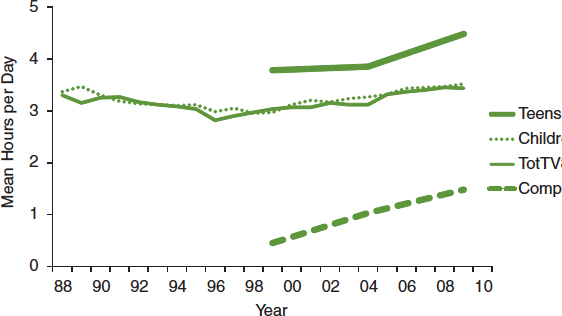
FIGURE 2-12 Hours per day spent watching television by age group, 1998-2009, and hours per day spent watching television and using computers for youth aged 8-18.
NOTES: TotTV = total television content, which includes watching not only standard television programs but also prerecorded shows, DVDs, and television content on other platforms (e.g., Internet, cell phone, iPod); Comp = does not include time spent using a computer for schoolwork.
SOURCES: Rideout et al., 2010; TVB, 2012.
with whom they were compared (Hairston et al., 2012). This translates to 87 minutes per day of sedentary physical activity.
Declines in cardiorespiratory fitness among children around the world have been documented. American researchers usually have preferred not to compare current measures of cardiorespiratory fitness among American children with results of surveys from previous years because of differing measurement methods (Pate et al., 2006a), although one review has suggested declines since the 1960s (Malina, 2007). Assessments have been performed, however, in other countries using more consistent measurement techniques, and they indicate a global decline in cardiorespiratory fitness among youth (Santtila et al., 2006; Tomkinson and Olds, 2007; Albon et al., 2010; Boddy et al., 2012; Tomkinson et al., 2012) or, in one case, a decline in physical activity behaviors (Salmon et al., 2005) (see Table 2-2). A review of evidence from around the world found that participation by youth in “active transport, physical education, and organized sports is declining in many countries” (Dollman et al., 2005, p. 892). The authors also comment that “young people would like to be active but are constrained by external factors such as school policy or curricula, parental rules in relation to safety and convenience, and physical environmental factors” (p. 892).
TABLE 2-2 Declines in Physical Fitness Among Children Around the World
| Source | Location | Time Period | Age Range | Method of Assessment | Findings |
| Boddy et al. (2012) | United Kingdom | 1998-2010 | 9-10.9 years (cohort) | 20-m shuttle run | 1.8% decline per year |
| Tomkinson et al. (2012) | Asia (China, Japan, S. Korea, Singapore) | 1964-2009 | 9-17 years | Long-distance running time | 16% decline |
| Santtila et al. (2006) | Finland | 1975-2004 | 20 years | 12-min run | 8% decline |
| Albon et al. (2010) | New Zealand | 1991-2003 | 10-14 years | 550-m run | 1.6% decline per year |
| Salmon et al. (2005) | Australia | 1985-2001 | 9-13 years | Walking trips to school Taking physical education classes Participating in school sports | 17% decline 28% decline 11% increase |
| Tomkinson and Olds (2007) | 27 countries (varying time periods and age ranges) | 1958-2003 | 6-19 years | Various | 0.36% decline per year |
Finally, several studies provide empirical evidence for a gradual decline in physical activity among adults in occupational, transportation, and household tasks (Lanningham-Foster et al., 2003; Brownson et al., 2005; Church et al., 2011; Archer et al., 2013). Of interest, there is little evidence to suggest either a decrease or an increase in adult leisure-time physical activity. Although the evidence in these reports pertains to adult behavior, there can be little doubt that the declines in physical activity due to mechanization, technology, and social norms apply to children and adolescents as well.
STATE AND LOCAL POLICIES ON SCHOOL-BASED PHYSICAL ACTIVITY
As discussed in Chapter 1, schools are an important focal point for efforts to increase physical activity among children and adolescents. Accordingly, the committee examined the current state of knowledge on the
status of and trends in public policies regarding school-based physical activity. Public policies are an effective tool for influencing behavioral changes at the population level as opposed to the individual level, and have been shown to have significant long-term effects on population health and health behaviors. Examples include fluoridating drinking water and requiring the use of seat belts in motor vehicles (CDC, 1999). At present, there are no federal mandates on physical activity and physical education in schools. Therefore, this section presents the committee’s findings on state policies, including both statutory (legislative) and administrative (regulatory) laws, and school district wellness policies, as well as their implementation and effectiveness.
National surveillance systems contain quantitative data on the strength and comprehensiveness of these policies, developed using systematic and reliable coding systems. These data are useful for tracking both progress and changes in codified public policies of time and across jurisdictions.
Table 2-3 lists available sources of information on policies regarding school-based physical activity. The School Health Policies and Practices Study (SHPPS; Burgeson et al., 2001; Lee et al., 2007) and the Shape of the Nation Report (NASPE and AHA, 2010, 2012) provide relevant policy information collected through self-report surveys; the National Association of State Boards of Education’s (NASBE’s) State School Health Policy Database supplements the SHPPS with additional information on the existence of relevant state laws and policies; and the National Cancer Institute’s Classification of Laws Associated with School Students (C.L.A.S.S.; Mâsse et al., 2007) and the Robert Wood Johnson Foundation–supported Bridging the Gap program (www.bridgingthegapresearch.org) compile state laws and then apply scoring systems to rank the laws in comparison with national standards and recommendations. Bridging the Gap also conducts the largest ongoing nationwide evaluation of the congressionally mandated school district wellness policies (Bridging the Gap, 2013b). The data on district wellness policies are coded using the same schemes as those used for state laws, thus enabling multilevel evaluations of the impact of district policies and state laws on school practices and student behaviors.
The SHPPS compiled information collected through self-report surveys for use in assessing school-based physical education and physical activity policies and practices at the state, district, school, and classroom levels. State-level data were collected from education agencies in all 50 states and the District of Columbia. District and school-level data were collected from nationally representative samples of public school districts and public and private elementary and secondary schools. Classroom-level data were collected from teachers of randomly selected classes.
The Shape of the Nation survey collects the following information on physical education: (1) time requirements; (2) high school graduation requirements; (3) exemptions/waivers and substitutions; (4) physical
TABLE 2-3 Data Sources for Policies Related to School-Based Physical Activity
| Data Source | Time Period | Method of Assessment | Levels |
| School Health Policies and Practices Study | 2000, 2006 | Self-report surveys, separate respondents for each level | State (census), district, school, classroom (nationally representative sample) |
| Shape of the Nation | Every few years from 1987 to 2012 | Self-report surveys, state physical education coordinators | State (census) |
| National Association of State Boards of Education’s State School Health Policy Database | Updated regularly since 1998 | Collection of laws and policies | State (census) |
| C.L.A.S.S. | 2003-2008, biennially starting in 2010 | Coded (scored) state laws | State (census) |
| Bridging the Gap | 2006-2012 | Coded (scored) state laws | State (census), district (nationally representative sample) |
activity; (5) local school wellness policy; (6) standards, curriculum, and instruction; (7) class size; (8) student assessment and program accountability; (9) body mass index (BMI) collection; (10) physical education teacher certification/licensure; (11) national board certification in physical education; and (12) state physical education coordinator requirements (NASPE and AHA, 2012).
The NASBE State School Health Policy Database, begun in 1998 and continuously updated (http://www.nasbe.org/healthy_schools/hs/index.php), provides a summary description of the most recent state-level laws, legal codes, rules, regulations, administrative orders, mandates, standards, and resolutions (see Appendix C for a summary table of the laws); it does not provide historical information on laws that were in place prior to 1998.
The C.L.A.S.S. and Bridging the Gap databases vary from the NASBE database by providing scores related to the strength of policies rather than the actual policy language. They also provide historical data by year, which allows for the examination of change in state laws over time. The C.L.A.S.S.
database contains state-level information in such areas as (1) physical education class time, (2) staffing requirements for physical education, (3) physical education curriculum standards, (4) assessment of health-related fitness during physical education, (5) physical activity time requirements outside of physical education, and (6) recess. C.L.A.S.S. uses a 0-4 or 0-5 rating scale, depending on the category, that captures information on the specificity, strength of language, and stringency of a law. Each year’s rating reflects laws in place as of December 31. Bridging the Gap, described in detail below, collects data on both state and school district policies related to physical education and physical activity and applies a 0-3 rating scale. All sources in Table 2-3 contain information on laws for elementary, middle, and high schools. All contain some duplicative information but also other measures that are unique to that source.
Given the overlap in these data sources, the following information on state- and school district-level policies was taken from two sources—one self-reported and the other objectively collected and coded. Tables 2-4 through 2-6 present trend data for 2000-2012 on the prevalence of state-level policies related to school-based physical education and physical activity. Table 2-4 presents information extracted from the SHPPS in 2000 and 2006 (Burgeson et al., 2001; Lee et al., 2007), while Tables 2-5 and 2-6 present information compiled from Bridging the Gap (Chriqui et al., in press). Starting with the 2006-2007 school year, Bridging the Gap has compiled policies for all 50 states and the District of Columbia annually from the state law databases Westlaw and Lexis-Nexis using keyword searches. All policies are coded using a 3-point rating scale, where 0 (none) represents those states with no policy, 1 (weak) represents states with a law that suggests/encourages or imposes a less stringent requirement than the
TABLE 2-4 Prevalence of Policies at the State, School District, and School Levels Related to School-Based Physical Education and Physical Activity, from the School Health Policies and Practices Study (SHPPS)
| 2000 (%) | 2006 (%) | ||
| Physical | States requiring physical education | 78 | 80 |
| Education: | Districts requiring physical education | 83 | 78 |
| Elementary | Schools requiring physical education | (82) | 86 |
| Schools | • 3 days/week, all year, all grades | 25 | 14 |
| • daily, one-half year, all grades | 10 | 5 | |
| • daily, all year, all grades | 8 | 4 | |
| 2000 (%) | 2006 (%) | ||
| Physical | States requiring physical education | 86 | 93 |
| Education: | Districts requiring physical education | 85 | 90 |
| Middle | Schools requiring physical education | (89) | 89 |
| Schools | • 3 days/week, all year, all grades | 18 | 15 |
| • daily, one-half year, all grades | 16 | 15 | |
| • daily, all year, all grades | 6 | 8 |
|
| Physical | States requiring physical education | 82 | 93 |
| Education: | Districts requiring physical education | 89 | 90 |
| High | Schools requiring physical education | (94) | 89 |
| Schools | • 3 days/week, all year, all grades | 7 | 3 |
| • daily, one-half year, all grades | 12 | 7 | |
| • daily, all year, all grades | 6 | 2 |
|
| Physical | States requiring/encouraging following national or state | 84 | 82 |
| Education: | physical education guidelines | ||
| General | Districts requiring/encouraging following national or state | 75 | 81 |
| physical education guidelines | |||
| Schools following national or state physical education guidelines | 81 | 88 | |
| States requiring/encouraging following National | 60 | 76 | |
| Association for Sport and Physical Education (NASPE) guidelines | |||
| Districts requiring/encouraging following NASPE guidelines | 51 | 55 | |
| Schools requiring/encouraging following NASPE guidelines | 67 | 65 | |
| States with state-level physical education coordinator | 69 | 88 | |
| Districts with district-level physical education coordinator | 62 | 69 | |
| Schools with someone to oversee physical education | 86 | 91 |
|
| Recess: | States requiring/recommending regularly scheduled recess | 26 | 37 |
| Elementary | Districts requiring/recommending regularly scheduled recess | 87 | 90 |
| Schools providing regularly scheduled recess | 97 | 97 | |
| If school has recess, number of minutes per week on average | 149 min/ wk | 148 min/ wk |
|
| Active | States supporting/promoting active transport | N/A | 14 |
| Transport | Districts supporting/promoting active transport | N/A | 18 |
| Schools supporting/promoting active transport | N/A | 44 | |
NOTE: N/A = not available.
SOURCES: 2000 data extracted from Burgeson et al., 2001; 2006 data extracted from Lee et al., 2007.
TABLE 2-5 Trends in State Physical Education Policies for Elementary, Middle, and High Schools
| SY 2006-07 (%) | SY 2007-08 (%) | SY 2008-09 (%) | SY 2009-10 (%) | SY 2010-11 (%) | SY 2011-12 (%) | ||
| PE Addressed in State Policya | Elementary | 94 | 96 | 96 | 96 | 98 | 98 |
| Middle | 94 | 96 | 96 | 96 | 98 | 98 | |
| High | 92 | 96 | 98 | 98 | 98 | 98 |
|
| Clear PE Curriculum in All Gradesb | Elementary | 59 | 61 | 61 | 63 | 63 | 63 |
| Middle | 55 | 57 | 59 | 61 | 61 | 61 | |
| High | 41 | 41 | 45 | 47 | 47 | 49 |
|
| Time Requirement of ≥150 minutes/week of PEc | Elementary | 10 | 12 | 10 | 10 | 10 | 10 |
| Time Requirement of ≥225 minutes/week of PEd | Middle | 2 | 2 | 2 | 2 | 2 | 2 |
| High | 2 | 4 | 2 | 2 | 2 | 2 |
|
| PE Promotes a Physically Active Lifestylee | Elementary | 57 | 61 | 67 | 73 | 75 | 73 |
| Middle | 57 | 61 | 67 | 73 | 75 | 73 | |
| High | 57 | 61 | 67 | 73 | 75 | 73 |
|
| PE Competency Assessmentf | Elementary | 55 | 59 | 65 | 71 | 73 | 73 |
| Middle | 55 | 59 | 65 | 71 | 73 | 73 | |
| High | 53 | 57 | 63 | 69 | 71 | 71 |
|
| PE Courses or Credits Required for Graduation and/or Count Toward GPA | High | 73 | 78 | 78 | 78 | 80 | 80 |
| All Students Required to Receive Daily PE | Elementary | 4 | 6 | 6 | 6 | 6 | 6 |
| Middle | 4 | 6 | 6 | 6 | 6 | 6 | |
| High | 2 | 4 | 4 | 4 | 4 | 4 | |
| Teacher-Student Ratio for PE Specific and Required | Elementary | 8 | 8 | 8 | 8 | 10 | 10 |
| Middle | 8 | 8 | 8 | 8 | 10 | 10 | |
| High | 8 | 8 | 8 | 8 | 10 | 10 |
|
| Safe/Adequate PE Equipment and Facilities Specified and Required | Elementary | 2 | 2 | 2 | 2 | 2 | 2 |
| Middle | 4 | 4 | 4 | 4 | 4 | 4 | |
| High | 2 | 2 | 4 | 4 | 4 | 4 |
|
| PE Required to Be Taught by Qualified Instructorsg | Elementary | 14 | 16 | 18 | 20 | 24 | 25 |
| Middle | 16 | 20 | 20 | 22 | 25 | 28 | |
| High | 12 | 16 | 18 | 20 | 24 | 25 |
|
| District Required to Provide Training for PE Instructorsh | Elementary | 2 | 2 | 4 | 4 | 6 | 6 |
| Middle | 2 | 2 | 2 | 2 | 4 | 4 | |
| High | 2 | 2 | 2 | 2 | 4 | 4 |
|
| PE Waivers Prohibitedi | Elementary | 6 | 6 | 8 | 8 | 8 | 8 |
| Middle | 6 | 6 | 6 | 6 | 6 | 6 | |
| High | 6 | 6 | 6 | 6 | 6 | 6 |
|
| School Districts May Apply for Waiver from State-Level | Elementary | N/A | N/A | 2 | 2 | 2 | N/A |
| PE Requirement | Middle | N/A | N/A | 2 | 2 | 2 | N/A |
| High | N/A | N/A | 2 | 2 | 2 | N/A |
|
| Students Required to Participate in an Annual Health | Elementary | 2 | 0 | 0 | 0 | 0 | 4 |
| Assessmentj | Middle | 2 | 0 | 0 | 0 | 0 | 2 |
| High | 2 | 0 | 0 | 0 | 0 | 2 | |
NOTE: GPA = grade point average; N/A = not available; PE = physical education; SY = school year.
aDefinitely addressed; any mention of PE.
bClear that district has a PE curriculum/program for each grade (e.g., policy describes a general PE curriculum/program for “K-12,” “all levels,” or “all students”), or clear that PE program is provided for “K-12,” “all levels,” or “all grades,” and time requirements are mentioned (without using the word “curriculum").
cOr requires schools to follow National Association for Sport and Physical Education (NASPE) standards or the standards of the American Alliance for Health, Physical Education, Recreation and Dance (AAHPERD) (which embeds NASPE).
dOr requires schools to follow NASPE standards or the standards of the AAHPERD.
eRequires PE to teach lifetime activities, or requires schools to follow NASPE standards or the standards of AAHPERD, or focuses on self-assessment through a Fitnessgram® or Activitygram®.
fSpecifies competency assessment: requires a competency assessment or assessment of knowledge, skill, or practice as part of the PE curriculum.
gRequires that PE be taught by a licensed instructor, or requires schools to follow NASPE standards or the standards of the AAHPERD.
hProvision of PE training is required for PE teachers. If PE-specific training is provided for a broader set of staff or teachers, it is assumed that PE teachers are included and will receive training as well.
iProhibits substituting other activities, including physical activities, for PE.
jType of assessment is specified and required, assessment is annual, and a positive approach to communicating results is mentioned.
SOURCE: Bridging the Gap, 2013a. Reprinted with permission.
TABLE 2-6 Trends in State Policies Related to Physical Activity for Elementary, Middle, and High Schools
| SY 2006-07 (%) | SY 2007-08 (%) | SY 2008-09 (%) | SY 2009-10 (%) | SY 2010-11 (%) | SY 2011-12 (%) | ||
| Moderate to Vigorous Physical Activity Addressed but Is Less Than 50% of Time Spent in PEa | Elementary | 16 | 18 | 24 | 25 | 31 | 29 |
| Middle | 12 | 12 | 14 | 14 | 20 | 18 | |
| High | 10 | 10 | 10 | 12 | 18 | 16 |
|
| At Least 50% of Time Spent in PE Must Be Devoted to Moderate to Vigorous Physical Activity | Elementary | 0 | 0 | 0 | 0 | 0 | 0 |
| Middle | 0 | 0 | 0 | 0 | 0 | 0 | |
| High | 0 | 0 | 0 | 0 | 0 | 0 | |
| Physical Activity Goals Specifiedb | Elementary | 35 | 37 | 39 | 41 | 45 | 47 |
| Middle | 27 | 27 | 33 | 35 | 35 | 35 | |
| High | 24 | 24 | 27 | 29 | 29 | 29 | |
| Physical Activity Outside of PE for Every Grade Levelc | Elementary | 16 | 16 | 20 | 22 | 24 | 24 |
| Middle | 10 | 8 | 10 | 12 | 12 | 10 | |
| High | 8 | 6 | 6 | 6 | 6 | 4 | |
| Specific Amount of Time for Required Physical Activity | Elementary | n/a | n/a | 14 | 16 | 18 | 20 |
| Middle | n/a | n/a | 6 | 8 | 8 | 8 | |
| High | n/a | n/a | 2 | 2 | 2 | 2 | |
| Physical Activity Opportunities Provided Throughout the Dayd | Elementary | 2 | 2 | 2 | 2 | 2 | 2 |
| Middle | 2 | 2 | 2 | 2 | 2 | 2 | |
| High | 2 | 2 | 2 | 2 | 2 | 2 | |
| Physical Activity Not to Be Used as Punishmente | Elementary | 4 | 4 | 4 | 4 | 4 | 2 |
| Middle | 4 | 4 | 4 | 4 | 4 | 2 | |
| High | 4 | 4 | 2 | 2 | 2 | 0 | |
| Dail Recess Re uired and S ecified | Elementar | 6 | 6 | 8 | 10 | 12 | 10 |
NOTE: n/a = variable not added until SY 2008-2009; PE = physical education; SY = school year.
aAny of the following: suggested, duration is not specified, or duration is less than 50% of class time.
bIncludes goals for physical activity that are designed to promote student wellness in a manner that the local education agency determines is appropriate.
cClear that each grade will receive physical activity outside of physical education.
dNot including recess. Either of the following is required: regular physical activity throughout the school day or training for teachers in activities that incorporate physical activity throughout the day.
eProhibits using extra or restricted physical activity as a punishment, with exceptions for individualized academic plans or individualized education plans.
SOURCE: Bridging the Gap, 2013a. Reprinted with permission.
national physical activity and physical education recommendations, and 2 (strong) represents states requiring or exceeding the national recommendations. These three tables highlight only the percentage of states that have strong laws in place. The SHPPS does not use the same data coding format as Bridging the Gap; thus it is not possible to compare similar measures directly across these data sources.
Because the SHPPS (see Table 2-4) surveys relevant respondents at multiple levels, results of this survey provide information on changes in policies related to physical education and physical activity at the state, district, and school levels. These data help illustrate how policies are implemented from the state down to the school level. Because schools do not have codified policies, the self-report method of data collection can provide valuable information on the implementation and enforcement of state- and district-level policies, along with a snapshot of how schools at the local level may be implementing programs and practices beyond what they are required to do by law. In a recent study, for example, Nanney and colleagues (2010) used the SHPPS data to construct a summary scale of the number of physical activity–related policies adopted by states. They identified 146 items in the SHPPS related to physical activity and physical education and found that, on average, states had adopted 38 percent of all possible physical activity and physical education policies. However, a disadvantage of self-reported data is that they are subject to human error, such as respondent bias or misinterpretation of the survey questions, which can result in overreporting of the presence of laws, policies, and practices.
Tables 2-5 and 2-6 present annual quantitative data on trends in state policies related to physical education and physical activity, respectively, for elementary, middle, and high schools. In general, these data show that in most instances these policies at the state level have changed little during the past 6 years.
Trends in State Laws Related to Physical Education and Physical Activity
Tables 2-4 and 2-5 show an increase over time in the number of state laws addressing physical education, revealing that by school year (SY) 2011-2012 nearly all states (98 percent) across all grade levels mentioned physical education in a state-level law. However, very few states have a strong law. Only 10, 2, and 2 percent of laws, respectively, that address requirements for elementary, middle, and high schools meet national recommendations for at least 150 minutes (for elementary schools) and at least 225 minutes (for secondary schools) weekly of physical education, and virtually no change occurred in these policies from SY 2006-2007 to SY 2011-2012. Similarly, very little change has occurred across states
during the past 6 years with respect to requiring daily physical education, and most states continue to allow physical education waivers, with the exception of 8, 6, and 6 percent of states, respectively, prohibiting them at the elementary, middle, and high school levels. Some positive changes in state laws have occurred, including steady increases across all grades in the number of states requiring that schools promote a physically active lifestyle and that physical education be taught by qualified instructors. Some slight change even has taken place across all grade levels in the number of states requiring a specific teacher-student ratio for physical education classes.
Currently no states require that at least 50 percent of time spent in physical education be devoted to vigorous- or moderate-intensity physical activity. Some improvement has occurred over the past 6 years in states having a requirement for any percentage of time spent in vigorous- or moderate-intensity physical activity in physical education, with elementary schools seeing the largest increase in such requirements. Further, fewer than one-quarter of all states require physical activity outside of physical education for all grade levels, and only about 1 in 5 states require daily recess at the elementary level. Requirements for physical activity outside of physical education decrease significantly at the middle and high school levels, and recess policies apply only to elementary schools. Finally, there has been a decline in the percentage of states prohibiting the use of physical activity as a punishment. Overall, the above trends reveal significant opportunities to enact and strengthen state-level physical education and physical activity laws.
Trends in States Reporting on Physical Education and Physical Activity Requirements and Fitness Assessments
Implementing laws that require a reporting mechanism is one way to monitor compliance. Table 2-7 shows trends in state and school district policies that address some kind of formal reporting to stakeholders, such as a school board, parents, or the state. The table shows that most states and districts currently do not require formal reporting on physical education and physical activity in schools. Where such a requirement exists, it may include reporting on mandatory minutes or participation rates for physical education and other school-based physical activity. For example, the law might state: “The district will report to the State Board of Education by June 15th (each year) the daily physical education/physical activity for students by school, grade, and class.” Policies may also require reporting of the results of fitness assessments (e.g., Fitnessgram®, Presidential Fitness Test, Activitygram®) to parents, the school board, or the state. The requirement might read: “Students’ health-related fitness reports will be shared with parents/legal guardians at grades 5 and 8 and in high school.”
TABLE 2-7 Trends in States Mandating Reporting on Physical Education and Physical Activity Requirements and Fitness Assessments
| SY 2010-2011 (%) | SY 2011-2012 (%) | ||
| Reporting on PE/PA Requirements Not | Elementary | 86 | 82 |
| Mentioned/No Policy | Middle | 92 | 86 |
| High | 92 | 86 |
|
| Reporting on PE/PA Requirements Suggested/ Required but Vague | Elementary | 4 | 6 |
| Middle | 4 | 8 | |
| High | 4 | 6 |
|
| Districts Required to Report on PE/PA | Elementary | 10 | 12 |
| Requirements | Middle | 4 | 6 |
| High | 4 | 6 |
|
| Reporting on Fitness Assessments Not | Elementary | 96 | 92 |
| Mentioned/No Policy | Middle | 96 | 92 |
| High | 96 | 92 |
|
| Reporting on Fitness Assessments Suggested/ Required but Vague | Elementary | 0 | 0 |
| Middle | 0 | 0 | |
| High | 0 | 0 |
|
| Districts Required to Report on Fitness | Elementary | 4 | 8 |
| Assessments | Middle | 4 | 8 |
| High | 4 | 8 | |
NOTE: Variables not added until SY 2010-2011. PA = physical activity; PE = physical education; SY = school year.
SOURCE: Bridging the Gap, 2013a. Reprinted with permission.
Trends in School District Wellness Policies
In addition to state laws, Bridging the Gap researchers annually collect and code congressionally mandated school district wellness policies, which are required to include physical activity goals. District wellness policies and other relevant school district policy documents (e.g., regulations, curriculum standards) are gathered annually from a nationally representative sample of school districts (N = ~600 school districts/year). Web searches are conducted, and telephone and mail follow-up with districts is used, if necessary, to identify the policies. District-level policies are coded using the same 0, 1, 2 scoring described above for state laws.
Figures 2-13 through 2-16 show that local school districts have been steadily enacting and strengthening the physical education and physical
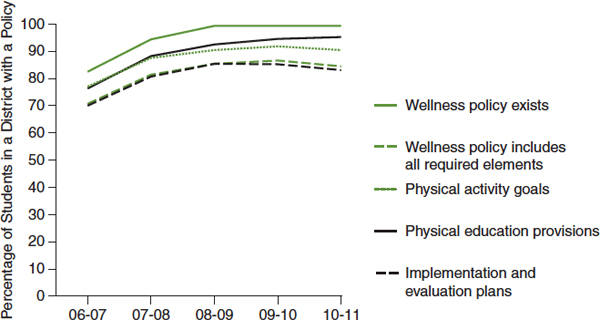
FIGURE 2-13 Progress in adopting district wellness policies and required policy components.
SOURCE: Chriqui et al., 2012.
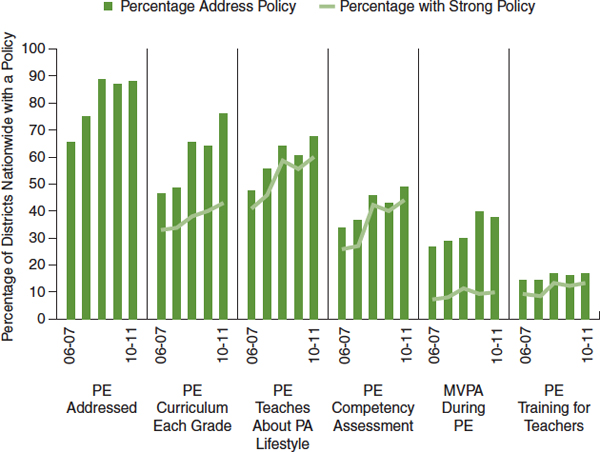
FIGURE 2-14 Selected physical education provisions in district wellness policies, by year.
NOTE: Physical education is not a required element of wellness policies but is commonly addressed.
MVPA = moderate to vigorous physical activity; PA = physical activity; PE = physical education.
SOURCE: Chriqui et al., 2012.
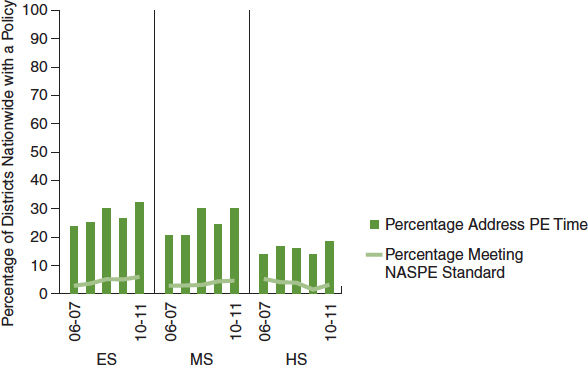
FIGURE 2-15 Provisions on physical education time in district wellness policies, by year and grade level.
NOTE: ES = elementary school; HS = high school; MS = middle school; NASPE = National Association for Sport and Physical Education; PE = physical education.
SOURCE: Chriqui et al., 2012.
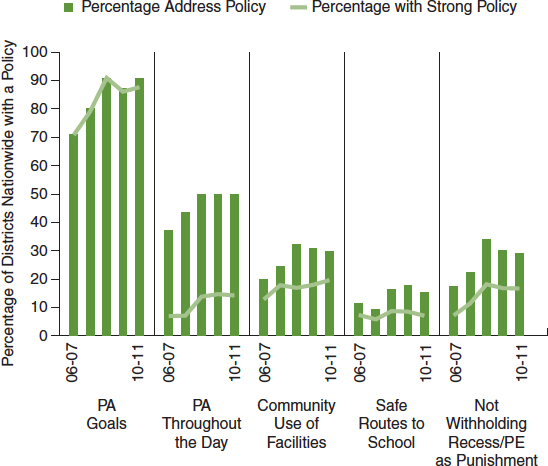
FIGURE 2-16 Selected physical activity provisions in district wellness policies by year.
NOTE: PA = physical activity; PE = physical education.
SOURCE: Chriqui et al., 2012.
activity provisions included in local wellness policies since the policies’ initial required enactment at the beginning of SY 2006-2007. Although addressing physical education is not required for local wellness policies, about 90 percent of students attend school in districts that have this provision across all grade levels.
School districts have steadily increased the number of physical education provisions included in local wellness policies, and districts also are increasingly enacting strong provisions that require and/or are aligned with national recommendations. However, provisions on physical education continue to vary in strength. Consistent with the absence of strong state laws, few districts have implemented strong policies meeting the national standards of at least 150 physical education minutes weekly at the elementary level and at least 225 physical education minutes weekly at the middle and high school levels.
As with physical education provisions, school districts have steadily been increasing the number of other physical activity–related provisions included in wellness policies. However, fewer than 10 percent of districts include language that ensures efforts by local schools to promote safe routes to school, and only one in five districts require that communities be permitted to use school facilities for physical activities outside of school hours and prohibit withholding recess/physical education as a punishment.
Evidence showing that strong policies are associated with increased physical education and/or physical activity during the school day is growing. For example, studies conducted by Barroso and colleagues (2009), Evenson and colleagues (2009), and Kelder and colleagues (2009) show an increase in the number of weekly physical education minutes after the passage of state laws requiring daily physical education. However, implementation of state policies varied across the affected school districts (Evenson et al., 2009; Kelder et al., 2009), and some schools cited competing time demands as a barrier to full implementation (Evenson et al., 2009). More recently, Perna and colleagues (2012) examined the association between strong state laws and weekly physical education time using the C.L.A.S.S. state policy and SHPPS school-level physical education time-related measures. They found that, in states with stronger laws, 27-60 more minutes of physical education was provided weekly in elementary and middle schools compared with states with weak or no laws. However, they found no differences in weekly physical education minutes in high schools regardless of the stringency of state laws. In another study using the C.L.A.S.S. state policy data, Carlson and colleagues (2013) examined the association between the strength of state laws and the level of implementation, monitoring, and enforcement at the school level by interviewing state-level physical education coordinators. They found no policies with strong language and eight policies with moderate or weak language. They also found that none of the
interviewed coordinators knew the level of implementation of the policies at the local level. In general, they found that information on school-level implementation was lacking because there were no policies in place for monitoring or enforcement. More locally, Schwartz and colleagues (2012) examined the relationship between the strength and comprehensiveness of all school district wellness policies in the state of Connecticut and school-level implementation. They found that schools located in districts with stronger, more comprehensive wellness policies were more likely to implement the policies fully. Finally, examining the association between the presence of stronger state- and district-level policies and both weekly physical education and recess minutes in elementary schools, Slater and colleagues (2012) found laws at both levels to be associated with schools providing at least 150 weekly minutes of physical education. They also found that weak state laws were associated with schools offering at least 20 minutes of daily recess. As both the SHPPS and Bridging the Gap data show, however, schools are likely to provide recess regardless of whether there is an existing state- or district-level policy requiring it.
Declining Student Enrollment in Physical Education
The data also illustrate the slippage in physical education that can occur at both the state and local levels when weaker policies in this area are enacted (see also Figure 1-3 in Chapter 1). For example, the Shape of the Nation Report (NASPE and AHA, 2012) provides a current picture of physical education in the American education system. The 2012 survey found areas of both improvement and decline in the status of physical education. As all policy data sources highlighted in this report show, the majority of states mandate physical education at all school levels. According to the Shape of the Nation Report, however, most schools do not require a specific amount of instructional time, and more than half allow exemptions, waivers, and/or substitutions for physical education. Further, the 2011 YRBS found that 48-69 percent of students did not attend physical education classes in an average week.
The Shape of the Nation Report also shows that in most states, all children in elementary and middle schools are required to take physical education when it is offered. In high school, however, students may have flexibility in when they take physical education as long as they satisfy the requirement for graduation. This flexibility creates a situation in which not all high school students take physical education at the same time. According to CDC 2011 data, in high schools where physical education was not offered daily, 68 percent of students in 9th grade, 55 percent in 10th grade, 43 percent in 11th grade, and 39 percent in 12th grade attended physical education on 1 or more days during a typical week. In schools where
physical education was offered daily, 41 percent of students in 9th grade, 33 percent in 10th grade, 25 percent in 11th grade, and 24 percent in 12th grade attended daily physical education classes (CDC, 2012b). Across the nation, 52 percent of high school students attend physical education at least 1 day per week, and only 31.5 percent have daily physical education (CDC, 2012b).
Trends in Policies on After-School Programs
Before- and after-school programs offer additional opportunities to increase physical activity among youth. These opportunities also can be influenced by policy. Currently, no national surveillance system monitors the existence of such policies. However, Beets and colleagues (2010b) conducted a systematic review of state-level after-school program organizations to identify existing standards and policies, which they found in 47 states. Only about one-third of states’ written documentation specifically addressed providing opportunities for physical activity during after-school programs, and only four states had comprehensive language specifying training requirements, student-staff ratios, planning/evaluation of after-school physical activity, and time allocated for physically activity. In a follow-up study, Beets and colleagues (2010a) examined the amounts of physical activity children obtained while attending after-school programs in states with comprehensive policies addressing physical activity and found that children did not meet the physical activity levels outlined in the policies. Given the variation in the language of existing policies, they suggest the need to develop a model policy for incorporating physical activity into after-school programs.
Recently, the Healthy Out of School Time Coalition was formed, consisting of individuals from major after-school program organizations and policy leaders, to develop evidenced-based Healthy Eating and Physical Activity Quality Standards for use in out-of-school-time settings. The final consensus document recommends that after-school programs provide children “with at least 30 minutes of organized, inclusive physical activity for every three hours of program time” (Wiecha et al., 2012, p. 574). In addition, the standards address policy content, provision of staff training, and appropriate program infrastructure and curriculum, as well as the provision of supportive social and physical environments.
Discrepancy Between Policy and Reality
Recent data (NASPE and the AHA, 2010) show that, although many states mandate that physical education be included in the school curriculum, schools seldom adhere to specific guidelines regarding time allocation
(McCullick et al., 2012). Moreover, although elementary, middle, and high school students report meeting the national recommendation for minutes per week or per day of physical education, this may not be true in actuality. On the school schedule, the minutes allotted for physical education may be presented and reported, but the actual number of minutes in which students are engaged in physical education remains undocumented. Nor is it clear whether the time allotted for physical education was canceled or shortened on a weekly basis because of assemblies, disciplinary actions, or other school activities. Seldom are time allocations for physical education enforced or are schools held accountable for policy enforcement.
Overall, policies requiring increased physical education and physical activity at school each day have the potential to affect large numbers of children and adolescents and are an effective strategy for promoting regular physical activity. However, external and internal barriers to policy implementation need to be considered, as is highlighted by a recent study (Amis et al., 2012) finding that priority given to standardized testing and varsity sports over physical education, as well as insufficient resources and inundation with new policy requirements, serve as barriers to successful implementation of strong policies on physical activity. These findings are supported by results of a study conducted with California school board members (Cox et al., 2011), who cited most frequently as barriers to policy implementation a lack of adequate funding; limited time during the school day; and competing priorities, such as core curriculum classes and standardized testing. (See the discussion of these issues in Chapters 5 and 6.)
Existing evidence also shows some grade-level, racial/ethnic, and socio-economic disparities in participation in physical education across secondary schools (i.e., grades 8-12). Johnston and colleagues (2007) conducted a national study of 504 middle/junior high and high schools from a representative sample of geographic (urban/rural) and regional locations. The overall requirement for participation in physical education was found to drop sharply from 8th to 12th grade—87 percent in 8th grade, 47 percent in 10th grade, and 20 percent in 12th grade. The evidence also indicates a significant decrease in the minutes per week of physical education—from 172.3 minutes per week in 8th grade, to 163.9 minutes in 10th grade, to 88.6 minutes in 12th grade. The number of days per week on which students in 8th, 10th, and 12th grades receive physical education also was found to decline from 3.5 to 2.7 to 1.4 days, respectively.
From 8th to 12th grade, moreover, the percentage of students taking physical education was found to be lower in schools attended by Hispanic students than in those attended by white students; no significant differences were found for African American students (Johnston et al., 2007). Johnston and colleagues also found that schools with a greater percentage of students of higher socioeconomic status were more likely to require students
to take physical education and actually have students take it than schools with a greater percentage of students of lower socioeconomic status. These findings suggest that differences do exist in the provision of physical education across grades, race/ethnicity, and socioeconomic status in secondary schools. In general, however, data on differences in the percentage of students taking physical education by race/ethnicity and socioeconomic status are sparse. Thus while it is important that schools closely examine and address such disparities, there is also a need to examine these disparities more closely.
Few children in the United States, probably no more than half, meet the guideline of at least 60 minutes of vigorous- or moderate-intensity physical activity daily. The reason this statistic cannot be more specific is that different measurement methods yield different estimates. Some consistent patterns can be reported, however. The proportion meeting the guideline declines with age, with more elementary school children than middle and high school students achieving the goal, and boys are more likely than girls to meet the guideline regardless of whether the information is self-reported or derived from objective measurement with accelerometers or pedometers. There are no consistent patterns across different racial/ethnic or socio-economic groups, although fewer data are available with which to examine these issues. One can also say with reasonable certainty that over the past 30-40 years, probably even longer, the volume and intensity of daily physical activity among youth have gradually declined.
During about half of their waking hours, youth engage in activities with low rates of energy expenditure—1.5 METs or less—commonly called sedentary activities. Evidence is clear for adults and is accumulating for children that shifting time spent in sedentary activities to even light-intensity physical activity is beneficial from a health perspective.
Remarkably little information exists about the physical activity behaviors of students during school hours or in school-related activities. Even the nation’s best public health surveillance systems do not obtain that information. Aside from a few good one-time surveys of physical activity during physical education classes, little information is available on students’ physical activity during the school day or in after-school programs. This lack of information is surprising given that school-related physical activity must be a large component of the overall volume of physical activity among youth and that vigorous- or moderate-intensity physical activity is vital to students’ healthy growth and development and is associated with improved academic performance and classroom behavior (see Chapters 3 and 4). Substantial evidence exists that the volume of student’s vigorous- or
moderate-intensity physical activity can be increased through daily physical education, recess, classroom physical activity, active transport to school, and before- and after-school activities (see Chapter 6).
State- and district-level policies related to physical activity have the potential to exert a positive influence on the physical activity behaviors of large numbers of children and adolescents. Evidence that such policies have not only potential but actual influence is emerging. Also emerging is evidence of slippage between the intent and implementation of these policies, such that their ultimate impact is commonly less, sometimes appreciably so, than expected. The factors that create an effective policy are still being elucidated. Policies that include required reporting of outcomes, provision of adequate funding, and easing of competing priorities appear to be more likely to be effective, as well as implemented, compared with policies that lack these features. Further evaluation of policies on physical activity and physical education is needed to fully understand their impact in changing health behavior.
Monitoring of state and district policies has improved over the past decade. In general, the number of states and districts with policies pertaining to physical education has increased, although many such policies remain weak. For example, most states and districts have policies regarding physical education, but few require daily physical education or a minimum number of minutes of physical education per week. Although some comprehensive national guidelines exist, more are needed to define quality standards for school-based physical activity policies so that more uniform programs and practices can be created across states, school districts, and ultimately schools.
An important need going forward will be augmentation of the few monitoring systems that exist for school-related physical activity behaviors. It is important to know not only how much vigorous- or moderate-intensity physical activity youth are performing but also how much of that activity is taking place in each segment of the school day (i.e., physical education, recess, classroom, transport to and from school, school-related before- and after-school activities). The YRBS, the NHANES, and Monitoring the Future provide much useful information but not enough about physical activity during and related to school. Such national surveys are not designed to provide local or even state estimates. State departments of education, local school districts, and state and local health departments will need to collaborate to provide adequate monitoring.
Finally, in addition to improved monitoring of physical activity behaviors, there is a need for augmented monitoring of physical activity–related guidelines, policies, and practices at the federal, state, and local levels. Surveillance of both student behavior and policy is necessary.
ACSM (American College of Sports Medicine). 1988. Opinion statement on physical fitness in children and youth. Medicine and Science in Sports and Exercise 20:422-423.
Albon, H. M., M. J. Hamlin, and J. J. Ross. 2010. Secular trends and distributional changes in health and fitness performance variables of 10-14-year-old children in New Zealand between 1991 and 2003. British Journal of Sports Medicine 44(4):263-269.
Amis, J. M., P. M. Wright, B. Dyson, J. M. Vardaman, and H. Ferry. 2012. Implementing childhood obesity policy in a new educational environment: The cases of Mississippi and Tennessee. American Journal of Public Health 102(7):1406-1413.
Anderson, S. E., C. D. Economos, and A. Must. 2008. Active play and screen time in US children aged 4 to 11 years in relation to sociodemographic and weight status characteristics: A nationally representative cross-sectional analysis. BMC Public Health 8(1):366.
Archer, E., R. P. Shook, D. M. Thomas, T. S. Church, P. T. Katzmarzyk, J. R. Hébert, K. L. McIver, G. A. Hand, C. J. Lavie, and S. N. Blair. 2013. 45-year trends in women’s use of time and household management energy expenditure. PLOS ONE 8(2):e56620.
Barroso, C. S., S. H. Kelder, A. E. Springer, C. L. Smith, N. Ranjit, C. Ledingham, and D. M. Hoelscher. 2009. Senate bill 42: Implementation and impact on physical activity in middle schools. Journal of Adolescent Health 45(3 Suppl):S82-S90.
Bassett, D. R., E. C. Fitzhugh, G. W. Heath, P. C. Erwin, G. M. Frederick, D. L. Wolff, W. A. Welch, and A. B. Stout. 2013. Estimated energy expenditures for school-based policies and active living. American Journal of Preventive Medicine 44(2):108-113.
Beets, M. W., M. Wallner, and A. Beighle. 2010a. Defining standards and policies for promoting physical activity in afterschool programs. Journal of School Health 80(8):411-417.
Beets, M. W., L. Rooney, F. Tilley, A. Beighle, and C. Webster. 2010b. Evaluation of policies to promote physical activity in afterschool programs: Are we meeting current benchmarks? Preventive Medicine 51(3):299-301.
Belsky, J., C. Booth, R. Bradley, C. A. Brownell, S. B. Campbell, A. Clarke-Stewart, S. L. Friedman, K. Hirsh-Pasek, R. M. Houts, A. Huston, B. Knoke, K. McCartney, T. L. McKenzie, F. Morrison, P. R. Nader, M. O’Brien, C. Payne, R. D. Parke, M. Tresch Owen, D. Phillips, R. Pianta, S. Spieker, D. L. Vandell, W. W. Robeson, and M. Weinraub. 2003. Frequency and intensity of activity of third-grade children in physical education. Archives of Pediatrics and Adolescent Medicine 157(2):185-190.
Boddy, L. M., S. J. Fairclough, G. Atkinson, and G. Stratton. 2012. Changes in cardiore-spiratory fitness in 9- to 10.9-year-old children: SportsLinx 1998-2010. Medicine and Science in Sports and Exercise 44(3):481.
Bridging the Gap. 2013a. Complete descriptive statistics on state school nutrition, physical activity, and wellness policy-related laws, school years 2006-07 through 2012-13. Chicago, IL: Bridging the Gap, Health Policy Center, Institute for Health Research and Policy, University of Illinois at Chicago. http://www.bridgingthegap.org.
Bridging the Gap. 2013b. District wellness policies. http://www.bridgingthegapresearch.org/research/district_wellness_policies (accessed April 12, 2013).
Brownson, R. C., T. K. Boehmer, and D. A. Luke. 2005. Declining rates of physical activity in the United States: What are the contributors? Annual Review of Public Health 26:421-443.
Burgeson, C. R., H. Wechsler, N. D. Brener, J. C. Young, and C. G. Spain. 2001. Physical education and activity: Results from the school health policies and programs study 2000. Journal of School Health 71(7):279-293.
Carlson, J. A., J. F. Sallis, J. F. Chriqui, L. Schneider, L. C. McDermid, and P. Agron. 2013. State policies about physical activity minutes in physical education or during school. Journal of School Health 83(3):150-156.
Carson, V., and I. Janssen. 2011. Volume, patterns, and types of sedentary behavior and cardio-metabolic health in children and adolescents: A cross-sectional study. BMC Public Health 11.
Caspersen, C. J., K. E. Powell, and G. M. Christenson. 1985. Physical activity, exercise, and physical fitness: Definitions and distinctions for health-related research. Public Health Reports 100(2):126.
CDC (Centers for Disease Control and Prevention). 1999. Ten great public health achievements—United States, 1900-1999. Morbidity and Mortality Weekly Report 48(12):241-243.
CDC. 2003. Physical activity levels among children aged 9-13 years—United States, 2002. Morbidity and Mortality Weekly Report 52:785-788.
CDC. 2012a. Nutrition, physical activity, & obesity data & statistics. http://www.cdc.gov/healthyyouth/npao/data.htm (accessed January 13, 2013).
CDC. 2012b. Youth risk behavior surveillance: United States, 2011. Morbidity and Mortality Weekly Report 61(4):1-162.
Chiriqui, J. F. 2012. It’s time to update your wellness policy: How does your policy compare to policies nationwide? Webinar presentation for Illinois Department of Public Health “We Choose Health” Initiative, Illinois Maternal and Child Health Coalition, December 18, 2012. Chicago, IL: Bridging the Gap, Health Policy Center, Institute for Health Research and Policy, University of Illinois at Chicago. http://www.bridgingthegapresearch.org/_asset/68byty/Chriqui_IDPH_2012_wellne (accessed April 10, 2013).
Church, T. S., D. M. Thomas, C. Tudor-Locke, P. T. Katzmarzyk, C. P. Earnest, R. Q. Rodarte, C. K. Martin, S. N. Blair, and C. Bouchard. 2011. Trends over 5 decades in US occupation-related physical activity and their associations with obesity. PLOS ONE 6(5):e19657.
Cox, L., V. Berends, J. F. Sallis, J. M. St. John, B. McNeil, M. Gonzalez, and P. Agron. 2011. Engaging school governance leaders to influence physical activity policies. Journal of Physical Activity & Health 8(Suppl 1):S40-S48.
Delva, J., P. M. O’Malley, and L. D. Johnston. 2006. Racial/ethnic and socioeconomic status differences in overweight and health-related behaviors among American students: National trends 1986-2003. Journal of Adolescent Health 39(4):536-545.
Dollman, J., K. Norton, and L. Norton. 2005. Evidence for secular trends in children’s physical activity behaviour. British Journal of Sports Medicine 39(12):892-897.
Ekelund, U., J. Luan, L. B. Sherar, D. W. Esliger, P. Griew, and A. Cooper. 2012. Moderate to vigorous physical activity and sedentary time and cardiometabolic risk factors in children and adolescents. Journal of the American Medical Association 307(7):704-712.
Epstein, D. 2011. Measuring inequity in school funding. Washington, DC: Center for American Progress.
Esliger, D. W., M. S. Tremblay, J. L. Copeland, J. D. Barnes, G. E. Huntington, and D. R. Bassett Jr. 2010. Physical activity profile of Old Order Amish, Mennonite, and contemporary children. Medicine and Science in Sports and Exercise 42(2):296-303.
Evenson, K. R., K. Ballard, G. Lee, and A. Ammerman. 2009. Implementation of a school-based state policy to increase physical activity. Journal of School Health 79(5):231-238.
Fairclough, S. J., A. Beighle, H. Erwin, and N. D. Ridgers. 2012. School day segmented physical activity patterns of high and low active children. BMC Public Health 12(1):406.
Fakhouri, T. H., J. P. Hughes, D. J. Brody, B. K. Kit, and C. L. Ogden. 2013. Physical activity and screen-time viewing among elementary school-aged children in the United States from 2009 to 2010. Journal of the American Medical Association 167(3):223-229.
Falb, M. D., D. Kanny, K. E. Powell, and A. J. Giarrusso. 2007. Estimating the proportion of children who can walk to school. American Journal of Preventive Medicine 33(4):269-275.
Gauthier, A. P., M. Laurence, L. Thirkill, and S. C. Dorman. 2012. Examining school-based pedometer step counts among children in grades 3 to 6 using different time-tables. Journal of School Health 82(7):311-317.
Gortmaker, S. L., R. Lee, A. L. Cradock, A. M. Sobol, D. T. Duncan, and Y. C. Wang. 2012. Disparities in youth physical activity in the United States: 2003-2006. Medicine and Science in Sports and Exercise 44(5):888-893.
Grøntved, A., and F. B. Hu. 2011. Television viewing and risk of type 2 diabetes, cardiovascular disease, and all-cause mortality: A meta-analysis. Journal of the American Medical Association 305(23):2448-2455.
Hairston, K. G., J. L. Ducharme, M. S. Treuth, W.-C. Hsueh, A. M. Jastreboff, K. A. Ryan, X. Shi, B. D. Mitchell, A. R. Shuldiner, and S. Snitker. 2012. Comparison of BMI and physical activity between Old Order Amish children and non-Amish children. Diabetes Care [epub ahead of print].
HealthyPeople.gov. 2012. Physical activity. http://www.healthypeople.gov/2020/topicsobjectives2020/objectiveslist.aspx?topicId=33 (accessed February 25, 2013).
Healy, G. N., D. W. Dunstan, J. Salmon, E. Cerin, J. E. Shaw, P. Z. Zimmet, and N. Owen. 2008a. Breaks in sedentary time beneficial associations with metabolic risk. Diabetes Care 31(4):661-666.
Healy, G. N., D. W. Dunstan, J. Salmon, J. E. Shaw, P. Z. Zimmet, and N. Owen. 2008b. Television time and continuous metabolic risk in physically active adults. Medicine and Science in Sports and Exercise 40(4):639.
HHS (U.S. Department of Health and Human Services). 1984. Promoting health/preventing disease: Objectives for the nation. Washington, DC: HHS.
HHS. 1996. Physical activity and health: A report of the Surgeon General. Atlanta, GA: HHS, CDC, National Center for Chronic Disease Prevention and Health Promotion.
HHS. 2008. Physical activity guidelines for Americans. Washington, DC: HHS.
Hu, F. B., T. Y. Li, G. A. Colditz, W. C. Willett, and J. E. Manson. 2003. Television watching and other sedentary behaviors in relation to risk of obesity and type 2 diabetes mellitus in women. Journal of the American Medical Association 289(14):1785-1791.
IOM (Institute of Medicine). 2012. Accelerating progress in obesity prevention: Solving the weight of the nation. Washington, DC: The National Academies Press.
Janz, K. F., T. L. Burns, and S. M. Levy. 2005. Tracking of activity and sedentary behaviors in childhood: The Iowa Bone Development Study. American Journal of Preventive Medicine 29(3):171-178.
Johnston, L. D., J. Delva, and P. M. O’Malley. 2007. Sports participation and physical education in American secondary schools. Current levels and racial/ethnic and socioeconomic disparities. American Journal of Preventive Medicine 33(4 Suppl):S195-S208.
Katzmarzyk, P. T., T. S. Church, C. L. Craig, and C. Bouchard. 2009. Sitting time and mortality from all causes, cardiovascular disease, and cancer. Medicine and Science in Sports and Exercise 41(5):998-1005.
Kelder, S. H., A. E. Springer, C. S. Barroso, C. L. Smith, E. Sanchez, N. Ranjit, and D. M. Hoelscher. 2009. Implementation of Texas Senate Bill 19 to increase physical activity in elementary schools. Journal of Public Health Policy 30:S221-S247.
Kohl, H. W., III, and K. E. Hobbs. 1998. Development of physical activity behaviors among children and adolescents. Pediatrics 101(Suppl 2):549-554.
Lanningham-Foster, L., L. J. Nysse, and J. A. Levine. 2003. Labor saved, calories lost: The energetic impact of domestic labor-saving devices. Obesity 11(10):1178-1181.
Lee, S. M., C. R. Burgeson, J. E. Fulton, and C. G. Spain. 2007. Physical education and physical activity: Results from the School Health Policies and Programs Study 2006. Journal of School Health 77(8):435-463.
Malina, R. 2007. Physical fitness of children and adolescents in the United States: Status and secular change. Medicine and Sport Science 50:67-90.
Mâsse, L. C., J. F. Chriqui, J. F. Igoe, A. A. Atienza, J. Kruger, H. W. Kohl Iii, M. M. Frosh, and A. L. Yaroch. 2007. Development of a Physical Education-Related State Policy Classification System (PERSPCS). American Journal of Preventive Medicine 33(4 Suppl):S264-S276.
Matthews, C. E., K. Y. Chen, P. S. Freedson, M. S. Buchowski, B. M. Beech, R. R. Pate, and R. P. Troiano. 2008. Amount of time spent in sedentary behaviors in the United States, 2003-2004. American Journal of Clinical Nutrition 167(7):875-881.
Matthews, C. E., S. M. George, S. C. Moore, H. R. Bowles, A. Blair, Y. Park, R. P. Troiano, A. Hollenbeck, and A. Schatzkin. 2012. Amount of time spent in sedentary behaviors and cause-specific mortality in U.S. adults. American Journal of Clinical Nutrition 95(2):437-445.
McCullick, B. A., T. Baker, P. D. Tomporowski, T. J. Templin, K. Lux, and T. Isaac. 2012. An analysis of state physical education policies. Journal of Teaching in Physical Education 31(2):200-210.
McDonald, N. C. 2007. Active transportation to school: Trends among U.S. schoolchildren, 1969-2001. American Journal of Preventive Medicine 32(6):509-516.
McDonald, N. C., A. L. Brown, L. M. Marchetti, and M. S. Pedroso. 2011. U.S. school travel, 2009: An assessment of trends. American Journal of Preventive Medicine 41(2):146-151.
McKenzie, T. L., J. F. Sallis, and P. R. Nader. 1991. SOFIT: System for Observing Fitness Instruction Time. Journal of Teaching in Physical Education 11(2):195-205.
McKenzie, T. L., P. R. Nader, P. K. Strikmiller, and M. Yang. 1996. School physical education: Effect of the Child and Adolescent Trial for Cardiovascular Health. Preventive Medicine 5(4):423-431.
McKenzie, T. L., D. J. Catellier, T. Conway, L. A. Lytle, M. Grieser, L. A. Webber, C. A. Pratt, and J. P. Elder. 2006. Girls’ activity levels and lesson contexts in middle school PE: TAAG baseline. Medicine and Science in Sports and Exercise 38(7):1229.
Nader, P. R., R. H. Bradley, R. M. Houts, S. L. McRitchie, and M. O’Brien. 2008. Moderate-to-vigorous physical activity from ages 9 to 15 years. Journal of the American Medical Association 300(3):295-305.
Nanney, M. S., T. Nelson, M. Wall, T. Haddad, M. Kubik, M. N. Laska, and M. Story. 2010. State school nutrition and physical activity policy environments and youth obesity. American Journal of Preventive Medicine 38(1):9.
NASPE (National Association for Sport and Physical Education) and AHA (American Heart Association). 2010. Shape of the nation report: Status of physical education in the USA. Reston, VA: NASPE.
NASPE and AHA. 2012. Shape of the nation report: Status of physical education in the USA. Reston, VA: American Alliance for Health, Physical Education, Recreation and Dance.
New America Foundation. 2012. School finance: Federal, state, and local K-12 school finance overview. http:/febp.newamerica.net/background-analysis/school-finance (accessed January 13, 2013).
PAGAC (Physical Activity Guidelines Advisory Committee). 2008. Physical activity guidelines advisory committee report. Washington, DC: HHS.
Pate, R. R., M. Pratt, S. N. Blair, W. L. Haskell, C. A. Macera, C. Bouchard, D. Buchner, W. Ettinger, G. W. Heath, and A. C. King. 1995. Physical activity and public health. Journal of the American Medical Association 273(5):402-407.
Pate, R. R., P. S. Freedson, J. F. Sallis, W. C. Taylor, J. Sirard, S. G. Trost, and M. Dowda. 2002. Compliance with physical activity guidelines: Prevalence in a population of children and youth. Annals of Epidemiology 12(5):303-308.
Pate, R. R., R. Ross, M. Dowda, S. G. Trost, and J. Sirard. 2003. Validation of a 3-day physical activity recall instrument in female youth. Pediatric Exercise Science 15(3):257-265.
Pate, R. R., C.-Y. Wang, M. Dowda, S. W. Farrell, and J. R. O’Neill. 2006a. Cardiorespiratory fitness levels among US youth 12 to 19 years of age: Findings from the 1999-2002 national health and nutrition examination survey. Archives of Pediatrics & Adolescent Medicine 160(10):1005.
Pate, R. R., J. Stevens, C. Pratt, J. F. Sallis, K. H. Schmitz, L. S. Webber, G. Welk, and D. R. Young. 2006b. Objectively measured physical activity in sixth-grade girls. Archives of Pediatrics & Adolescent Medicine 160(12):1262-1268.
Pate, R. R., J. A. Mitchell, W. Byun, and M. Dowda. 2011. Sedentary behaviour in youth. British Journal of Sports Medicine 45(11):906-913.
Pate, R. R., J. R. O’Neill, and F. Lobelo. 2008. The evolving definition of “sedentary.” Exercise and Sport Science Reviews 36(4):173-178.
Perna, F. M., A. Oh, J. F. Chriqui, L. C. Mâsse, A. A. Atienza, L. Nebeling, T. Agurs-Collins, R. P. Moser, and K. W. Dodd. 2012. The association of state law to physical education time allocation in US public schools. American Journal of Public Health 102(8):1594-1599.
Powell, K. E., A. M. Roberts, J. G. Ross, M. A. C. Phillips, D. A. Ujamaa, and M. Zhou. 2009. Low physical fitness among fifth- and seventh-grade students, Georgia, 2006. American Journal of Preventive Medicine 36(4):304-310.
Powell, K. E., A. E. Paluch, and S. N. Blair. 2011. Physical activity for health: What kind? How much? How intense? On top of what? Annual Review of Public Health 32:349-365.
Rideout, V., U. G. Foehr, and D. F. Roberts. 2010. Generation M2: Media in the lives of 8- to 18-year-olds. Washington, DC: Kaiser Family Foundation.
Ridgers, N. D., G. Stratton, and S. J. Fairclough. 2005. Assessing physical activity during recess using accelerometry. Preventive Medicine 41(1):102-107.
Ridley, K., B. Ainsworth, and T. Olds. 2008. Development of a compendium of energy expenditures for youth. International Journal of Behavioral Nutrition and Physical Activity 5(1):45.
Rush, E., T. Coppinger, V. Obolonkin, E. Hinckson, L. McGrath, S. McLennan, and D. Graham. 2012. Use of pedometers to identify less active children and time spent in moderate to vigorous physical activity in the school setting. Journal of Science and Medicine in Sport 15(3):226-230.
Sallis, J. F., T. L. McKenzie, J. E. Alcaraz, B. Kolody, N. Faucette, and M. F. Hovell. 1997. The effects of a 2-year physical education program (SPARK) on physical activity and fitness in elementary school students. American Journal of Public Health 87(8):1328-1334.
Salmon, J., A. Timpero, V. Cleland, and A. Venn. 2005. Trends in children’s physical activity and weight status in high and low socio-economic status areas of Melbourne, Victoria, 1985-2001. Australian and New Zealand Journal of Public Health 29(4):337-342.
Santtila, M., H. Kyröläinen, T. Vasankari, S. Tiainen, K. Palvalin, A. Häkkinen, and K. Häkkinen. 2006. Physical fitness profiles in young Finnish men during the years 1975-2004. Medicine and Science in Sports and Exercise 38(11):1990.
Schwartz, M. B., K. E. Henderson, J. Falbe, S. A. Novak, C. M. Wharton, M. W. Long, M. L. O’Connell, and S. S. Fiore. 2012. Strength and comprehensiveness of district school wellness policies predict policy implementation at the school level. Journal of School Health 82(6):262-267.
Simons-Morton, B. G., G. S. Parcel, N. M. O’Hara, S. N. Blair, and R. R. Pate. 1988. Health-related physical fitness in childhood: Status and recommendations. Annual Review of Public Health 9(1):403-425.
Simons-Morton, B. G., W. C. Taylor, S. A. Snider, and I. W. Huang. 1993. The physical activity of fifth-grade students during physical education classes. American Journal of Public Health 83(2):262-264.
Simons-Morton, B. G., W. C. Taylor, S. A. Snider, I. W. Huang, and J. E. Fulton. 1994. Observed levels of elementary and middle school children’s physical activity during physical education classes. Preventive Medicine 23(4):437-441.
Simons-Morton, B. G., T. J. McKenzie, E. Stone, P. Mitchell, V. Osganian, P. K. Strikmiller, S. Ehlinger, P. Cribb, and P. R. Nader. 1997. Physical activity in a multiethnic population of third graders in four states. American Journal of Public Health 87(1):45-50.
Sisson, S. B., T. S. Church, C. K. Martin, C. Tudor-Locke, S. R. Smith, C. Bouchard, C. P. Earnest, T. Rankinen, R. L. Newton Jr., and P. T. Katzmarzyk. 2009. Profiles of sedentary behavior in children and adolescents: The U.S. National Health and Nutrition Examination Survey, 2001-2006. International Journal of Pediatric Obesity 4(4):353-359.
Slater, S. J., L. Nicholson, J. Chriqui, L. Turner, and F. Chaloupka. 2012. The impact of state laws and district policies on physical education and recess practices in a nationally representative sample of U.S. public elementary schools. Archives of Pediatrics & Adolescent Medicine 166(4):311-316.
Strong, W. B., R. M. Malina, C. J. Blimkie, S. R. Daniels, R. K. Dishman, B. Gutin, A. C. Hergenroeder, A. Must, P. A. Nixon, J. M. Pivarnik, T. Rowland, S. Trost, and F. Trudeau. 2005. Evidence based physical activity for school-age youth. Journal of Pediatrics 146(6):732-737.
Tomkinson, G., and T. Olds. 2007. Secular changes in pediatric aerobic fitness test performance: The global picture. Medicine and Sport Science 50:46-66.
Tomkinson, G. R., D. Macfarlane, S. Noi, D.-Y. Kim, Z. Wang, and R. Hong. 2012. Temporal changes in long-distance running performance of Asian children between 1964 and 2009. Sports Medicine 42(4):267-279.
Torun, B. 1983. Inaccuracy of applying energy expenditure rates of adults to children. American Journal of Clinical Nutrition 38(5):813-815.
Tremblay, M. S., J. D. Barnes, J. L. Copeland, and D. W. Esliger. 2005. Conquering childhood inactivity: Is the answer in the past? Medicine and Science in Sports and Exercise 37(7):1187.
Tremblay, M. S., A. G. LeBlanc, M. E. Kho, T. J. Saunders, R. Larouche, R. C. Colley, G. Goldfield, and S. C. Gorber. 2011. Systematic review of sedentary behaviour and health indicators in school-aged children and youth. International Journal of Behavioral Nutrition and Physical Activity 8(1):98.
Treuth, M. S., D. J. Catellier, K. H. Schmitz, R. R. Pate, J. P. Elder, R. G. McMurray, R. M. Blew, S. Yang, and L. Webber. 2012. Weekend and weekday patterns of physical activity in overweight and normal-weight adolescent girls. Obesity 15(7):1782-1788.
Troiano, R. P., D. Berrigan, K. W. Dodd, L. C. Mâsse, T. Tilert, and M. McDowell. 2008. Physical activity in the United States measured by accelerometer. Medicine and Science in Sports and Exercise 40(1):181-188.
Tudor-Locke, C., S. M. Lee, C. F. Morgan, A. Beighle, and R. P. Pangrazi. 2006. Children’s pedometer-determined physical activity during the segmented school day. Medicine and Science in Sports and Exercise 38(10):1732-1738.
TVB (TV Basics). 2012. TV Basics. http://www.tvb.org/media/file/TV_Basics.pdf (accessed January 13, 2013).
U.S. Department of Education. 2009. National Public Education Financial Survey (NPEFS). Washington, DC: U.S. Department of Education, National Center for Education Statistics, Common Core of Data (CCD).
Wiecha, J. L., G. Hall, E. Gannett, and B. Roth. 2012. Development of healthy eating and physical activity quality standards for out-of-school time programs. Childhood Obesity 8(6):572-576.
Wijndaele, K., G. N. Healy, D. W. Dunstan, A. G. Barnett, J. Salmon, J. E. Shaw, P. Z. Zimmet, and N. Owen. 2010. Increased cardiometabolic risk is associated with increased TV viewing time. Medicine and Science in Sports and Exercise 42(8):1511-1518.
Wijndaele, K., S. Brage, H. Besson, K. T. Khaw, S. J. Sharp, R. Luben, N. J. Wareham, and U. Ekelund. 2011. Television viewing time independently predicts all-cause and cardiovascular mortality: The European Prospective Investigation into Cancer and Nutrition (EPIC) Norfolk study. International Journal of Epidemiology 40(1):150-159.
Wright, V. R., J. Price, S. M. Bianchi, and B. R. Hunt. 2009. The time use of teenagers. Social Science Research 38:792-809.


