
2
Empirical Analysis of Geographic Variation
As described in Chapter 1, the Centers for Medicare & Medicaid Services (CMS) charged the Institute of Medicine’s (IOM’s) Committee on Geographic Variation in Health Care Spending and Promotion of High-Value Care with examining “geographic variation in intensity, cost, and growth of health care services and in per capita health care spending among the Medicare, Medicaid, privately insured, and uninsured U.S. populations.” To this end, the committee commissioned new analyses to complement its evaluation of the existing literature. The purpose of these new analyses was to quantify the magnitude of geographic variation in spending, utilization, and quality across various populations, payers, and geographic units; to evaluate known (and measurable) factors that account for variation in the Medicare and commercial markets; and to identify types of health care services with disproportionately high rates of variation that drive total variation.
RESEARCH FRAMEWORK AND STATISTICAL MODELING APPROACH
The literature on geographic variation has focused largely on traditional, fee-for-service Medicare. Much less is known about variation in expenditures and outcomes in the private market and in other public programs, such as Medicaid and Medicare Advantage (also known as Medicare Part C). This gap in knowledge is significant. A recent study notes that in 2010, Medicare spending accounted for 23 percent of the $2.19 trillion spent on personal health care in the United States, while spending in
the private sector and Medicaid made up 34 and 17 percent, respectively (MedPAC, 2012). Although Medicare beneficiaries represent just 15 percent of the total U.S. population, more than 60 percent of Americans are covered by private insurance (ASPE, 2011). Moreover, 28 percent of all Medicare beneficiaries are enrolled in the Medicare Advantage program, which allows private insurers to contract with CMS to provide Medicare-covered Part A, B, and D services (Gold et al., 2013). Medicare is the largest single payer for health care in the nation, and has for many years been the only available source of reliable national claims data (Bernstein et al., 2011; Reschovsky et al., 2011). Nonetheless, spending and utilization patterns in traditional Medicare should not be assumed to be representative of other payer markets or of total U.S. health care spending and utilization.
To better understand the causes of variation in the health care system, the committee commissioned original empirical analyses of the complete database of Medicare beneficiaries (by Acumen, LLC; Dartmouth Institute of Health Policy and Clinical Practice; and the University of Pittsburgh), as well as two nationwide commercial databases, OptumInsight (by The Lewin Group) and Thomson Reuters (TR) MarketScan (by Harvard University).1,2 The results of these analyses were synthesized and used to conduct a separate analysis of geographic variation in total health care spending (by Precision Health Economics, LLC [PHE]).
The subcontractors conducted a series of regression and correlation analyses to examine geographic variation in spending, utilization, and quality among the overall Medicare and commercial populations (aggregate analyses), as well as among 15 subpopulations with acute and chronic clinical conditions (cohort analyses). As noted in Chapter 1, not all geographic variation is unacceptable. The analyses conducted for this study generally excluded acceptable variation, which occurs as a result of factors beyond the
_________________
1Two different commercial databases were used to improve the external validity of the analyses of variation in the private sector. Each database had unique advantages: While the TR MarketScan database is large and representative, the OptumInsight database provides rich, individual-level data on a number of demographic factors. Results for both commercial populations are presented throughout Chapter 2 and 3, alongside the Medicare findings. For details on each database, refer to Appendix C and the subcontractor reports. (All subcontractor final reports and spreadsheets of results are publicly available on the IOM webpage at http://www.iom.edu/geovariationmaterials.)
2Refer to Chapter 1, Box 1-2, for a complete list of subcontractors performing these analyses and corresponding data sources.
control of the health care system in a region. Specifically, the baseline regression model was used to examine geographic variation in spending and utilization, adjusted for input prices of areas, as well as the age, sex, and health status of patients. As detailed in later sections, except where noted, regression models were not adjusted for other factors beyond the control of the health care system that often are associated with poor health status or higher spending, such as beneficiaries’ race and income, or factors that cannot be measured using claims data, such as patient or physician preferences. The specific research methodologies of these analyses are summarized in Appendix C and further detailed in the individual subcontractor reports. The results of the empirical analyses are presented in this chapter and Chapter 3.
The committee also commissioned analyses of the Medicaid database (by Acumen, LLC). As noted in Chapter 1, however, those findings are not presented in this report because of concerns about their reliability and validity due to incomplete data. The Acumen report notes that in 2007, more than 64 percent of all Medicaid beneficiaries were at least partially covered by a managed care program. Data on these beneficiaries had large gaps, as CMS did not begin collecting encounter claims data on managed care enrollees until 2012 (Acumen, LLC, 2013a). In addition, studies of Medicaid generally are restricted to populations enrolled in fee-for-service programs, thus limiting the reliability and generalizability of results based on Medicaid data (Autor et al., 2011). Unlike Medicare, moreover, Medicaid can vary considerably in programming and policies because states can request waivers from CMS to operate outside of federal guidelines. Medicaid programming and policies also have changed over time, so the data available for individual states vary widely. As described below, however, PHE imputed values for a hospital referral region’s (HRR’s) Medicaid population in its calculation of total U.S. health care spending.
The committee’s analysis of geographic variation for the uninsured population also was restricted. According to the 2011 Current Population Survey, the uninsured population, one in seven of whom is an undocumented immigrant, made up approximately 16 percent of the total U.S. population in 2010 (ASPE, 2011; Zuckerman et al., 2011). Although uninsurance rates are known to vary greatly among states, a comprehensive analysis of geographic variation among the uninsured could not be conducted because of the lack of a coordinated database on the financing and delivery of care for this population. As discussed in later sections of this chapter, however, PHE adjusted its calculation of total U.S. health care spending, and associated analyses of variation for spending incurred by the uninsured were conducted using census data and Medical Expenditure Panel Survey (MEPS) data (PHE, 2013).
This chapter presents findings from the committee’s empirical evaluation of geographic variation, with support from the existing literature. After briefly addressing the methodological issue of the unit of analysis, the chapter confirms the robust presence of regional variation in both Medicare and commercial health care spending and utilization across multiple geographic units as well as over time. It then explores the sources of this
geographic variation, evaluating the role of price; other patient-, provider, and market-level factors also are examined. Next, the influence of high variation in post-acute care services on total variation in Medicare spending and utilization is discussed. Finally, the chapter briefly assesses the limitations of efforts to analyze variation in quality and presents the committee’s recommendation for future research.
GEOGRAPHIC VARIATION AND THE UNIT OF ANALYSIS
The performance of the health care system varies across different units of analysis, including physician, practice, health care system, and geographic unit. Geographic units can in turn be defined by economic markets (e.g., HRRs), political boundaries (e.g., county, state), administrative areas (e.g., zip codes, census tracts), or where people live (e.g., metropolitan statistical areas). In accordance with its statement of task, the committee examined variation within “areas of different sizes” to determine how variation is affected by different levels of aggregation. Box 2-1 defines technical geographic units referenced throughout the literature on geographic variation and this report. To the extent possible, the committee considered variation across and within individual providers in an area, although in practice, concerns about patient privacy, proprietary information, and small sample sizes precluded public release of analyses at the individual physician level (and even results pertaining to small geographic areas).
CONFIRMING REGIONAL VARIATION IN SPENDING AND UTILIZATION
Health care spending is a measure of expenditures for care, and reflects the effects of both the utilization of health services and their prices. “Utilization” captures the total number of units or intensity of health care services, as well as the mix of services provided. Recent reports by the Dartmouth Institute for Health Policy and Clinical Practice and the Medicare Payment Advisory Commission (MedPAC) estimate that unadjusted Medicare spending per beneficiary is 50-55 percent higher in HRRs in the highest quintile of spending relative to those in the lowest quintile. Medicare service use (adjusted for demographics and beneficiary health) is approximately 30 percent greater in the highest quintile compared with the lowest (MedPAC, 2011; Zuckerman et al., 2010). These findings are corroborated by a large body of literature that highlights the robust presence of variation in health care spending and utilization across regions in the United States (CBO, 2008; Fisher and Wennberg, 2003; Fisher et al., 2003a,b; GAO, 2009; MedPAC, 2003, 2009; Wennberg et al., 2002, 2008).
BOX 2-1
Definitions of Geographic Units Frequently Used in Health Services Research
• Hospital service areas (HSAs)—Created by Dartmouth and defined by assigning to an HSA the zip codes from which a hospital or several hospitals draw the greatest proportion of their Medicare patients. There are 3,426 HSAs (Dartmouth Institute for Health Policy and Clinical Practice, 2013).
• Hospital referral regions (HRRs)—Created by Dartmouth to represent regional health care markets for tertiary (complex) medical care. Dartmouth defined 306 HRRs by assigning HSAs to regions where the greatest proportion of major cardiovascular procedures were performed, “with minor modifications to achieve geographic contiguity, a minimum total population size of 120,000, and a high localization index” (Dartmouth Institute for Health Policy and Clinical Practice, 2013).
• Metropolitan statistical areas (MSAs, or metropolitan core-based statistical areas [CBSAs])—Created by the Office of Management and Budget using counties. Each of 388 MSAs (OMB, 2013) includes one or more counties with one core urban area of 50,000 individuals or more, as well as “adjacent counties exhibiting a high degree of social and economic integration” (as measured by such factors as commuting patterns) with an urban core (OMB, 2010). Areas that do not qualify as MSAs are often classified as “outside” MSAs (OMB, 2010) or non-MSAs. The Centers for Medicare & Medicaid Services (CMS) adjusts hospital payments according to a hospital wage index calculated for MSAs and non-MSAs* (CMS, 2012).
_________________
*CBSAs are geographic entities that the Office of Management and Budget implemented in 2003 (OMB, 2010). The committee’s commissioned analyses used MSAs (a subcomponent of CBSAs also referred to as metropolitan CBSAs), as well as non-MSA “rest of state” regions. For simplicity, and in accordance with expert practice in this area (Acumen, LLC, 2009; MedPAC, 2012; OMB, 2010), the committee uses the term “metropolitan CBSA” throughout this report.
Medicare and Commercial Spending Varies Across All Levels of Geography
For the present study, variation was examined at three geographic units of measurement: hospital service area (HSA), HRR, and metropolitan core-based statistical area (metropolitan CBSA). In the Acumen Medicare analysis, total spending, measured per capita, includes all costs incurred (by beneficiary and insurer) in traditional fee-for-service Medicare (Parts A, B,
and D). Medicare Advantage (Part C) was evaluated in a separate analysis discussed below. Similarly, in the OptumInsight (Lewin) and MarketScan (Harvard) analyses of commercial data, total spending includes all facility, provider, and prescription drug costs incurred by the beneficiary, the insurer, and any additional (secondary) payers. To keep the presentation manageable, the analysis results are shown as a summary measure of variation—the 90th percentile of spending compared with the 10th percentile (for aggregated years 2007-2009). This value is approximately the ratio of average spending in the highest-spending quintile of geographic units to average spending in the lowest-spending quintile.
The analysis results, displayed in Table 2-1, show that without adjustments for any differences among regions, the HRR in the 90th percentile spent 42 percent more per Medicare beneficiary each month than the HRR in the 10th percentile. At the metropolitan CBSA level, the 90th percentile spent 38 percent more than the 10th percentile per beneficiary each month. Similar analyses of commercial insurance data confirm the presence of spending variation for all geographic units.
Table 2-1 also shows that considerably greater variation exists at the smaller, HSA level. The policy implications of increasing levels of variation for smaller geographic units are discussed in Chapter 4. The committee, however, has chosen to present analysis results at the HRR level in the remainder of this report, as the corresponding area served by a major tertiary care hospital is the most widely established unit of analysis in the literature on geographic variation.
TABLE 2-1
Ratio of the 90th to the 10th Percentiles of Unadjusteda Per-Member-Per Month (PMPM) Medicare and Commercial Spending Across Geographic Units
| HSA | HRR | Metropolitan CBSA | |
| Medicare | 1.47 | 1.42 | 1.38 |
| Commercial 1 (OptumInsight) | 1.71b | 1.42 | 1.50 |
| Commercial 2 (MarketScan) | 1.43 | 1.36 | 1.36 |
NOTE: Metropolitan CBSA = metropolitan core-based statistical area (also referred to as metropolitan statistical area [MSA]); HRR = hospital referral region; HSA = hospital service area.
a“Unadjusted spending” refers to all-cause spending that has not been adjusted for any factors other than year of analysis and length of beneficiary enrollment.
bThe OptumInsight results in this table are based on 2,896 HSAs with at least 500 observations. The analysis was conducted using only “large” HSAs to mitigate the effect of outliers. The Medicare and MarketScan databases were much larger; the data generally had normal distribution and were less affected by outliers.
SOURCE: Committee analysis of subcontractor data.
While variation occurs for all levels of geography, public- and private-sector spending per beneficiary (adjusted for age, sex, and health status) are only weakly correlated at the HRR level (PHE, 2013). In other words, areas that are high spenders in Medicare are not necessarily high spenders in the commercial market and vice versa. As shown in Table 2-2, the two commercial databases correlate well with each other, but are weakly correlated with Medicare. As described in later sections, spending variation in Medicare is driven by variation in utilization of post-acute services, whereas in the commercial population, price has a greater influence than utilization on overall spending variation.
As noted previously, most of the literature on geographic variation has of necessity relied on data from Medicare Parts A and B. Any measure of total spending by HRR is necessarily incomplete because of data limitations but is useful as a measure of the total resources potentially available to medical decision makers in an HRR. It is surprising that the correlation of Medicare spending with total spending is not higher (see Table 2-3), as Medicare accounts for a substantial fraction of total health care spending. Moreover, it is unclear why a phenomenon responsible for variation
TABLE 2-2
Correlation of Spending Measures Between Medicare and Commercial Payers
| Medicare & MarketScan | Medicare & OptumInsight | MarketScan & OptumInsight | |
| “Raw”a Baseline Spending | 0.112 | 0.081 | 0.663 |
| Input Price Adjusted Baseline Spending | -0.094 | -0.032 | 0.632 |
NOTE: All hospital referral region means are from the “Baseline” regression model, and thereby adjusted for partial year enrollment, age, sex, age*sex, and health status.
a“Raw” spending refers to all-cause spending not adjusted for input-prices.
SOURCE: PHE, 2013.
TABLE 2-3
Correlation Between Total Spending and Payer-Specific Spending
| MarketScan | Medicare | ||
| Total Spending (Input Price Adjusted) | 0.21 | 0.30 | |
SOURCE: PHE, 2013.
in Medicare expenditures, such as practice patterns, would not matter for total spending as well. A map showing PHE’s estimate of quintiles of total spending across HRRs is included in Appendix G.
The committee commissioned a separate analysis of variation in Medicare Advantage (Part C) spending. That analysis was limited in scope as individual-level claims data were not available for the 2007-2009 study period; therefore, the analysis examined spending variation based on total monthly Medicare reimbursement paid to Medicare Advantage plans (Acumen, LLC, 2013a).3 In part because of a policy decision to raise reimbursements in HRRs with lower traditional Medicare spending, the analysis found somewhat less variation in Medicare Advantage spending compared with traditional Medicare: HRRs in the 90th percentile spent 36 percent more per Medicare Advantage beneficiary than HRRs in the 10th percentile, while Table 2-1 shows a slightly higher differential ratio for fee-for-service beneficiaries. The distribution of the 90th to the 10th HRR cost percentile is narrower, as Medicare Advantage monthly spending is based on benchmarks set by the Congress. Although average per capita spending is higher for Medicare Advantage ($986) than for traditional Medicare ($958), HRR-level expenditures are correlated between the two programs (0.66).
A complementary analysis by PHE examined geographic variation in total health care spending at the HRR level. This measure accounts for the total population in the United States by synthesizing estimates from Acumen’s population-specific study of Medicare and Medicaid fee-for-service (Acumen, LLC, 2013a,b) and Harvard’s analysis of the MarketScan database as a proxy for commercial spending (Harvard University, 2012). Spending for the uninsured population was imputed by estimating a factor price-adjusted national average based on census and MEPS data. The spending estimate for Medicaid Managed Care was generated using enrollment and total dollars paid for Medicaid health maintenance organization (HMO) beneficiaries by state, using data from the Medicaid Statistical Information System (MSIS). To create the total spending measure, payer-specific weights were applied.4 The analysis of total spending found that HRRs in the 90th percentile spend 50 percent more per beneficiary each month than HRRs in the 10th percentile, a larger variation than that shown in Table 2-1 for Medicare or commercial insurers (PHE, 2013).
_________________
3CMS began collecting individual encounter claims data for Medicare Advantage beneficiaries in April 2012.
4See PHE (2013) for detailed methodology. That report is publicly available on the IOM webpage at the following link: http://www.iom.edu/geovariationmaterials.
Medicare and Commercial Utilization of Health Care Varies Across Service Categories
The committee also commissioned analyses of geographic variation in utilization, which is measured in two ways. The first entails measuring utilization as “counts” of specific medical services, such as the number of emergency department and office visits per beneficiary per month. Because there are many different types of services, any measure of total utilization must be a weighted sum of those services (for example, a hospital day should count more than a single laboratory test). The subcontractors weighted each service by a standard national price for that service to remove the effect of different prices across geographic locations and derive a measure of the aggregate quantity of services. This is the second measure of total utilization.5
The ratios of the 90th to the 10th percentile of risk-adjusted utilization (measured as counts) point to the presence of regional variation across different types of health care services within both the Medicare and commercial payer populations (see Table 2-4). The high use of emergency department services among the MarketScan commercial population is particularly striking, as utilization among HRRs in the 90th percentile (measured as counts of visits per beneficiary per month) is more than twice as high as that among HRRs in the 10th percentile.
A recent MedPAC analysis also reveals substantial regional variation in service-specific utilization. Metropolitan CBSAs in the 90th percentile utilized approximately 2.01 times as much post-acute care per beneficiary as metropolitan CBSAs in the 10th percentile (MedPAC, 2011).6 After post-acute care services, the ambulatory care (outpatient visit) and inpatient visit categories varied the most, with 90th to 10th percentile ratios of 1.24 and 1.22, respectively (MedPAC, 2011). The impact of post-acute care services on variation in total Medicare spending and utilization is discussed in greater detail later in this chapter.
The wide variation in inpatient hospitalization spending has been a key focus in the literature. Findings have shown that these regional differences may result from variation in the per capita rates of admission and readmission (Fisher et al., 1994; Wennberg and Cooper, 1998), average lengths of hospital stay (Yuan et al., 2000), and mix of patient diagnosis-related groups (DRGs) (Frick et al., 1985; Steinwald, 2003), and indirectly from
_________________
5Refer to Appendix E for detail on the methodology.
6This MedPAC analysis adjusts for input price and health status. The MedPAC report notes that this regression model used a “service sector-specific health status adjustor. For example, metastatic cancer would have a much greater coefficient for total service utilization than it would for post acute care. This is different than using a beneficiary’s HCC [hierarchical condition category] score to adjust for health status” (MedPAC, 2011, p. 7).
TABLE 2-4
Ratio of the 90th to the 10th Percentile of Per-Member-Per Month (PMPM) Risk-Adjusted Utilization (measured as counts) of Selecteda Service Categories Among Medicare and Commercial Populations at the Hospital Referral Region Level
| Inpatient Admission | Outpatient Visits | Prescription Drug Fills | Emergency Department Visits | Imaging Procedures | |
| Medicare | 1.29 | 1.33 | 1.19 | 1.33 | 1.23 |
| Commercial 1 (OptumInsight) |
1.48 | 1.46 | 1.36 | 1.54 | 1.76 |
| Commercial 2 (MarketScan) |
1.45 | 1.30 | 1.34 | 2.04 | 1.33 |
NOTE: Utilization figures have been adjusted for age, sex, and health status.
aThe committee was limited in the number of utilization measures it could investigate across Medicare and commercial databases due to time and budget constraints. Hence, post-acute care was not included in the committee’s main analysis. However, upon receiving preliminary results of the analysis, the committee asked Acumen to investigate post-acute care. Commercial payers did not conduct a similar analysis due to their younger populations, who receive very little post-acute care as a population. This table only presents utilization measures that are common across payer populations.
SOURCE: Committee analysis of subcontractor data.
a host of inpatient-care and efficiency-related factors (nurse staffing, tests, procedures, drugs) that may differ across and within geographic regions (Franzini et al., 2010).
The empirical analyses of Medicare and commercial data demonstrate considerable variation in emergency department and outpatient visits. This variation may be due to underlying differences in the regional distribution of socioeconomic factors shown to influence emergency department use (Cunningham, 2006). Significant regional variation also may exist in the organizational structure of emergency response staff, as well as the technical capacity of emergency department facilities (Cummins, 1993) and/or the supply and availability of primary care services (Cunningham, 2006).
The University of Pittsburgh analysis of Medicare Part D found HRR-level variation in prescription drug spending and use,7 with 90th to 10th percentile ratios of 1.24 and 1.17, respectively (University of Pittsburgh, 2013). Although a multitude of studies have assessed variation in total utilization of health care, the literature on variation in the use of prescription drugs is limited.
_________________
7The Pittsburgh analysis adjusted drug spending for patient demographics (age, sex, race, income), insurance status, and clinical characteristics (CMS-HCC risk scores, prescription drug HCC [RxHCC] risk scores, and institutionalization status) (University of Pittsburgh, 2013, p. 9).
Geographic Variation Persists Over Time
Although total health care spending has grown steadily over time (Fisher et al., 2009), Figure 2-1 demonstrates that in the past four decades, per capita health care spending has been growing more rapidly in the commercial sector than in Medicare. The committee commissioned “growth” analyses to assess whether geographic variation persists over time, and thus can be considered a true signal rather than a result of random noise. At any fixed point in time, area-level expenditures reflect the underlying spending habits of individual beneficiaries while also reflecting some degree of random noise arising from the uncertainty of individual health episodes. The former factor persists over time, while the latter does not. Trends in prices paid by commercial insurers and the demographics of those whom they insure also may change over time in ways that do not mimic Medicare.
Acumen’s analysis of Medicare data found that spending and utilization growth rates have not differed much over time between high- and low-cost regions of the country; regions that were high- (or low-) cost in 1992 remained so in 2010 (Acumen, LLC, 2013b). This finding is illustrated in Figure 2-2, which classifies HRRs into cost quintiles based on their expenditure levels in 1992; quintiles 1 and 5 represent the lowest- and highest-cost regions, respectively. After regional differences due to input price, age, sex, and health status are removed, expenditure growth patterns are highly similar in each quintile (with the exception of some regression toward the mean for quintile 5). In short, spending differences between low- and high-cost geographic regions persist over time and thus do not simply reflect random variation at a point in time. Utilization growth rates mirror the spending patterns presented in Figure 2-2. These results are consistent with the existing literature, which reports that variation in Medicare spending persists across areas over time (Cutler and Sheiner, 1999).
Another demonstration of the stability of the HRR cost quintiles over time is shown in Tables 2-5 and 2-6, which display the change in quintile rank between 1992 and 2010 for spending and utilization, respectively (Acumen, LLC, 2013b). As shown in Table 2-5, among all HRRs in the lowest-cost quintile of spending in 1992, 61 percent remained in the lowest-cost quintile in 2010, 28 percent moved to the second-lowest-cost quintile, and so on. Stability in utilization, displayed in Table 2-6, is weaker, with only 46 percent of HRRs in the lowest-cost quintile remaining in that quintile in 2010.
As a final way of distinguishing the portion of geographic variation that arises from systematic differences and the portion that is random, the subcontractors examined correlations of year-to-year spending and year-to-year utilization during 1992 and 2010 (Acumen, LLC, 2013b). Area-level Medicare spending is highly correlated from one year to the next, with an
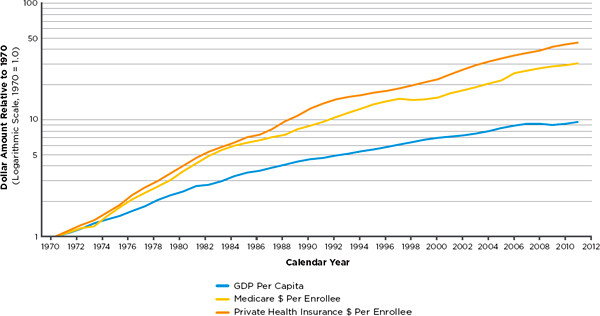
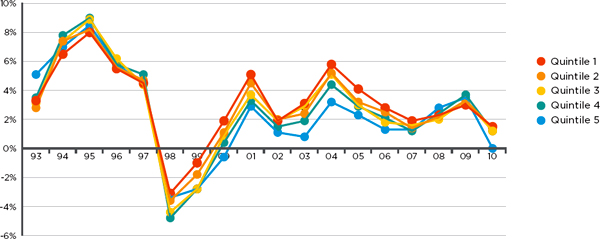
FIGURE 2-2
Growth rates of Medicare spending, adjusted for demographics, health tatus, and input price, among quintilesa of hospital referral regions (HRRs) based on expenditure levels in 1992.
aThe same HRRs are included in each cost quintile throughout the period of analysis. Quintiles 1 and 5 represent the lowest and highest cost regions, respectively.
SOURCE: Acumen, LLC, 2013b.
TABLE 2-5
Stability in Medicare Spending Quintiles
| Quintile in 1992 | Quintile in 2010 | ||||
| 1 | 2 | 3 | 4 | 5 | |
| 1 (lowest) | 61% | 28% | 10% | 2% | 0% |
| 2 | 26% | 41% | 23% | 7% | 3% |
| 3 | 13% | 21% | 38% | 25% | 3% |
| 4 | 0% | 8% | 23% | 44% | 25% |
| 5 (highest) | 0% | 2% | 7% | 23% | 69% |
SOURCE: Acumen, LLC, 2013b.
TABLE 2-6
Stability in Medicare Utilization Quintiles
| Quintile in 1992 | Quintile in 2010 | ||||
| 1 | 2 | 3 | 4 | 5 | |
| 1 (lowest) | 46% | 25% | 16% | 8% | 5% |
| 2 | 30% | 33% | 23% | 13% | 2% |
| 3 | 21% | 25% | 25% | 16% | 13% |
| 4 | 2% | 13% | 30% | 33% | 23% |
| 5 (highest) | 2% | 5% | 7% | 29% | 58% |
SOURCE: Acumen, LLC, 2013b.
average Pearson correlation of 0.96 between any given year “t” and year “t + 5” (for example, between 1992 and 1997). Year-to-year Medicare utilization is slightly less correlated, with a Pearson correlation of 0.86 for any given year “t” and year “t + 5.” These high correlations are further evidence that HRR spending and utilization levels are stable, with regions that are high- (or low-) cost in 1992 remaining so in 2010. In other words, little of the variation is random. More precisely, random variation in average HRR-level Medicare spending in any one year is small relative to the mean (ranging from 2 percent for the largest HRR to 4 percent for the smallest HRR), suggesting that sample sizes per HRR are sufficiently large to support conclusions.
Acumen’s Medicare Advantage analysis also found a strong correlation of spending over time (2007-2009 period of analysis), with correlation coef-
ficients greater than 0.972 for all year-to-year comparisons (Acumen, LLC, 2013a). As noted earlier, Medicare Advantage spending is highly stable as it is determined by CMS benchmarks, which are based on historical fee-for-service rates and updated yearly. The Harvard MarketScan analysis echoes the Medicare growth analysis, finding moderately high correlations (ranging from 0.68 to 0.88) of area-level year-to-year commercial spending during 2006 and 2010 (Harvard University, 2012). Naturally, correlations drop as intervals between years increase; for example, the correlation of spending between 2006 and 2007 is 0.77, whereas that between 2006 and 2010 is 0.57. Overall, the high year-to-year correlation and quintile stability suggest that geographic variation is real and not an artifact of random noise.
Conclusion 2.1. Geographic variation in spending and utilization is real, and not an artifact reflecting random noise. The committee’s empirical analyses of Medicare and commercial data confirm the robust presence of variation, which persists across geographic units and health care services and over time.
THE ROLE OF VARIATION IN PRICE
As discussed earlier, variation in health care spending reflects variation in both price and utilization (quantity of services). Price is the amount paid by insurers and beneficiaries to a provider per unit of health care services. Price variation is attributable to two factors: (1) differences in the prices of inputs that are beyond a provider’s control (costs related to capital; labor; and other overhead costs, such as rent and insurance), and (2) the margin above the cost of inputs that a payer or provider chooses to set or negotiate (Gold, 2004). Whereas CMS traditionally sets a uniform national base price, adjusting for the differences in input prices across geographic areas and certain other factors, commercial prices are set through negotiations between payers and providers (Chernew et al., 2010; Dunn et al., 2012). Because negotiating power varies across areas, the variation in prices received by providers is substantially larger in the commercial sector than in Medicare.
Analyses conducted for this study support the results in the existing literature, which reports that adjusting for regional differences in prices has little effect on observed variation in Medicare spending (Cutler and Sheiner, 1999; Fuchs et al., 2001; Gottlieb et al., 2010). In this study, adjustments for input prices slightly increased geographic variation as compared with unadjusted spending. HRR-level input-price-adjusted spending at the 90th percentile was 44 percent more per Medicare beneficiary than input-price-
adjusted spending at the 10th percentile.8 However, this does not imply that the HRRs in the 90th and 10th percentiles of unadjusted spending and input-price-adjusted spending are the same. In other words, a high-spending HRR could hypothetically move to a low-spending quintile following the elimination of regional variation due to input prices.
In the commercial market, however, regional differences in price rather than utilization of health care services influence much of the overall regional variation in spending (Donohue et al., 2012; Dunn et al., 2012). In the MarketScan commercial population, adjustment for input prices reduced variation across areas by only a small amount, as the difference between the 90th and 10th percentiles of spending decreased from 36 percent to 33 percent (Harvard University, 2012). To further explore the effects of price, Harvard’s MarketScan analysis examined relationships among spending, quantity (counts of service use), and price,9 with adjustment for age, sex, and health status. As shown in Figure 2-3, price and quantity are negatively correlated; spending is relatively uncorrelated with quantity, but highly correlated with price. This finding highlights the importance of further examining variation in commercial prices to understand its relationship to total commercial spending.
In a separate analysis, Harvard investigators disaggregated price into its subcomponents and examined variation in input prices and markups (defined as the difference between input and transaction “output” prices). Harvard reports that 70 percent of variation in total commercial spending is attributable to price markups, most likely reflecting the varying market
_________________
8Note that this result differs from the finding in MedPAC’s 2011 Report to Congress: Regional Variation in Medicare Service Use, which reports that input price adjustment decreased variation between metropolitan CBSAs in the 90th and 10th percentiles from 55 percent to 30 percent. Differences in the time period (MedPAC data are from 2006-2008), the data file used (MedPAC uses the beneficiary-level annual summary file [BASF] and inpatient claims), and especially in standardization methods could explain this discrepancy. Acumen used claim-level standardization for all Medicare Part A and B services, while MedPAC used claim-level standardization only for inpatient claims and the BASF for all other claims. In the BASF files, payment adjustments are based on the location of the beneficiary rather than the location of the provider. Acumen adjusted all Part A and B spending for the input price of the provider’s location. Acumen then aggregated each individual’s total price-adjusted spending and assigned this amount to the location (i.e., HRR) in which the individual resided.
9Refer to the Harvard report for detail on the methodology of the price calculation (Harvard University, 2012).
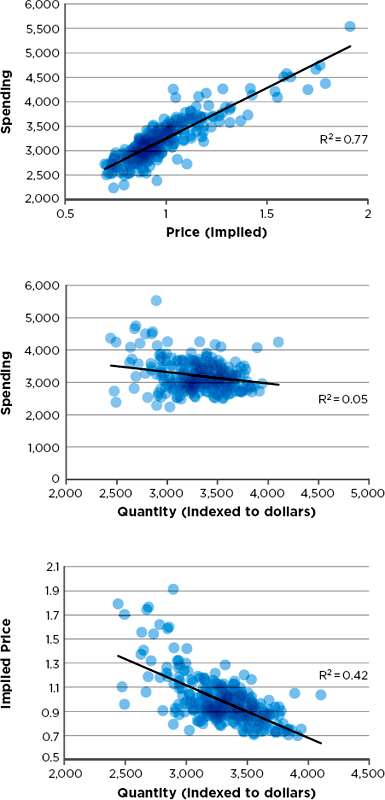
TABLE 2-7
Relative Proportion of Spending Variation Due to Quantity (utilization), Markup, and Input Price, Decomposed by Service Type
| Quantity (%) | Markup (%) | Input-Price (%) | |
| Total Medical Spending | 16 | 70 | 14 |
| Inpatient Spending | 18 | 62 | 20 |
| Outpatient Spending | 21 | 70 | 9 |
SOURCE: Harvard University, 2012.
power of providers across HRRs (Harvard University, 2012).10 As discussed earlier, variation in the utilization of health care services, particularly inpatient hospitalization and emergency department visits, does contribute to regional spending differences in the commercial population. As shown in Table 2-7, however, utilization and input prices have noticeably smaller effects than price markups on overall variation in commercial spending.
Conclusion 2.2. Variation in spending in the commercial insurance market is due mainly to differences in price markups by providers rather than to the differences in the utilization of health care services.
OTHER FACTORS ACCOUNTING FOR GEOGRAPHIC VARIATION
As noted in Chapter 1, reducing regional differences in health care spending and utilization is desirable only to the extent that the variation reflects system inefficiencies. A number of factors contribute to geographic variation, and while many of these factors have traditionally been classified as “acceptable” or “unacceptable,” some sources of variation are ambiguous and do not fall neatly into either category. Area-level differences in factor prices (wage, rent, and other overhead costs) and in patient health status and demographic characteristics (e.g., age, gender) generally are considered to be acceptable sources of variation (American Hospital Association, 2011; Bernstein et al., 2011) because they are beyond the control of both providers and patients. By contrast, geographic variation in spend-
_________________
10It is widely believed that variation in prices for services delivered to commercially insured patients is driven by variation in provider market power. This belief has been difficult to confirm or refute empirically. It is not straightforward, for example, to define the boundaries for the relevant market; the relevant region for providing radiation therapy services differs from the region for acute cardiac care, for example, so a hospital may have a very large market share for one service and not for another. Consequently, market power may very well explain much of the variation in pricing for commercially insured patients, but appropriate empirical tests are difficult to implement.
ing is considered inappropriate or “unacceptable” when it is caused by or results in ineffective use of treatments, as by provider failure to adhere to established clinical practice guidelines, or when it reflects the market power of providers. As noted, not all causes of variation can be neatly classified. Variation stemming from differential patient preferences may potentially be acceptable, although more intensive treatment does not necessarily lead to higher-value care. Other demographic factors, such as race, represent a mix of acceptable and unacceptable causes of variation. If health needs vary by race across populations, it will be important to account for its effects. If race were responsible for preferences for care or discrimination, however, it would not be considered an acceptable source of variation in health care utilization. The literature shows a lack of consensus on a definitive framework for acceptable and unacceptable variation, and the interpretation of the association of such factors as patient preferences or race with variation is unclear.
A review of the literature on geographic variations reveals patient health status to be a key explanatory factor; however, estimates of its contribution vary greatly. Adjusting for health status has been shown to reduce variation in Medicare spending by 16 to 66 percent (CBO, 2008; Cutler and Sheiner, 1999).11 A recent study found that health status, measured at the individual level, accounted for 18 percent of the geographic difference between the highest- and lowest-spending Medicare quintiles (Bernstein et al., 2011; Sutherland et al., 2009). The wide range of the explanatory effect of health status is due in general to differences across studies in the geographic unit of analysis and the risk adjustment methodology.
Health status risk scores typically are measured based on diagnosis codes recorded on Medicare claims. Because these codes differentiate only modestly among patients with the same diagnoses, they cannot perfectly capture true illness severity (Pine et al., 2007). Therefore, using such measures may fail to correct fully for differences in health status among areas. Moreover, risk adjustment using claims-based measures such as CMS’s hierarchical condition category (HCC) codes may be subject to bias, as regions that have higher spending and greater intensity of practice appear to code more intensively, thus overstating beneficiaries’ severity of illness (Song et al., 2010). As a result, at least some of the reduction in variation attribut-
_________________
11The 2008 Congressional Budget Office report states that previous work by MedPAC had concluded that 16 percent of variation in spending should be attributable to regional differences in beneficiary health status (CBO, 2008). This analysis was conducted at the state-level and weighted by population. The Cutler and Sheiner (1999) analysis, on the other hand, conducted at the HRR level with unweighted estimates, found that 66 percent of variation could be accounted for by differences in health status. It is unclear whether these studies used retrospective or prospective analysis. These differences in methodology can partially explain the large range of explanatory power attributable to health status (Manning et al., 2012).
able to health status using claims-based measures is an artifact of more aggressive surveillance and diagnosis by providers in higher-spending regions, although how important this bias is in attributing differences in spending among regions to differences in health status has not been quantified.
Adjusting for patient burden of illness using more complete measures of health status naturally accounts for a greater portion of unexplained geographic variation in Medicare spending. A recent study found that using progressively better and more comprehensive measures of health status reduced unexplained variation by 21-33 percent (Zuckerman et al., 2010). A separate evaluation of Medicare Part D (prescription drug) risk adjustment methodology found that incorporating information on prior-year drug use, cost, or both into CMS’s prescription drug HCC (RxHCC) greatly improved the variation explained (Hsu et al., 2009). For example, using a CMS-HCC summary score explained 10 percent of variation in Medicare drug spending, while including more detailed information and using 184 HCC indicators explained 17 percent. Respecting practical limitations, ideally health status measures based on claims data should be enhanced with important behavioral and clinical data on Medicare and commercially insured beneficiaries.
Previous studies have found that demographic variables such as age, sex, race, ethnicity, and income are common confounders of individual patient health (Adler and Newman, 2002; Case and Deaton, 2005; DeNavas-Walt et al., 2009; Farley, 1985). As discussed earlier, differences in the regional distribution of these factors may subsequently influence aggregated, area-level health care spending and utilization. Although the age and sex composition of Medicare beneficiaries is generally similar across large geographic areas, race and income patterns are more heterogeneous (Baicker, 2004; Baicker et al., 2005). In 2004, approximately 80 percent of Hispanics in the United States lived in 9 states, while 60 percent of all African Americans were concentrated in 10 states (American Hospital Association, 2009). Furthermore, disease burden and associated medical spending vary among different races; for example, one study found that African American Medicare beneficiaries had higher health care spending than non-Hispanic white beneficiaries (Baicker et al., 2004). It is important to note that demographic variables, including gender, age, race/ethnicity, and income, continue to serve as proxies for other, unmeasured behavioral and socioeconomic predictors of health status. Although there is some heterogeneity in the distribution of demographic variables throughout the United States, they may be close enough to uniform that they do not explain variation at the area level, particularly after variation attributable to patient health status is accounted for.
To date, few studies have investigated the degree to which the type and benefit generosity of insurance plans contribute to measures of geographic
variation in health care spending and utilization. The benefits associated with specific insurance plans, including deductibles, copayments, and other internal limits, can affect how much health care is consumed, as well as what health care is provided (Finkelstein et al., 2012; Newhouse and Insurance Experiment Group, 1993). In comparing spending by payer type, a recent study found more variation in hospitalizations across metropolitan areas for populations with unmanaged care than for those enrolled in an HMO (Baker et al., 2010). The committee’s empirical analyses of Medicare and commercial spending, utilization, and quality adjusted for regional differences attributable to these predictors, as discussed in the following sections and in Chapter 4.
In addition to population and patient characteristics, geographic variation in health care spending and utilization may be influenced by a host of local and regional market factors, such as the supply of providers and medical services, the percentage composition of the insured population, and provider and payer competition (Baicker et al., 2004; Fisher et al., 2003a; Reschovsky et al., 2011; Welch et al., 1993; Wennberg and Cooper, 1999). The types of providers within a defined area (HRR, state, other definitions) may affect variation in health care spending; recent studies have found a correlation between a higher percentage of primary care physicians and lower spending per beneficiary within a region (Baicker et al., 2005; Chernew et al., 2009). Greater hospital capacity within regions, which translates to a higher ratio of beds to per capita population, is correlated with higher health care utilization, particularly affecting rates of inpatient hospital admission (Wennberg et al., 2004). Although the supply of physicians and hospitals is correlated with health care spending and utilization, there may not necessarily be a causal connection, as variables such as physician supply and hospital capacity are endogenous in nature.
EMPIRICAL EVALUATION OF PREDICTORS OF VARIATION
The committee’s commissioned analyses complement the existing literature evaluating the role of patient-, payer-, and market-level factors on geographic variation in health care spending and utilization. The subcontractors conducted multiple ordinary least squares (OLS) regression analyses at the HSA, HRR, and metropolitan CBSA levels, controlling for “clusters” of established predictors.12 In selecting a baseline case model (Cluster 2), the committee adjusted for “acceptable” and expected sources of geographic variation, such patient health status, age, and sex. The baseline model does not adjust for other, ambiguous demographic factors,
_________________
12See Table 2-8 and Appendix D for a complete list of predictors and regression model specifications.
such as race and income, as these variables are distributed heterogeneously across regions, suggesting that some areas may have greater access to or can afford better health care. The baseline case model also does not adjust for endogenous factors such as market supply variables, which, like race and income, are considered by some to be “unacceptable” sources of variation.
Table 2-8 shows how the HRR-level distribution of the highest-spending (90th percentile) and lowest-spending (10th percentile) quintiles changes with adjustment for regional differences in predictors. Results indicate that adjusting for age and sex (Cluster 1) has a negligible effect on geographic variation in Medicare spending. Beneficiary health status (Cluster 2), when measured using diagnoses recorded on claims, substantially reduces variation between high- and low-spending regions across both Medicare and commercial payers.13 This suggests that diagnoses recorded on claims are systematically different across HRRs. Therefore, the base case adjustments (Cluster 2) account for much of the variation in input-price-adjusted spending.
Figure 2-4 illustrates the change in geographic variation in Medicare input-price-adjusted spending after adjustment for age, sex, and health status predictors (Control and Cluster 2 in Table 2-8). Each bar represents the number of people in HRRs with a given spending level. For example, the far left bar in the top histogram indicates that around a million people live in HRRs with Medicare spending under $700. The lower histogram is adjusted for age, sex, and health status, whereas the upper one is not. As indicated by the narrowed distribution of the 90th to the 10th percentile ratios (1.44 to 1.23) in the lower histogram, a greater number of HRRs (weighted by beneficiary months) fall in the middle range of Medicare spending when age, sex, and health status are taken into account.
Results of the Cluster 3 and 4 regressions in Table 2-8 demonstrate that when health status is excluded from the model, other demographic variables, such as race or income, provide little explanatory power.14 Cluster 5 results confirm that race and income have a trivial effect on reducing variation once beneficiary health status is included in the model. Insurance and employer characteristics (Cluster 6) also explain some regional variation in the commercially insured population.
Comparing the results of Clusters 2 and 8 shows that once age, sex,
_________________
13In the Harvard MarketScan regression analysis, spending variation is reduced most substantially with adjustment for age and sex (Cluster 1), and health status (Cluster 2) appears not to provide additional explanatory power. As age and sex are common confounders for health status, however, this may be a result of measurement issues in the data. The combined effect of demographic variables and health status on variation is considerably large.
14Race and income variables have a slightly greater effect in the MarketScan population than in the Medicare and OptumInsight populations. This difference in results may be attributed to varying sample sizes in each HRR across the different databases.
TABLE 2-8
Ratios of 90th to 10th Percentile HRR-Level Input-Price-Adjusted Spending Across Payers When Adjusted for “Clusters” of Predictors
| Cluster | Ratio: Medicare | Ratio: Commercial 1 (OptumInsight) | Ratio: Commercial 2 (MarketScan) |
| Control: Adjusted for Year and Partial-Year Enrollment Only |
1.44 | 1.43 | 1.33 |
| Cluster 1: Adjusted for Control + Age + Sex + Age–Sex Interaction |
1.44 | 1.43 | 1.26 |
| Cluster 2: Adjusted for Cluster 1 + Health Statusa |
1.23 | 1.37 | 1.28 |
| Cluster 3: Adjusted for Cluster 1 + Race |
1.40 | 1.43 | 1.24 |
| Cluster 4: Adjusted for Cluster 1 + Income |
1.41 | 1.40 | 1.26 |
| Cluster 5: Adjusted for Cluster 1 + Race + Income + Health Status |
1.25 | 1.42 | 1.27 |
| Cluster 6: Adjusted for Cluster 1 + Employer/Insurance Predictorsb |
* | 1.39 | 1.30 |
| Cluster 7: Adjusted for Cluster 1 + Market-Level Predictorsc |
1.44 | ** | 1.26 |
| Cluster 8d,e: Adjusted for Cluster 5 + Employer/Insurance Predictors + Market-Level Predictors |
1.25 | ** | 1.28 |
| Cluster 9e: Adjusted for Cluster 5 + Employer/Insurance Predictors + Reduced Set of Market-Level Predictors |
1.25 | ** | 1.27 |
| Cluster 10e: Adjusted for Cluster 1 + Medicare-Specific Variablesd |
1.25 | *** | *** |
a The analysis uses CMS’s 2008 definition of hierarchical condition categories (HCCs) as an indicator of health status.
b Employer and insurance characteristics include the following variables: benefit generosity, payer/plan type, plan size (OptumInsight only), and data source (MarketScan only).
c Market-level predictors include the following variables: hospital competition, % uninsured population, supply of medical services, malpractice environmental risk, physician composition, access to care, payer mix, Medicaid penetration, health professional mix, supplemental Medicare insurance.
d Cluster 8 combines all predictors used in Clusters 1-7. These include demographic variables (age, gender, race, income), health status, employer and insurance characteristics, and market-level factors. In addition to the specified predictors, this model also includes dummy indicators for institutional status, dual-enrollment status, and supplemental Medicare insurance.
e See Appendix D for complete model specifications for the Medicare analysis.
*This regression was conducted using commercial insurance data only, as it was not applicable to the Medicare analysis.
**The methodology used to conduct the OptumInsight market-level analysis differed substantially from that of the other analyses, making the results noncomparable across subcontractors. Refer to Lewin’s report for complete findings (The Lewin Group, 2013).
***This regression specification was limited to the Medicare analysis.
SOURCE: Committee analysis of subcontractor data.
and health status are accounted for, the full set of market variables does not reduce variation in either the Medicare or commercially insured population. Even after adjustment for all predictors measurable within the data used for these analyses and supported by the literature (demographic factors, health status, insurance and employer characteristics, and market-level covariates), a substantial amount of variation remains unexplained. The degree to which this variation represents “unacceptable” variation or inefficiency rather than potentially “acceptable” variation due to factors not measured by the data (such as patient preferences and health behaviors) is unknown.
Results differ for the commercial population. Much of the variation in spending in that population is attributable to differential markups, which are not present in the Medicare population since CMS sets a take-it-or-leave-it price. Not surprisingly, market factors play a role in explaining the variation attributable to these markups; accounting for them reduces the variation in the markups by 27 percent. Because of the negative correlation between markups and quantity (utilization) of health care, however, market factors and spending show little correlation (see Table 2-8).
Moreover, the results of PHE’s analysis of variation in total, input-price-adjusted health care spending attributable to known predictors, displayed in Table 2-9, reveal a pattern similar to that of Medicare- and commercial-only spending. The drop in the 90th to 10th percentile ratio between the Control and Cluster 2 regression models suggests that age, sex, and health status of beneficiaries account for a substantial portion of variation across HRRs. Factors such as race, income, and market variables do not provide additional explanatory power once age, sex, and health status are included in the model. Moreover, unexplained variation remains that may be a result of unobservable, unmeasured acceptable factors or unacceptable inefficiencies.
These analyses were limited to predictors measurable with claims data. As a result, the regional variation attributable to patient preferences and access to care or to differences in physician discretion and practice patterns, for example, could not be measured.
Patient access to care has been shown to influence Medicare spending and utilization. Fisher and Wennberg (2003) conclude that HRRs that provide lower access to care, with long waiting times for office or emergency department visits, also tend to have higher expenditures (Fisher and Wennberg, 2003). Although patient access to medical care varies across regions in the United States as the result of a number of socioeconomic factors (Fiscella et al., 2000), it appears to have little impact on patients’ perceived quality of care (Fowler et al., 2008; Radley, 2012).
It is unclear what proportion of overall variation can be accounted for by regional variation in patient preferences, a variable that is challenging to measure with accuracy. Some studies have found an association between
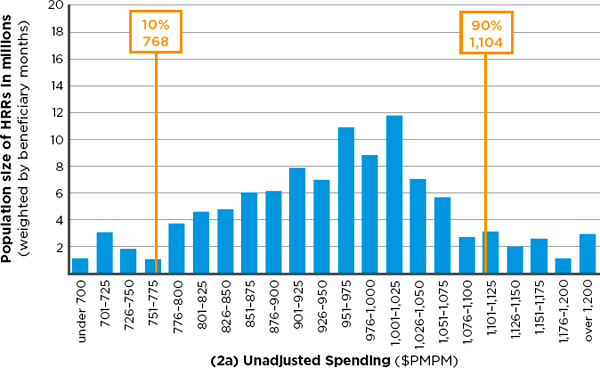
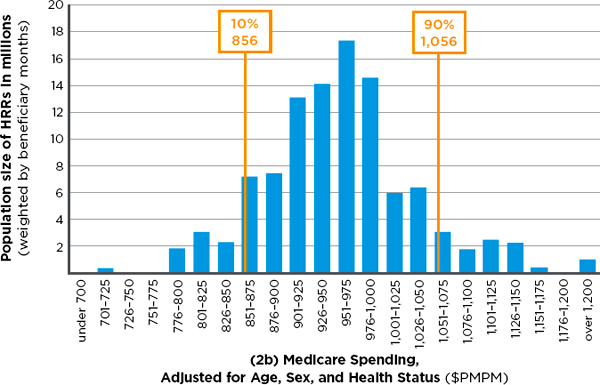
FIGURE 2-4 Number of Medicare beneficiaries in hospital referral regions (HRRs) in 22 categories of monthly per capita spending, with input-price adjustment alone (2a— top) and with input-price adjustment plus adjustment for age, sex, and health status (2b—bottom).
NOTE: Medicare spending in both 2a and 2b have been adjusted for regional difference in input price. PMPM = per patient per month.
SOURCE: Developed by the committee and IOM staff based on data from Acumen Medicare analysis.
TABLE 2-9
Ratios of 90th to 10th Percentile HRR-Level Input-Price-Adjusted Total Health Care Spending When Adjusted for Selected “Clusters” of Predictors
| Cluster | Ratio: Total Spending |
||
| Control: No adjustments |
1.48 | ||
| Cluster 2: Adjusted for Partial Year Enrollment + Age + Sex + Age–Sex Interaction + Health Status |
1.32 | ||
| Cluster 3: Adjusted for Cluster 2 + Race |
1.31 | ||
| Cluster 4: Adjusted for Cluster 2 + Income |
1.31 | ||
| Cluster 5: Adjusted for Cluster 2 + Race + Income |
1.31 | ||
| Cluster 7: Adjusted for Cluster 2 + Market Variablesa |
1.32 | ||
| Cluster 9e: Adjusted for Cluster 5 + Market Variablesa |
1.29 | ||
a Precision Health Economics selected a reduced set of market-level variables from those originally provided in the Acumen, Lewin, and Harvard reports on Medicare and commercial data according to several criteria: policy relevance, consistency of measurement, lack of redundancy, and effect size of predictors in the commissioned analyses,. The following market-level covariates were used in this analysis: specialists per 1,000, beds per 1,000, Herfindahl–Hirschman Index (HHI) distribution of beds, % health maintenance organization (HMO) population, % uninsured population, total population, teaching hospital indicator, malpractice geographic practice cost index (GPCI) indicator.
SOURCE: PHE, 2013.
variation in patient preferences and geographic variation in health care utilization, while others have established that patient preferences account for little regional variation in health care spending (Anthony et al., 2009; Barnato et al., 2007).
The role of physicians in explaining regional variation is better established. Numerous studies have found that differences in provider practice patterns can explain a substantial portion of geographic variation (Baicker, 2004; MedPAC, 2008; Sirovich et al., 2005, 2008). In fact, physician decision making can account for more than half the variation in spending on end-of-life care across geographic areas (Cutler et al., 2013). Specifically, differences in physicians’ beliefs about the efficacy of certain discretionary treatments explain the largest proportion of regional variation, followed by physicians’ views on organizational factors (pressure to accommodate other providers or patients). The associated analysis found that financial
incentives do not play a role. The investigators note that provider beliefs often are not correlated with current medical professional guidelines in the United States. This suggested lack of application of evidence-based treatment that promotes high value may represent waste or inefficiency within the health care system.
The subcontractors’ analyses do not distinguish between “acceptable” and “unacceptable” sources of variation. The residual variation unaccounted for here may have a causal connection with unobservable factors, such as patient preferences, unmeasured regional differences in health status, market characteristics, or discretionary provision of inefficient care. Some variation is driven by policies specific to certain health care services or is attributable to unique regional factors, such as Medicare fraud. By definition, it is impossible to infer how much variation is attributable to each of these unmeasured factors. However, the robust presence of sizable residual variation in the use of health care services, even as more and more causes of “acceptable” variation are measured, creates a presumption that inefficiency may be one of the potential causes of variation.
Conclusion 2.3. The committee’s empirical analysis revealed that after accounting for differences in age, sex, and health status, geographic variation is not further explained by other beneficiary demographic factors, insurance plan factors, or market-level characteristics. In fact, after controlling for all factors measurable within the data used for this analysis, a large amount of variation remains unexplained.
INFLUENCE OF POST-ACUTE CARE SERVICES ON REGIONAL VARIATION IN MEDICARE
To determine the extent to which variation in particular health care services contributes to total variation in Medicare expenditures, the committee disaggregated price-standardized, risk-adjusted Medicare spending into seven types of services: (1) acute (inpatient) care, (2) post-acute care, (3) prescription drugs, (4) diagnostics, (5) procedures, (6) emergency department visits, and (7) other.15 Results of the subcontractors’ analyses suggest that utilization of post-acute care services is a key driver of HRR-level variation in Medicare spending, with most of the remaining variation stemming from use of inpatient services. Post-acute care includes a wide
_________________
15“Acute care” includes inpatient claims at acute hospitals and Medicare Part B claims when the place of service is an inpatient hospital; it excludes claims from psychiatric and rehabilitation facilities. “Post-acute care” includes home health care, skilled nursing care, hospice care, rehabilitation, and long-term care hospitals. “Prescription drugs” includes Medicare Parts B and D. “Diagnostics” includes outpatient physician visits and imaging. “Other” denotes all claims not included in the first six categories.
range of services designed to treat beneficiaries following discharge from an acute care hospital setting. A recent study reports that in 2002, approximately one-third of Medicare beneficiaries who received treatment at acute care hospitals also used post-acute care services (American Hospital Association, 2009).
The key role played by post-acute care services can be clearly seen in Figures 2-5a through 2-5h, a series of charts in which the horizontal axis represents HRRs ordered from left to right by total per-member-per-month, input-price-adjusted spending (a measure of utilization) between 2007 and 2009 for Medicare Parts A and B. Thus in each graph, the lowest total use area (Rochester, New York) is the left-most bar, and the highest total use area (Miami, Florida) is the right-most. The vertical axis represents the deviation of input-price-adjusted spending (utilization) in a particular HRR from the national mean utilization for the type of service shown after adjustment for patient demographics and health status (see the note to the figures). In other words, the residuals represent unexplained variation. Figure 2-5a shows the total Medicare utilization across HRRs that remains unexplained after adjustment for input prices, demographics, and health status, while Figures 2-5b through 2-5h display the unexplained variation in utilization in specific service categories only. These residual charts suggest that variation in post-acute care utilization accounts for a large portion of the unexplained variation in total utilization. Areas to the far left in Figure 2-5a have utilization roughly $50 to $150 below the adjusted national mean, whereas those on the far right have utilization roughly $100 to $200 above the adjusted national mean. In fact, as Table 2-10 indicates, if there were no variation in post-acute care spending, the variation in total spending would fall by 73 percent. Miami is an outlier, which the committee addresses in greater detail below.
Almost all of the remaining variation is accounted for by variation in acute (inpatient) care utilization (see Figure 2-5c). If there were no variation in acute care spending but the variation in post-acute care spending were unchanged, the variation in total spending would fall by 27 percent. Finally, if there were no variation in either acute or post-acute care spending, variation in total spending would fall by 89 percent (see Table 2-10). Thus, the remaining services shown (e.g., diagnostic, which includes outpatient physician services; emergency department/ambulance service; and prescription drugs) play a small role in variation in Medicare spending.
As discussed previously, the subcontractors’ findings are consistent with those of MedPAC’s 2011 report to Congress, which reveal that utilization of post-acute care and acute (inpatient) care accounts for the greatest variability in Medicare spending (MedPAC, 2011). Prior studies have noted that variation in the use of post-acute care is influenced not only by demographic and clinical factors but also by a number of nonclinical
predictors, including “variation in provider practice patterns, differences in local regulatory practices, and supply of [post-acute care] services” (Kane et al., 2002). Availability of and access to different types of post-acute care services also were found to be a determinant of utilization (Buntin et al., 2005). Although the subcontractors’ post-acute care analyses did not adjust for market factors (for example, supply of post-acute care facilities and beds), previous results of regression modeling (presented in Table 2-8) demonstrate that, after accounting for age, sex, and health status, market factors do not provide additional explanatory power.
The committee noted that certain geographic areas spent considerably more than others for specific high-margin goods and services (e.g., home health care and durable medical equipment). The geographic variation in home health care spending may be partially accounted for by the variation in beneficiary and provider adherence to program standards (MedPAC, 2012). The comprehensive coverage criteria allow beneficiaries to receive an unlimited number of home health care episodes once they qualify, and provide no incentives for either beneficiaries or physicians to consider alternative treatments. Some evidence also suggests that providers do not consistently follow Medicare’s standards in designing treatment. Although these differences in practice patterns explain some variation in home health care, the literature suggests that large deviations from the national average in spending and utilization in some areas may be an indication of fraud (Bernstein et al., 2011; MedPAC, 2009). In fact, the U.S. Office of the Inspector General (OIG) identified certain geographic areas in Florida, Illinois, Louisiana, Michigan, New York, and Texas as high-risk for Medicare fraud (OIG, 2012). For example, Table 2-11 shows data from MedPAC on spending on home health care and durable medical equipment in the four southernmost Florida counties in 2006 and 2008 (MedPAC, 2011). Miami-Dade County is a clear outlier, with per capita spending substantially greater than that of other nearby areas. Additionally, “in 2009, OIG found that Miami-Dade County, Florida, accounted for more home health outlier payments in 2008 than the rest of the Nation combined and that 67 percent of home health agencies that received outlier payments greater than $1 million were located in Miami-Dade County” (OIG, 2012, p. 9).
As described earlier, not all sources of variation can be measured, and variation in spending attributable to geographic variation in fraud is one such source. Although the amount of annual Medicare spending due to fraud is, by definition, unknown (Goldman, 2012), recent estimates indicate that Medicare and Medicaid paid as much as $98 billion in fraudulent and abusive charges in 2011 (Berwick and Hackbarth, 2012). Because fraud represents care that is never delivered to a patient and consequently cannot improve health, a geographic payment adjustment based on area-level performance would penalize areas with above-average fraud. Yet, if such
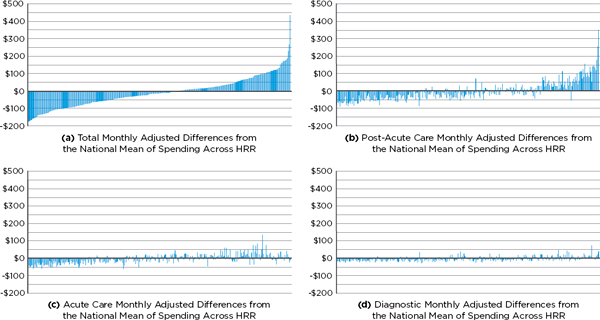
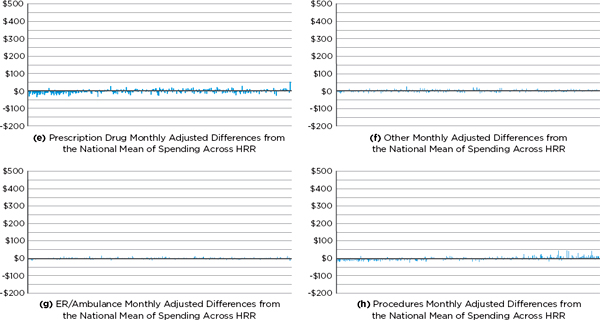
FIGURE 2-5a–h Medicare service category utilization (monthly cost residual) by hospital referral region (HRR).
NOTE: In this analysis, utilization is measured as the the total per-member-per-month input-price-adjusted cost (the dollar amounts shown at the left of each figure). The predictor variables include beneficiary age; sex; age-sex interaction; race; health status coded by hierarchical condition category; partial-year enrollment; and indicators for supplemental Medicare insurance, institutionalization status, new enrollee status (prior-year diagnoses are not available for them), dual-enrollment status, and year of analysis (2007, 2008, 2009). Selected results displaying the residual total post-acute and acute care costs for all 306 HRRs are available in Appendix G.
SOURCE: Acumen, LLC, 2013a.
TABLE 2-10
Proportion of Variance Attributable to Each Medicare Service Category
| Adjusted Total Medicare Spending | |||
| Remaining Variance |
Reduction in Variance (%)* |
||
| Variation in Total Medicare Spending | 6,974 | — | |
| If No Variation in Post-Acute Care Only | 1,864 | 73 | |
| If No Variation in Acute Care Only | 5,085 | 27 | |
| If No Variation in Either Post-Acute or Acute | 780 | 89 | |
| If No Variation in Prescription Drugs | 6,374 | 9 | |
| If No Variation in Diagnostic Tests | 5,986 | 14 | |
| If No Variation in Procedures | 6,020 | 14 | |
| If No Variation in Emergency Department Visits/Ambulance Use | 6,972 | 0 | |
| If No Variation in Other | 6,882 | 1 | |
NOTE: Total Medicare spending and each component are input-price- and risk-adjusted. Each row shows the reduction in variance from eliminating only the variation in that service, with the exception of the acute and post-acute care rows.
*The individual reductions sum to more than 100 percent because of covariance terms.
SOURCE: Committee analysis of Medicare data.
counties were penalized for being low-value, all legitimate providers in those counties would bear the consequences.
Conclusion 2.4. Variation in total Medicare spending across geographic areas is driven largely by variation in the utilization of post-acute care services, and to a lesser extent by variation in the utilization of acute care services.
LIMITATIONS OF EFFORTS TO MEASURE VARIATION IN QUALITY
Health care quality “composite measures” allow measurement of multiple aspects of quality by collapsing individual measures to create a single score (NQF, 2009). Composite quality indicators, developed and maintained by the Agency for Healthcare Research and Quality (AHRQ), are based largely on administrative data (billing- or claims-related information), with inclusion and exclusion criteria being based on diagnosis or procedure codes. The committee’s commissioned analyses evaluated quality
TABLE 2-11
Wide Variation in Spending for Durable Medical Equipment and Home Health Care in Contiguous Florida Counties
| Area | DME Spending per Capita ($) | Home Health Care Spending per Capita ($) | ||
| 2006 | 2008 | 2006 | 2008 | |
| South Florida County | ||||
| Broward | 394 | 321 | 1,002 | 1,390 |
| Collier | 207 | 202 | 305 | 395 |
| Miami-Dade | 2,043 | 828 | 2,591 | 5,318 |
| Monroe | 237 | 210 | 237 | 334 |
| National | 263 | 282 | 382 | 488 |
NOTES: DME = durable medical equipment. Spending data are annualized for beneficiaries with either Part A or Part B coverage for at least 1 month during 2006. The results are not adjusted for differences in beneficiaries’ health status or prices. In March 2007, the U.S. Department of Justice, the U.S. Attorney’s Office for the Southern District of Florida, the Department of Health and Human Services (HHS), OIG, and state and local law enforcement launched the Medicare Fraud Strike Force in South Florida. In its early stages, the task force targeted fraud in HIV infusion therapy and DME (DOJ, 2013; Katz, 2012), which may explain the significant drop in DME spending observed between 2006 and 2008 in Miami-Dade County.
SOURCE: MedPAC, 2011, p. 11.
of care using both individual measures and the following nationally established composite quality indicators:
• Prevention Quality Indicator (PQI) #90: Reflects the quality of ambulatory care in preventing medical complications for both acute and chronic illness.
• Inpatient Quality Composite Indicator (IQI) #91: Reflects the quality of care delivered in an inpatient hospital setting, and includes mortality indicators, as well as procedures for which there is a question of inefficient use.
• Patient Safety Indicator (PSI) #90: Reflects the quality of care within a hospital, particularly as it relates to potentially preventable surgical complications or iatrogenic events.
• Pediatric Quality Indicator (PDI) #19: Reflects the quality of care among the pediatric population.
Although these national quality indicators represent the “current state of the art in assessing the health care system as a whole,” performance measures based on administrative data have a number of limitations (Farquhar, 2008). For instance, the complex association between preventive care in an outpatient setting (PQI) and beneficiary socioeconomic status often
complicates an assessment of regional variation because such factors as patient access to care, patient preferences, and other unmeasured barriers in traditionally underserved populations cannot be accounted for (AHRQ, 2007a). Measurement of preventable complications (PSI) may be limited by inaccuracies within the underlying data, as providers who fear negative consequences are unlikely to maintain a thorough record of preventable complications in their patients (AHRQ, 2007b). As discussed previously, studies have established differences in coding practices among physicians, as well as among hospitals, making a fair comparison of hospitals (based on IQI) difficult. Moreover, administrative data are “clinically vague,” as the same diagnosis code may be applied to a heterogeneous pool of clinical states. As a result, risk adjustment of administrative claims is likely to be imperfect, and this may affect the measurement of quality.
As discussed earlier, although the subcontractors’ regression analyses risk adjust for certain known predictors (including age, sex, and health status), a number of unmeasured factors may account for variation in quality across areas.16 This report does not quantify the amount of geographic variation in health care quality as it does for spending and utilization because of limitations in the measurement of quality composites and the underlying data. All of the commissioned analyses report on two measures of health care quality—PSI and PQI. The Harvard and Lewin analyses each include quality measures that are “rare” among commercially insured populations. Although previous research has noted some differences in quality patterns across the United States (MedPAC, 2003), greater emphasis has been placed on studying relationships among quality, overall spending and “high value.” In Chapter 4, the committee evaluates the use of a geographically based value index and further explores the empirical interrelationships among quality of care and health care spending and utilization across Medicare and private payers.
This study represents the largest-scale analysis of geographic variation in health care spending in the United States, covering Medicare and representative private payer populations. The availability of and access to CMS’s complete Medicare (Parts A, B, C, and D) claims database were instrumental to the successful completion of this research. As discussed previously, however, the lack of access to encounter claims information for Medicare
_________________
16The subcontractors all followed AHRQ guidelines but used varying methodologies to calculate quality composites. Refer to Appendix C for a brief summary and to the Acumen, Lewin, and Harvard reports for complete details. (Subcontractor reports can be accessed through the Institute of Medicine website at http://www.iom.edu/geovariationmaterials.)
and Medicaid managed care enrollees during the 2007-2009 period limits the generalizability of the study findings. Although CMS has in recent years made an effort to improve and simplify the process of obtaining historical data, significant operational, procedural, and financial barriers continue to exist. Congress could help remove these barriers by supporting CMS’s efforts to expand the availability of Medicare and Medicaid data for research purposes, with particular emphasis on releasing previously unavailable or limited Medicare Part C and D data. For its part, CMS could use its existing authority to broaden data access for the purposes of primary research and evaluation while safeguarding patient privacy and maintaining standards established by the Social Security Act, the Health Insurance Portability and Accountability Act (HIPAA) Privacy Rule, the Privacy Act of 1974, and the Federal Information Security and Management Act of 2002 (FISMA).
As noted in earlier sections of this chapter, current understanding of health care utilization and quality is limited as it depends on information available in administrative (claims and billing) data, which do not capture the extent or severity of a patient’s illness. CMS could enrich claims databases by better adjusting for population health and could assist in the creation of more accurate quality measures by creating a platform for clinical and behavioral information (e.g., electronic medical records).
More research on health care outcomes and quality is needed, particularly for commercially insured populations. To date, many nationally established quality composite measures have been designed to measure process and outcomes in the Medicare population and are not necessarily applicable to privately insured beneficiaries. Although in its estimate of total health care spending in the United States, PHE attempted to include estimates from Medicare, Medicaid, and commercial payers, as well as the uninsured, the generalizability of this analysis is limited. Further research on this topic is needed and would benefit from the availabilty of a national-level all-payer database. Moreover, combined use of Medicare and private administrative or claims data would allow for more accurate measurement of provider performance and quality of care. Collaboration between CMS and private payers would be an important first step toward creating an enriched national data source.
RECOMMENDATION 1: Congress should encourage the Centers for Medicare & Medicaid Services (CMS), and provide the necessary resources, to make accessing Medicare and Medicaid data easier for research purposes. CMS should collaborate with private insurers to collect, integrate, and analyze standardized data on spending, as well as clinical and behavioral health outcomes, to enable more extensive comparisons of payments and quality and evaluation of value-based payment models across payers.
Acumen, LLC. 2009. Revision of Medicare Wage Index—Final Report: Part I. Burlingame, CA.
———. 2013a. Geographic variation in spending, utilization and quality: Medicare and Medicaid beneficiaries. Washington, DC: Institute of Medicine.
———. 2013b. IOM study of geographic variation: Growth analysis. Washington, DC: Institute of Medicine.
Adler, N. E., and K. Newman. 2002. Socioeconomic disparities in health: Pathways and policies. Health Affairs 21(2):60-76.
AHRQ (Agency for Healthcare Research and Quality). 2007a. AHRQ guide to prevention quality indicators: Hospital admission for ambulatory sensitive conditions. Edited by U.S. Department of Health and Human Services. Rockville, MD.
———. 2007b. AHRQ guide to patient safety indicators. Edited by U.S. Department of Health and Human Services. Rockville, MD, March 12.
American Hospital Association. 2009. Geographic variation in health care spending: A closer look. In Trend Watch. Washington, DC: American Hospital Association.
———. 2011. Report of the Task Force on Variation in Health Care Spending. Washington, DC: American Hospital Association.
Anthony, D. L., M. B. Herndon, P. M. Gallagher, A. E. Barnato, J. P. Bynum, D. J. Gottlieb, E. S. Fisher, and J. S. Skinner. 2009. How much do patients’ preferences contribute to resource use? Health Affairs 28(3):864-873.
ASPE (Assistant Secretary for Planning and Evaluation). 2011. Overview of the uninsured in the United States: A summary of the 2011 current population survey. ASPE Issue Brief. http://aspe.hhs.gov/health/reports/2011/cpshealthins2011/ib.shtml (accessed July 18, 2013).
Autor, D., A. Chandra, and M. Duggan. 2011. Public health expenditures on the working age disabled: Assessing Medicare: Public health expenditures on the working age disabled: Assessing Medicare. Cambridge, MA: National Bureau of Economic Research.
Baicker, K., and A. Chandra. 2004. Medicare spending, the physician workforce, and beneficiaries’ quality of care. Health Affairs Supplemental Web Exclusives W4-184-97.
Baicker, K., A. Chandra, J. S. Skinner, and J. E. Wennberg. 2004. Who you are and where you live: How race and geography affect the treatment of Medicare beneficiaries. Health Affairs Supplemental Variation 33-44.
Baicker, K., A. Chandra, and J. S. Skinner. 2005. Geographic variation in health care and the problem of measuring racial disparities. Perspectives in Biology and Medicine 48(Suppl. 1):S42-S53.
Baker, L. C., M. K. Bundorf, and D. P. Kessler. 2010. HMO coverage reduces variations in the use of health care among patients under age sixty-five. Health Affairs 29(11):2068-2074.
Barnato, A. E., M. B. Herndon, D. L. Anthony, P. M. Gallagher, J. S. Skinner, J. P. Bynum, and E. S. Fisher. 2007. Are regional variations in end-of-life care intensity explained by patient preferences? A study of the US Medicare population. Medical Care 45(5):386-393.
Bernstein, J., J. D. Reschovsky, and C. White. 2011. Geographic variation in health care: Changing policy directions. Washington, DC: National Institute for Health Care Reform.
Berwick, D. M., and A. D. Hackbarth. 2012. Eliminating waste in U.S. health care. Journal of the American Medical Association 307(14):1513-1516.
Buntin, M. B., A. D. Garten, S. Paddock, D. Saliba, M. Totten, and J. J. Escarce. 2005. How much is postacute care use affected by its availability? Health Services Research 40(2):413-434.
Case, A., and A. S. Deaton. 2005. Broken down by work and sex: How our health declines. In Analyses in the economics of aging. Chicago, IL: University of Chicago Press. Pp. 185-212.
CBO (Congressional Budget Office). 2008. Geographic variation in health care spending. Washington, DC: Congress of the United States, CBO.
Chernew, M. E., L. Sabik, A. Chandra, and J. P. Newhouse. 2009. Would having more primary care doctors cut health spending growth? Health Affairs (Millwood) 28(5):1327-1335.
Chernew, M. E., L. M. Sabik, A. Chandra, T. B. Gibson, and J. P. Newhouse. 2010. Geographic correlation between large-firm commercial spending and Medicare spending. American Journal of Managed Care 16(2):131-138.
CMS (Centers for Medicare & Medicaid Services). 2012. Wage index. http://www.cms.gov/Medicare/Medicare-Fee-for-Service-Payment/AcuteInpatientPPS/wageindex.html (accessed March 29, 2013).
Cummins, R. O. 1993. Emergency medical services and sudden cardiac arrest: The “chain of survival” concept. Annual Review of Public Health 14(1):313-333.
Cunningham, P. J. 2006. What accounts for differences in the use of hospital emergency departments across U.S. communities? Health Affairs (Millwood) 25(5):w324-w336.
Cutler, D. M., and L. Sheiner. 1999. The geography of Medicare. American Economic Review 89(2):228-233.
Cutler, D., J. Skinner, D. Stern, and D. Wennberg. 2013. Physician beliefs and patient preferences: A new look at regional variation in spending. https://www.lafollette.wisc.edu/research/health_economics/Stern.pdf (accessed July 18, 2013).
Dartmouth Institute for Health Policy and Clinical Practice. 2013. The Dartmouth Atlas of Health Care. http://www.dartmouthatlas.org (accessed July 18, 2013).
DeNavas-Walt, C., B. D. Proctor, and J. C. Smith. 2009. Income, poverty, and health insurance coverage in the United States: 2009. Washington, DC: U.S. Census Bureau.
DOJ (Department of Justice). 2013. Health care fraud and abuse control program: Annual report for fiscal year 2012. Washington, DC.
Donohue, J. M., N. E. Morden, W. F. Gellad, J. P. Bynum, W. Zhou, J. T. Hanlon, and J. Skinner. 2012. Sources of regional variation in Medicare Part D drug spending. New England Journal of Medicine 366(6):530-538.
Dunn, A., A. H. Shapiro, and E. Liebman. 2012. Geographic variation in commercial medical (care expenditures: A framework for decomposing price and utilization. http://www.bea.gov/papers/pdf/RegionalPriceVariation_7_17_11Final.pdf (accessed July 18, 2013).
Farley, P. J. 1985. Who are the underinsured? Milbank Memorial Fund Quarterly. Health and Society 476-503.
Farquhar, M. 2008. AHRQ quality indicators. Edited by R. Hughes, Patient safety and quality: An evidence-based handbook for nurses. Rockville, MD: Agency for Healthcare Research and Quality.
Finkelstein, A., S. Taubman, B. Wright, M. Bernstein, J. Gruber, J. P. Newhouse, H. Allen, K. Baicker, and the Oregon Health Study Group. 2012. The Oregon health insurance experiment: Evidence from the first year. The Quarterly Journal of Economics 127:1057-1106. Fiscella, K., P. Franks, M. R. Gold, and C. M. Clancy. 2000. Inequality in quality. Journal of the American Medical Association 283(19):2579-2584.
Fisher, E. S., and J. E. Wennberg. 2003. Health care quality, geographic variations, and the challenge of supply-sensitive care. Perspectives in Biology and Medicine 46(1):69-79.
Fisher, E. S., J. E. Wennberg, T. A. Stukel, and S. M. Sharp. 1994. Hospital readmission rates for cohorts of Medicare beneficiaries in Boston and New Haven. New England Journal of Medicine 331(15):989-995.
Fisher, E. S., D. E. Wennberg, T. A. Stukel, D. J. Gottlieb, F. L. Lucas, and E. L. Pinder. 2003a. The implications of regional variations in Medicare spending. Part 1: The content, quality, and accessibility of care. Annals of Internal Medicine 138(4):273-287.
———. 2003b. The implications of regional variations in Medicare spending. Part 2: Health outcomes and satisfaction with care. Annals of Internal Medicine 138(4):288-298.
Fisher, E. S., J. P. Bynum, and J. S. Skinner. 2009. Slowing the growth of health care costs— Lessons from regional variation. New England Journal of Medicine 360(9):849-852.
Fowler, F. J., P. M. Gallagher, D. L. Anthony, K. Larsen, and J. S. Skinner. 2008. Relationship between regional per capita Medicare expenditures and patient perceptions of quality of care. Journal of the American Medical Association 299(20):2406-2412.
Franzini, L., O. I. Mikhail, and J. S. Skinner. 2010. McAllen and El Paso revisited: Medicare variations not always reflected in the under-sixty-five population. Health Affairs 29(12):2302-2309.
Frick, A. P., S. G. Martin, and M. Shwartz. 1985. Case-mix and cost differences between teaching and nonteaching hospitals. Medical Care 283-295.
Fuchs, V. R., M. B. McClellan, and J. Skinner. 2001. Area differences in utilization of medical care and mortality among U.S. elderly. NBER Working Paper 8628. Cambridge, MA: National Bureau of Economic Research.
GAO (Government Accountability Office). 2009. Medicare physician services: Utilization trends indicate sustained beneficiary acess with high and growing levels of service in some areas of the nation. Washington, DC: Government Printing Office.
Gold, M. 2004. Geographic variation in Medicare per capita spending: Should policy-makers be concerned? In The synthesis project: New insights from research results. Princeton, NJ: Robert Wood Johnson Foundation.
Gold, M., G. Jacobson, A. Damico, and T. Neuman. 2013. Medicare Advantage 2013 spotlight: Enrollment market update. Kaiser Family Foundation 8448:2.
Goldman, T. R. 2012. Health policy brief: Eliminating fraud and abuse. Health Affairs, July 31.
Gottlieb, D. J., W. Zhou, Y. Song, K. G. Andrews, J. S. Skinner, and J. M. Sutherland. 2010. Prices don’t drive regional Medicare spending variations. Health Affairs 29(3):537-543.
Harvard University. 2012. Geographic variation in health care spending, utilization, and quality among the privately insured. Washington, DC: Institute of Medicine.
Hsu, J., J. Huang, V. Fung, M. Price, R. Brand, R. Hui, B. Fireman, W. Dow, J. Bertko, and J. P. Newhouse. 2009. Distributing $800 billion: An early assessment of Medicare Part D risk adjustment. Health Affairs 28(1):215-225.
Kane, R. L., W. C. Lin, and L. A. Blewett. 2002. Geographic variation in the use of post-acute care. Health Services Research 37(3):667-682.
Katz, P. 2012. Medicare fraud strike force: Past, present, and future. Fraud and Abuse 1(1):1-4.
Manning, W. G., E. C. Norton, and A. S. Wilk. 2012. Explaining geographic variation in health care spending, use and quality, and associated methodological challenges. Paper commissioned by the Committee on Variation in Health Care Spending and Promotion of High-Value Care, Institute of Medicine, Washington, DC. http://www.iom.edu/Reports/2013/Variation-in-Health-Care-Spending-Target-Decision-Making-Not-Geography/~/media/Files/Report%20Files/2013/Geographic-Variation2/Commissioned-Papers/Manning_Norton_Wilk.pdf (accessed August 29, 2013).
MedPAC (Medicare Payment Advisory Commission). 2003. Variation and innovation in Medicare. In Report to the Congress: June 2003. Washington, DC: MedPAC.
———. 2008. Reforming the delivery system. In Report to the Congress: June 2008. Washington DC: MedPAC.
———. 2009. Measuring regional variation in service use. In Report to the Congress: December 2009. Washington, DC: MedPAC.
———. 2011. Regional variation in Medicare service use. In Report to the Congress: January 2011. Washington, DC: MedPAC.
———. 2012. Health care spending and the Medicare program. Washington, DC: MedPAC.
Newhouse, J., and Insurance Experiment Group. 1993. Free for all? Lessons from the RAND health insurance experiment, commercial books. Cambridge, MA: Harvard University Press.
NQF (National Quality Forum). 2009. National Quality Forum approves criteria for evaluating composite measures. http://www.qualityforum.org/Publications/2013/04/Composite_Performance_Measure_Evaluation_Guidance.aspx (accessed December 30, 2011).
OIG (Office of Inspector General). 2012. CMS and contractor oversight of home health agencies. Washington, DC: OIG.
OMB (Office of Management and Budget). 2010. 2010 standards for delineating metropolitan and micropolitan statistical areas; notice. Federal Register 75(123):37246-37252.
———. 2013. Revised delineations of metropolitan statistical areas, micropolitan statistical areas, and combined statistical areas, and guidance on uses of the delineations of these areas. http://www.whitehouse.gov/sites/default/files/omb/bulletins/2013/b13-01.pdf (accessed March 31, 2013).
PHE (Precision Health Economics, LLC). 2013. Geographic variation in health care spending and the promotion of high-value care. Washington, DC: Institute of Medicine.
Pine, M., H. S. Jordan, A. Elixhauser, D. E. Fry, D. C. Hoaglin, B. Jones, R. Meimban, D. Warner, and J. Gonzales. 2007. Enhancement of claims data to improve risk adjustment of hospital mortality. Journal of the American Medical Association 297(1):71-76.
Radley, D. 2012. Geographic variation in access to care—The relationship with quality. New England Journal of Medicine 367(1):3-6.
Reschovsky, J. D., J. Hadley, C. B. Saiontz-Martinez, and E. R. Boukus. 2011. Following the money: Factors associated with the cost of treating high-cost Medicare beneficiaries. Health Services Research 46(4):997-1021.
Sirovich, B. E., D. J. Gottlieb, H. G. Welch, and E. S. Fisher. 2005. Variation in the tendency of primary care physicians to intervene. Archives of Internal Medicine 165(19):2252-2256.
Sirovich, B., P. M. Gallagher, D. E. Wennberg, and E. S. Fisher. 2008. Discretionary decision making by primary care physicians and the cost of U.S. health care. Health Affairs 27(3):813-823.
Song, Y., J. Skinner, J. Bynum, J. Sutherland, J. E. Wennberg, and E. S. Fisher. 2010. Regional variations in diagnostic practices. New England Journal of Medicine 363(1):45-53.
Steinwald, A. B. 2003. Specialty hospitals: Information on national market share, physician ownership, and patients served. Letter to the Honorable Bill Thomas, Chairman, Committee on Ways and Means, House of Representatives and the Honorable Jerry Kleczka, House of Representatives. April 18, 2003.
Sutherland, J. M., E. S. Fisher, and J. S. Skinner. 2009. Getting past denial—The high cost of health care in the United States. New England Journal of Medicine 361(13):1227-1230.
The Lewin Group. 2013. Geographic variation in health care spending and promotion of high-value care. Washington, DC: Institute of Medicine.
University of Pittsburgh. 2013. Geographic variation in health care spending and promotion of high-value health care Medicare Part D. Washington, DC: Institute of Medicine.
Welch, W. P., M. E. Miller, H. G. Welch, E. S. Fisher, and J. E. Wennberg. 1993. Geographic variation in expenditures for physicians’ services in the United States. New England Journal of Medicine 328(9):621-627.
Wennberg, J. E., and M. M. Cooper. 1998. The surgical treatment of common diseases. In Dartmouth Atlas of Health Care 1998. Chicago, IL: American Hospital Publishing. Pp. 108-111.
———. 1999. The quality of medical care in the United States: A report on the Medicare program. The Dartmouth Atlas of Health Care 1999. Hanover, NH and Chicago, IL: Dartmouth Medical School and American Hospital Association.
Wennberg, J. E., E. S. Fisher, and J. S. Skinner. 2002. Geography and the debate over Medicare reform. Health Affairs Supplemental Web Exclusives W96-W114.
Wennberg, J. E., E. S. Fisher, T. A. Stukel, J. S. Skinner, S. M. Sharp, and K. K. Bronner. 2004. Use of hospitals, physician visits, and hospice care during last six months of life among cohorts loyal to highly respected hospitals in the United States. British Medical Journal 328(7440):607.
Wennberg, J. E., S. Brownlee, E. S. Fisher, J. S. Skinner, and J. N. Weinstein. 2008. An agenda for change: Improving quality and curbing health care spending: Opportunities for the Congress and the Obama administration. Hanover, NH: Dartmouth Institute for Health Policy and Clinical Practice.
Yuan, Z., G. S. Cooper, D. Einstadter, R. D. Cebul, and A. A. Rimm. 2000. The association between hospital type and mortality and length of stay: A study of 16.9 million hospitalized Medicare beneficiaries. Medical Care 38(2):231.
Zuckerman, S., T. Waidmann, R. Berenson, and J. Hadley. 2010. Clarifying sources of geographic differences in Medicare spending. New England Journal of Medicine 363(1): 54-62.
Zuckerman, S., T. A. Waidmann, and E. Lawton. 2011. Undocumented immigrants, left out of health reform, likely to continue to grow as share of the uninsured. Health Affairs 30(10):1997-2004.


