
Model-Based Approaches for the Gnda
D.1 INTRODUCTION
Modeling and simulation are useful when
• the system/architecture performance is very important;
• the system/architecture is too complex to intuitively assess performance; and
• significant time and resources are required to improve performance.
The GNDA meets all of these conditions. Mathematical models have been used in many domains to support system/architecture design, performance evaluation, and resource allocation decision making. The purpose of this chapter is to present the potential for GNDA mathematical models to describe the architecture, evaluate the effectiveness, and support resource allocation decision making to increase GNDA effectiveness.
D.2 RATIONALE FOR GNDA MODELING
Mathematical models are developed for many different reasons. For example, sometimes models are derived as compact and precise statements of basic truths (e.g., physics). Sometimes models are created to explore the logical consequences of alternative conjectures about how certain systems behave (e.g., population biology). Sometimes models are employed to summarize statistical information about the past to create forecasts of the future (e.g., macroeconomics). And sometimes models are constructed to provide a framework for better decision making (e.g., operations research).
In thinking about how to evaluate the effectiveness of something as complicated as the GNDA, modeling has much to offer. First, by combining the detection characteristics of GNDA resources (e.g., sensors, human agents) with the physical deployment of such resources, it is possible to model the probability (and risk consequences) of nuclear material out of regulatory control entering the United States. Constructing such models serves the purpose of linking GNDA resource inputs and program activities to the primary outcomes of interest—interdiction and the risk consequences of failing to detect radiological or nuclear material. Second, such models can help identify appropriate performance measures for evaluating the effectiveness of the GNDA by identifying (via model analysis) the key variables that are associated with maximal detection and minimal risk. Third, models can help evaluate alternative hypotheses regarding effective GNDA design by comparing the modeled detection and risk outcomes of competing resource deployments. And fourth, by attaching appropriate costs to the different resources deployed, models can help identify the most efficient resource deployment at various budget levels.
The approach to modeling suggested above, with its emphasis on linkages between deployment of available resources and principal system objectives, has been and continues to be employed in support of major business and military decisions. By way of example, the next section reviews some applications of decision-oriented operations research modeling to selected military problems with the hope of convincing the reader that similar models could be developed to help evaluate the effectiveness of the GNDA.
D.3 EXAMPLES FROM ELSEWHERE
Modeling and simulation play an important role in defense analysis and support to decision makers. Military planning models exist at several levels: component, system, force structure (architectures), and campaigns. The models are used for force mission planning and force structure planning.
For example, consider strategic airlift to support a military campaign. Component models exist of aircraft airframes to estimate drag and fuel consumption. System models exist to calculate the time to deliver a plane’s cargo to a destination. Force structure models exist to calculate the time to deploy a force (people and equipment) for a mission. Finally, campaign models exist to determine the time to achieve the campaign objectives given the force available and the potential actions of the adversary. For force structure planning, the models are used to help determine the best mix of aircraft (e.g., tactical and strategic) and an affordable amount of airlift capability given the potential threats our nation might face on the strategic planning horizon. In both cases, the models do not make decisions but,
rather, they inform the analysts, strategic planners, and decision makers. Additional examples can be found within the report.
D.4 GNDA-SPECIFIC CONCERNS
Any focused modeling application must be responsive to the specifics of the system under study. This is certainly true of the GNDA. As discussed elsewhere in this report, the GNDA is a three-layered architecture—the internal (or domestic) layer, the U.S. border layer, and the international layer. Responsibility for each layer rests with different agencies. It is therefore convenient to think about detection/interdiction and risk consequences as a function of GNDA activities and resource deployments within each of these three layers first, and then use the layer-specific analyses to create an overall model for the GNDA.
The GNDA does not have a centrally managed budget. Rather, each of the agencies that participates in the GNDA determines which of its activities qualify as GNDA-related, what resources are devoted to those activities, and how much they cost. These determinations are historical in nature, that is, “after-the-fact” estimates of how much money was spent on various GNDA activities. Although these agency contributions have been totaled to produce what looks like the total GNDA budget, there is no prospective procedure that determines how much money the government allocates to the GNDA. The GNDA thus operates under what could be called an best-effort budget. This is important to note, because in thinking about the GNDA, it may not be possible to optimally allocate the resources of this best-effort budget across different activities in a way that would change the contributions of participating agencies to the overall budget. This does not imply that modeling optimal GNDA resource allocation is without purpose, however, because the gap between extant and optimal resource allocation will provide a measure of the cost of operating the GNDA in the manner chosen.
Another GNDA-specific concern is that the risks the system is trying to minimize (nuclear materials out of regulatory control entering the United States) derive in the main from the actions of intelligent adversaries such as terrorists or hostile states. If such adversaries are intent upon attacking the United States with nuclear or radiological materials, then surely they will adapt their behavior given changes in GNDA resource deployments to better achieve their goals. There are different choices possible for how such adaptive behavior should be modeled. Traditional game theory models adopt a “worst case” viewpoint that essentially grants adversaries perfect foresight, while less pessimistic approaches presume that potential attackers know some things but not others about GNDA activities (or know about resource deployments of different assets with different probabilities). None
of these frameworks are comparable to the “human vs. nature” models that characterize risk analysis for naturally occurring threats such as floods, earthquakes, or epidemics, for example, and so it is important to think hard about the adversarial nature of the risks that the GNDA seeks to mitigate.
D.5 POTENTIAL MODELING APPLICATIONS FOR THE GNDA
In the section that follows the committee develops some simple examples for the purpose of illustrating insights that one can gain from modeling and, at a basic level, some of the thought processes involved. It is not meant to provide a complete set of models that should be developed. Later, we discuss the availability of and need for more advanced modeling methods to help evaluate the GNDA.
D.5.1 Descriptive Modeling
The first task when modeling any system is to understand the basic relationships among inputs, processes, and outputs. Such models are descriptive in nature, are meant to help understand how the system in question actually works, and also serve as building blocks for downstream decision-oriented models that address resource allocation or other issues.
In thinking about the GNDA, one set of descriptive models would seek to answer the following basic question: Given a particular physical deployment of agents and sensors in a particular setting (e.g., a port, border crossing, along a highway), what is the likelihood that the entry of nuclear or radiological material out of regulatory control into the area of interest would be detected? As an extremely simple example, suppose that each of n sensors is capable of detecting a threat with probability p, and that detection is independent across sensors. Then the probability that a threat would be detected via the deployment of n sensors would equal 1 – (1 – p)n, a graph of which appears in Figure D-1 the assumption that each sensor detects with probability 0.2.
D.5.2 Sensor Quality
One of the Domestic Nuclear Detection Office’s (DNDO’s) missions is to develop new sensor technologies (see DNDO acting director’s statement to Congress in July 2012).1 Once we have a descriptive model, we use the model as a tool to evaluate potential new sensor capabilities by assessing the impact on the system performance measure, probability of detection, of
_____________
1 The written statement from Dr. H.A. Gowadia, DHS, provided July 26, 2012 can be accessed at http://homeland.house.gov/sites/homeland.house.gov/files/Testimony-Gowadia.pdf.
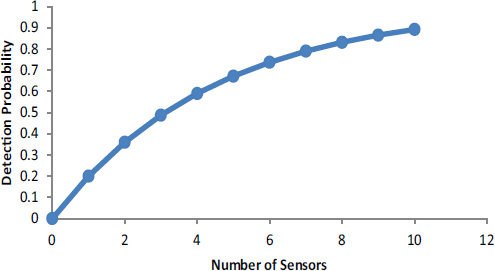
FIGURE D-1 Detection Probability as a function of the number of deployed sensors. This is an illustration of diminishing returns, in that doubling the number of sensors increases the detection probability by less than a factor of 2. The model is perhaps the simplest that can be envisioned, but the important point is to see how a model links inputs (the number of sensors) to outputs (in this case the probability of detection). Figure D-1, editable
the extant systems with potential sensor improvements. Returning to our sensor system model, above, with a probability of detection of 0.2, suppose we want to assess the of system capability improvement of increasing the probability of detection to 0.3 or 0.4. Suppose the system goal was a probability of detection of 0.8. How many of each sensor would be required to achieve the goal?
To achieve a system probability of detection of 0.8, we would require eight of the P = 0.2 sensors, five of the P = 0.3 sensors, and about three of the P = 0.4 sensors. The model in Figure D-2 is very simple; it is intended to show how a model links inputs (the number of sensors and sensor performance) to outputs (in this case the probability of detection).
D.5.3 False Positive Versus False Negative Errors
When we model sensors we need to consider false negative and false positive errors. For GNDA, a false negative error is the probability of not detecting nuclear or radioactive material when it is present; that is, the sensor does not alarm when threat material is present (also called a missed detection or a false negative). A false positive error is the probability of a
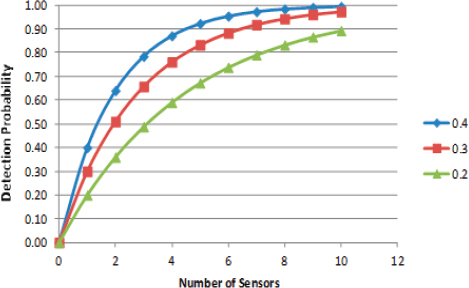
FIGURE D-2 Detection Probability as a function of the number of deployed sensors of varying performance. Like Figure D-1, this figure illustrates diminishing returns, but more rapidly for the better-performing sensors.
false detection; that is, the sensor indicates detection when the material is not present in sufficient quantity. While GNDA is primarily concerned with minimizing false negative errors for preventing the illicit transport of nuclear or radiological material, false positive errors can significantly increase the detection cost and impose a burden on the organization whose vehicle or container created the a false detection. Unfortunately, false positive and false negative errors cannot be simultaneously reduced. For example, if we lower the detection threshold to reduce the probability of missing a valid detection (a false negative error), we increase the probability of false detection (false positive errors).
The number of false positive errors can be significant for low-prevalence events. A numerical example can help to illustrate the magnitude. Let T and NT be the presence or absence of, respectively, the nuclear/radioactive materials that could be a threat. Let D and ND refer to the probability that the sensor detects (alarms) or does not detect the material (does not alarm).
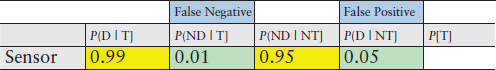
Suppose we are provided the data in Table D-1. The detection probabilities seem to be quite high. The probability of a false negative error is 0.01 and the probability of a false positive error is 0.05. Suppose that 1 in
TABLE D-1 Numerical Example Illustrating the Magnitude of False Negative and False Positive Errors for a Low-Prevalence Event
where
D = detect
ND = not detect (Type I)
T = threat present
NT = no threat present
P(D | T) = probability of detecting a potential threat
P(ND | T) = probability of not detecting a potential threat (a false negative error)
P(ND |NT) = probability of not detecting a non-threat (not alarming on a non-threat)
P(D |NT) = probability of detecting a non-threat (a false alarm error)
100,000 inspections contains the threat material. 2 Given we have a detection, what is our probability that we found the threat material?
This calculation can be done with Bayes’ Law; however, we will use a simpler calculation. Suppose there are 10,000,000 inspections. On average, there would be 100 inspections that find the threat material. The sensor would properly detect 99 of these and miss 1. However, of the 9,999,900 inspections without the threat material, 5 percent of the time or 499,995 detections would be false positives. Therefore, for any given detection, the probability of having the threat material would be only 0.02 percent [99/ (99 + 499,995)].
D.5.4 Resource Allocation Given Extant GNDA Capabilities
As discussed earlier, the GNDA functions with a best-effort budget that precludes efficient resource allocation and substitution; yet, within agencies or jurisdictions of different agencies participating in the GNDA, some flexibility is possible. Continuing with our simple example, suppose that a geographic area is subdivided into two zones A and B, and the participating GNDA agency is trying to decide how many of its 10 sensors it should deploy in zone A versus zone B. From current intelligence assessments, the agency believes that if an adversary were to attempt to bring illicit nuclear or radiological material into the area of interest, there is a conditional probability a that entry would occur in zone A and a complementary conditional probability b = 1 – a that entry would occur in zone B. This being the case, if the agency deployed n sensors in zone A and 10 – n sensors in zone B,
_____________
2 In an actual modeling study, this value would be determined by intelligence estimates.
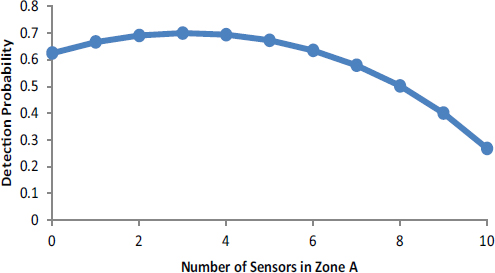
FIGURE D-3 Detection probability as a function of the number of sensors allocated to zone A (n) for the case where a = 0.3 (and b = 0.7) and P = 0.2.
then detection upon entry would occur with probability a [1 – (1 – P)n] + b [1 – (1 – P)10 – n]. A graph of this detection probability as a function of the number of sensors allocated to zone A (n) appears in Figure D-3 for the case where a = 0.3 (and b = 0.7) and, as before, P = 0.2. The key feature of this graph is that the probability of detection is highest when three sensors are placed in zone A and seven in zone B, which results in an overall detection probability of 70 percent. Clearly there are many ways of deploying the 10 sensors. This example shows how it is possible that even under the best-effort budget of extant resources it is possible to think about different deployments to improve the likelihood of detection or cost-effectiveness.
Cost-effectiveness is usually defined as the incremental (additional) cost required to achieve an incremental unit of performance. Operationalizing cost-effectiveness requires a measure (or measures) of effectiveness, and a costing model for the level of performance (effectiveness) that can be reached at different resource levels. To illustrate, consider the previous example that shows how to best allocate 10 sensors between two zones. Suppose that each sensor cost $100k/year to operate, so in total, $1M/year is being spent, and suppose also that there is one infiltration attempt per year. To maximize cost-effectiveness in this case means to minimize the cost per detected infiltration, which of course is achieved by maximizing the probability of detection. The example shows that placing three sensors in zone A and seven in zone B maximizes detection probability at 70 percent, thus, the cost per detected event equals $1M/.7 = $1.43 million per case de-
tected. Any other allocation would have a lower detection probability and thus a higher cost per detected event. For example, putting eight sensors in zone A and two in zone B would yield a detection probability of 0.5 and thus a cost per detected event of $1M/.5 = $2M. Clearly the first allocation is more cost-effective than the second.
Estimating the cost-effectiveness of the entire GNDA is a challenging task, because it requires determining (or more likely modeling) the cost and the effectiveness of alternative allocations of GNDA resources. Nonetheless, the principle is the same as in the simple example above.
D.5.5 Sensitivity Analysis
In many modeling applications, we may not be certain of the expert data, especially if the experts do not have a large number of historical incidents to assess. Suppose in our previous example, the intelligence analyst believed the probability of attack in zone A (a) could be 0.3 to 0.5. We can easily use our model to assess how sensitive our model is to that input data.
Figure D-4 shows the sensitivity of the probability of detection to the intelligence analysis assumption about the probability of attack in zone A versus zone B.
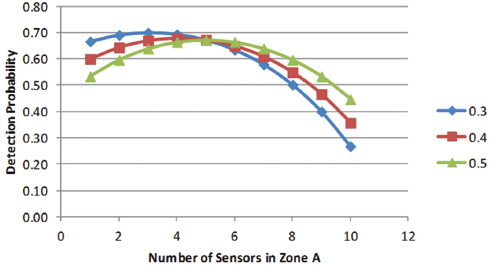
FIGURE D-4 Detection probability in two-zone, 10-sensor example illustrating the sensitivity of detection probability to intelligence estimates of probability of attack within a particular zone.
D.5.6 Intelligent Adversary
The example above treated the behavior of a terrorist as not reacting to GNDA actions to deploy sensors within zones A or B the same way one thinks of a weather forecast—there is a 30 percent chance of rain, and by the way, there is a 30 percent chance that illicit nuclear materials will be smuggled into zone A. Perhaps a more realistic approach is to recognize that if terrorists (or operatives from a rogue state) are intent upon bringing nuclear material into the country for the purpose of mounting an attack, such operatives are likely to have studied our defensive posture so that they can commit to a plan that is, from their vantage point, most likely to succeed. To see how such models can be constructed, suppose that the sensors in question are overt and easily observed (as is the case in large ports, for example). Then, from the defenders’ point of view, the worst case is that the terrorists know how many sensors are allocated to zone A versus zone B. In this game, the terrorists seek to minimize the chance that they will be detected. Thus, given any split of the sensors between zones A and B and assuming the terrorists are aware of the split, the terrorists will choose the zone with the lowest probability of detection, and the chance that the defender would detect entry reduces to the chance of detection in the zone with the fewest sensors.
If four or fewer sensors are deployed in zone A, then the terrorists will select zone A, but if six or more sensors are deployed in zone A, the terrorists will select zone B. The result that is best for the government, and at the same time worst for the terrorists, is to place five sensors in each zone. This serves to equalize the likelihood that the illicit materials will be detected; it is 67 percent in either zone (see Figure D-5). With this result, it does not matter if the terrorists select to infiltrate zone A or zone B (or if they choose to flip a coin to choose between A and B). This turns out to be a much more general proposition—when defending against intelligent adversaries, worst-case analysis requires defenders to minimize the terrorists’ maximum probability of success (or more generally the expected risk consequences of terrorist success including, for example, morbidity, mortality, economic, and political damage). To achieve this, defenders must equalize the payoffs to the terrorists across their various options. Achieving such equalization in payoffs produces a certain robustness, in that the likelihood and consequences of terrorist success are fixed no matter what the terrorists decide to do.
Again, to understand why this result must be correct, note that if the different terrorist options produce different payoffs, then just as in our example with zone A and zone B, terrorists will gravitate toward their most attractive option, which will be more rewarding to them (and damaging to us) than what can be achieved from equalizing the payoffs. Worst-case defense also provides a certain level of comfort when thinking about terror-
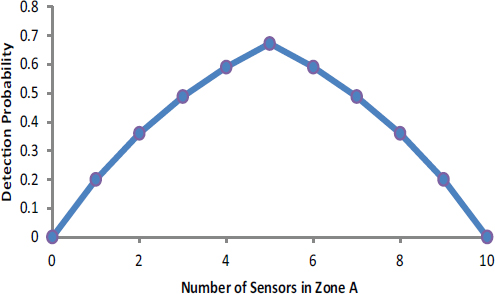
FIGURE D-5 Detection probability for the two-zone, 10-sensor example when an adversary has knowledge of resource allocation.
ism, because if it turns out that the terrorists are not as smart as imagined (i.e., they cannot see, our defenses perfectly and hence cannot choose optimally themselves), then whatever results actually occur will be less severe than conjectured in the modeling analysis.
However, for defenders to take advantage of terrorists’ lack of information requires “knowing just what they don’t know” (see Section 4.2 within the main body of the report). In the two-zone example above, if the defenders strongly believed that terrorists were likely to attack zone A with probability 0.3 and hence placed three sensors in A and seven in B, the defenders would think (from the analysis in the second example) that they would detect with probability 70 percent. But if the defenders were wrong in their assessment, smart terrorists would choose to infiltrate zone A, which contains only three sensors, with certainty (e.g., using insider information), so the probability of detection would shrink below 50 percent.
D.5.7 Extension to Risk Consequences and Randomization Defense
To illustrate how the ideas above extend beyond the probability of detection to risk consequences, consider Table D-2. For simplicity we presume that there are only four defensive agents (which could be human agents, sophisticated sensors, or both working together) to defend zones A and B. The table reports expected casualties in zone A or B as a function of the
TABLE D-2 Extension to Risk Consequences
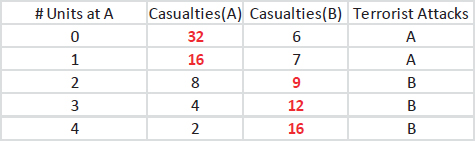
number of units (or defensive agents) deployed to zone A, along with the choice made by an intelligent terrorist. The terrorist, who observes the allocation and concludes that the best the defender seems able to do is to allocate two agents to each zone, would induce an attack in zone B with an expected nine casualties.
This seems inconsistent with the previous example where we argued that the defender should seek to equalize the attackers’ payoffs across the choices they face; in the present example, after allocating two agents to each zone, the attackers would expect eight casualties in A and nine in B, hence their decision to attack B. Is it possible for the defenders to do better? The answer is yes, and randomization provides the key. Suppose that instead of committing two agents to defend each of zone A and B, the defender randomized with probability 0.9 that two agents are assigned to zone A and two to zone B, and with probability 0.1 that one agent is assigned to A but three to B. As illustrated in the decision tree (Figure D-6), this randomization equalizes the expected casualties in zones A and B to 8.8, a modest reduction over the fixed deployment of two agents to each zone.
Should zone A be attacked, the expected casualties equal 0.9 × 8 + 0.1 × 16 = 8.8, whereas if zone B is attacked, expected casualties are given by 0.9 × 9 + 0.1 × 7, which again equals 8.8. Randomization is thus a powerful mechanism for defending against strategic attackers. We note that randomization is already employed in homeland defense: U.S. Air Marshals are randomly rotated across flights, while defensive patrols at Los Angeles Airport are also randomized to better defend against terrorist attacks (Jain et al., 2010).
D.5.8 Resource Allocation Modeling
In the examples above, the allocation decisions faced by defenders all involved the placement of different numbers of otherwise equivalent sensors or agents in different zones. Recall that such examples were motivated by
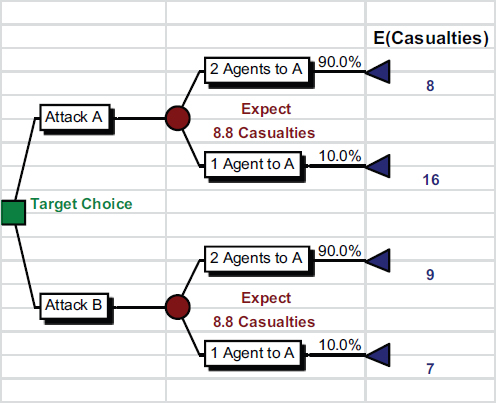
FIGURE D-6 Decision tree illustrating that randomization equalizes the expected casualties in zones A and B to 8.8.
the idea that within a given jurisdiction, some lead agency with fixed physical resources (such as agents or sensors) might still face some flexibility in how to deploy those resources. To see how the same resource allocation logic can apply when there are multiple resources with different unit costs available for GNDA use, suppose that there are some number m of different resource types (e.g., sensors with different costs and different sensitivity and specificity [equivalently different likelihoods of committing false negative and false positive errors as discussed previously]), and that there are also some number n of distinct detection or interdiction tasks (where “task” could mean “detect a specific threat type” or “detect any threat in a given geographical location”). Let xij denote the number of units of type i resources that are allocated to task j. We refer to xij as decision variables because assigning numbers to such variables is equivalent to deciding how many type i resources to allocate to task j. If cij represents the cost of allocating one unit of resource i to task j, then cijxij is the cost of this particular decision. Summing cijxij over all i (between 1 and m) and j (between 1 and
n) then yields the total cost of making all decisions that allocate resources to tasks. Presumably this sum cannot exceed the total budget available for the set of tasks under consideration. Also, because we are dealing with physical resources, each of the decision variables xij must be nonnegative, while there are likely additional constraints governing the total number of resources available by type. A proposed resource allocation plan as implied by assigned numerical values of the decision variables is said to be feasible if its total cost resides within the available budget and if no other constraints on resource availability are violated.
Now, in similar spirit to the simple models discussed earlier, the likelihood of interdicting an attempted infiltration with nuclear material out of regulatory control (or more generally the expected risk consequences of any terrorist infiltration plan) can be estimated using more complex models. Models that allow for the behavior of intelligent adversaries can also be developed. Again, the goal of such models is to produce a set of resource allocation decisions that are likely to lead to good (if not optimal) GNDA outcomes.
Now, recall our earlier discussion of GNDA’s best-effort budget. Optimal resource allocation as suggested by models of the form above could result in radically different suggestions for how to best allocate the total amount of money spent on GNDA activities. Using these same models in descriptive mode—that is, setting the decision variables equal to the values implied by current GNDA operations—provides an immediate basis for comparison: for the same total amount of money spent, how much better would optimal resource allocation perform than current practice? Equivalently, what is the penalty paid for operating the GNDA in its current “pure participation” mode when compared with the protection offered from optimally disbursing the total GNDA budget? What loss in the likelihood of detection (or other risk consequences) results from forcing the GNDA to operate under a best-effort budget as opposed to rationally allocating a fixed central budget?
This logic can also be applied to the GNDA’s three layers—each of the domestic, border, and international layers has an associated best-effort budget that equates to the total amounts spent by all participating agencies in layer-specific GNDA activities. How might the prospects for detection and risk reduction improve if each of these budgets was centrally allocated? And, thinking across these layers, how much further could system performance improve if the amounts allocated to each layer were allowed to vary (e.g., across detection or transportation modalities) so as to maximize safety from the threat of nuclear or radiological terrorism?


