
Human Dimensions of Rebuilding
INTRODUCTION
The rebuilding of fish stocks is guided by §304(e) of the Magnuson-Stevens Fishery Conservation and Management Act (MSFCMA),1 the National Marine Fisheries Service (NMFS) guidance on MSFCMA implementation, and judicial review. The declaration of a fish stock as overfished triggers immediate, prescribed remedial actions. The primacy of conservation and the secondary role of socioeconomic factors in rebuilding reflect purposeful tradeoffs expressed by collective legislative, executive, and judicial input in U.S. fishery governance. At the same time, many experiences around the globe highlight the social and economic impacts that can accompany declarations of overfished fish stocks.2 What has garnered less attention is how social and economic factors can be utilized in the design of management actions and can contribute to their efficacy, in some cases enabling rebuilding to be achieved with greater net social benefits.
There are multiple ways to assess the performance of a policy and its implementation, including the rebuilding of fish stocks. Stakeholders may have different perspectives on what performance and outcomes are considered successful. Among the primary motivations for rebuilding is an expectation that rebuilt fisheries will lead to healthier ecosystems and greater sustainable social and economic benefits (OECD, 2010). Yet while the natural and human outcomes of fish stock rebuilding are often closely aligned, they are not necessarily so; rebuilding of a fished stock does not imply parallel effects on fisheries or social benefits. For example, rebuilding of a fish stock to a given biological benchmark (e.g., to BMSY) can be associated with both long-run positive gains and short-run negative social and economic costs. Whether these long-run gains offset the short-run costs depends on numerous factors including how the rebuilding actions are instituted, the characteristics of the fishery, and the assumed discount rate. Moreover, stock sizes that maximize expected economic (net) benefits almost always differ from BMSY (Clark, 1990; Hilborn et al., 2012). Furthermore, the long-term gains may not be realized in the same segments of the industry that bore the short-term costs, and the socioeconomic transition that occurs during rebuilding (e.g., restructuring in the fleet and industry) may not be fully reversible, although the social sciences research on the nature of the socioeconomic transition is incomplete.
In general, the success of fisheries management and policy implementation in rebuilding fish stocks depends on how individuals and institutions respond (e.g., changing fishing practices, complying with rules, coping with social and economic transitions, etc.). Fishery managers manage people not fish. Because of the complexity and imperfect knowledge of the coupled human-natural systems (Liu et al., 2007) that constitute fishery complexes, the ex-post social and economic outcomes from a rebuilding plan can diverge from expectations.
Understanding the drivers of human behavior, the role of institutions, the past impacts of management actions, and the potential future impacts from a suite of management actions on social and economic systems is the domain of the social sciences (NOAA Science Advisory Board, 2009). It is across this broad domain that this chapter considers the social and economic dimensions of fishery rebuilding plans.
Many of the findings identified and discussed throughout the chapter are in part a consequence of the well-documented
_________________
1 Magnuson-Stevens Fishery Conservation and Management Act § 304(e), 16 U.S.C. § 1854(e) (2012).
2 For example, in the United States, some of the more significant overfished declarations have been in the New England groundfish fisheries, Gulf of Mexico reef-fish complex, and in the West Coast groundfish fishery. Globally, examples include the catch of groundfish in the European Union, sea cucumber and rock lobster in the Galapagos, and nearshore fisheries in Chile.
limitations associated with social sciences funding, staffing, and data collection under which the NMFS (and all of the National Oceanic and Atmospheric Administration [NOAA]) operates (e.g., NOAA Science Advisory Board, 2009). These resource constraints lead to differing approaches across the Regional Fishery Management Councils (RMFCs) in preparing Fishery Management Plans (FMPs), amendments, and the National Environmental Policy Act (NEPA) documentation (U.S. EPA, 2005). Some RFMCs have in-house capacity to draft FMPs and supporting documents, while others use FMP development teams composed of RFMC, NMFS Regional Offices, and Science Center staff and university scientists. With increasing calls for reductions in the size of government programs, the social sciences’ demands and expectations on fisheries management will likely continue to outpace available funding and staffing.
The chapter begins with an overview of the broader social and economic considerations in fish stock rebuilding, including biological versus social objectives, short-term versus long-term economic costs and benefits, and direct and indirect community impacts. This includes discussions of challenging issues such as mixed stocks, data-poor situations, scientific uncertainty, and incomplete information. The chapter continues with two sequential sections addressing the methods and NMFS guidance for economic impact assessments. These sections assess whether the NMFS guidance is consistent with established approaches for analyzing economic and other social outcomes and tradeoffs, and by reviewing a sample of rebuilding FMPs, whether the economic and social impact reviews conducted in practice incorporate analysis of these outcomes and tradeoffs. The chapter concludes with a discussion of the impacts of fisheries management tools on rebuilding effectiveness, followed by the findings of the committee’s analysis.
The committee carefully considered the analytical approaches necessary to conduct a retrospective or post hoc analysis of economic and social consequences of implementing specific rebuilding plans. However, the resources needed to adequately perform such an assessment were beyond the scope of the committee in large part because the necessary socioeconomic data do not exist. More systematic collection of socioeconomic data by the NMFS would have permitted more in-depth analysis of the actual socioeconomic impact of specific rebuilding plans (see discussion in NOAA Science Advisory Board’s 2009 report). The committee did not have the resources to collect and analyze the original data for these fisheries, and thus the chapter focuses on direct and indirect community impacts reported in the literature.
SOCIOECONOMIC IMPLICATIONS OF REBUILDING TARGETS
Fish stock rebuilding as mandated by the MSFCMA is based on “a prescriptive approach with tight timelines and limited flexibility” (Khwaja and Cox, 2010), “designed to achieve rapid rebuilding of biomass and spawning stocks consistent with the biological characteristics of the resource” (Larkin et al., 2007). The specific rebuilding parameters mandated by the MSFCMA are determined based on the stock-specific potential rate of building at the time of plan development and the allowable time period for rebuilding specified in the MSFCMA and Guidelines (see Chapters 2 and 3). Exceptions to these mandates are limited (e.g., cases of conflicting international agreements, incompatible biology of the fish stock, or other environmental conditions).3
Strict adherence to mandated biological rebuilding—despite possible socioeconomic tradeoffs and short-term costs (see Box 6.1)—are deemed necessary to “[end] overfishing immediately” and to prevent “protracted political debate, while the resource continues to decline” (Rosenberg et al., 2006). The committee’s review of empirical and biological outcomes of mandated rebuilding plans in the United States (see Chapter 3), as well as experience from other regions, support the view that biological mandates such as these may be linked to success in rebuilding depleted stocks (Caddy and Agnew, 2003; Khwaja and Cox, 2010). In addition, available evidence suggests that projected net economic benefits, or net present value of successful rebuilding, are often positive in the long run (Sumaila and Suatoni, 2006; Gates, 2009; World Bank, 2009; Hanna, 2010; Khwaja and Cox, 2010; Sumaila et al., 2012).
The focus on biological mandates can preclude the discussion, analysis, and implementation of fishery management alternatives that could provide greater potential economic benefits across commercial and recreational sectors (Agar and Sutinen, 2004; Larkin et al., 2007, 2011; Holland, 2010a) and could reduce adverse community impacts. Some of the community impacts associated with fishery management, in general, include changes in health and safety (e.g., Georgianna and Shrader, 2008), well-being of fishery-dependent communities (e.g., Hall-Arber et al., 2001; Clay et al., 2010), and infrastructure and waterfront land use (e.g., Portman et al., 2009). The commercial and recreational fishing industries and representatives of fishing communities often contest rebuilding plans because of their perceived inflexibility with regard to such impacts, as well as the potential short-term economic costs (Hanna, 2010; Terciero, 2011).
In general, a fishery management strategy designed to maximize economic benefits or minimize adverse community impacts (e.g., maintain cultural heritage, working waterfront industries, etc.) will diverge from those chosen according to biological criteria alone (Larkin et al., 2007, 2011; Holland, 2010a; Da Rocha et al., 2012; Hilborn et al., 2012; see also Grafton et al., 2007). As illustrated by Kompas et al. (2009), for example, pursuing Maximum Sustainable Yield (MSY) as a harvest target can “result in zero or even negative
_________________
3 Magnuson-Stevens Fishery Conservation and Management Act §§ 304(e)(4)(A)(i)- (ii), 16U.S.C. §§ 1854(e)(4)(A)(i)-(2) (2012).
BOX 6.1
Socioeconomic Tradeoffs and Costs
An example of tradeoffs between projected short-term costs and long-term benefits of rebuilding is seen in the original analysis of alternatives conducted for Amendment 13 to the Northeast Multispecies Fishery Management Plan (NEFMC, 2003). The economic analysis quantifies net economic value realized under rebuilding alternatives for all groundfish stocks covered under Amendment 13, including Atlantic cod, haddock, and yellowtail flounder, from 2003 through 2026. The rebuilding alternatives considered were anticipated to achieve rebuilding by either 2009 or 2014. As shown in section 5.4.2.5 of NEFMC (2003), Comparison of Rebuilding Strategies for 2009 Rebuilding Time Frame for Most Stocks, the projected difference in discounted harvest revenue compared to the no-action alternative is negative for all rebuilding alternatives through 2009. The effect is then positive from 2010 through 2026. Cumulative net present values do not become positive until after 2021. Similar patterns are seen for rebuilding alternatives that aim to rebuild stocks by 2014. Figure 6.1 illustrates the trajectory of projected cumulative economic benefits (the sum of discounted consumer benefit, income payments, and owner profits) over time. As shown by these projections, the net present value of cumulative benefits is negative for all management alternatives that would achieve rebuilding for roughly the first 15 years, after which positive cumulative benefits are projected. Similar discussions of short-term versus long-term net benefits of rebuilding are found in other analyses of rebuilding alternatives (e.g., GMFMC, 2004). Hence, even when positive net benefits are projected over a long-term rebuilding trajectory, they are typically preceded by negative net benefits in the short term.
The NEFMC (2003) analysis also demonstrates that longer rebuilding periods can increase projected benefits. The analysts concluded that although the “2009 rebuilding time would result in lower landings than [the 2014 rebuilding alternatives] until 2009” there would be “higher landings from 2010 to 2014, and roughly equivalent landings from 2015 onward” (NEFMC, 2003). In all cases, cumulative net economic benefits are greater under the rebuilding alternatives that aim for rebuilding to occur in 2014.
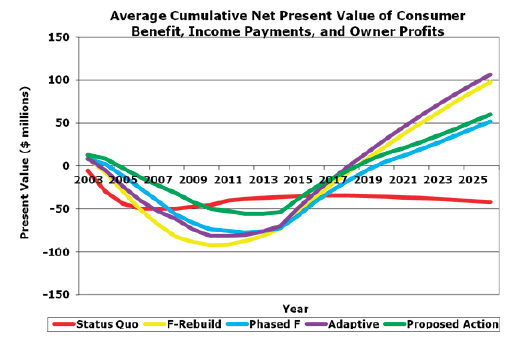
FIGURE 6.1 Economic net benefits for different rebuilding strategies.
NOTE: Methods for the economic analysis underlying Figure 6.1 are outlined by NEFMC (2003). Each rebuilding projection is based on a set of mortality rates designed to achieve biological rebuilding, with stock adjustments made to account for recreational and Canadian landings. Each net benefit trajectory represents the cumulative sum over time of consumer surplus, owner profits, and returns to labor (or income payments), discounted at an annual rate of 7%. All projections are given in 2001 dollars. Illustrated net benefits are mean values over projected probability distributions calculated using Monte Carlo simulation, based on fitted theoretical probability distributions of age-based landings. Projections assume that every fishing mortality target is achieved. Consumer surplus, owner profits, and returns to labor are estimated based on results from a dockside demand model, specified as a system of price equations. These models capture both trends in seafood demand and supply/demand interactions. Consumer surplus estimates are calculated as the area under the demand function from zero to the quantity supplied (i.e., landings), after subtracting total vessel revenues. Return to labor and owner profit are calculated as the difference between gross revenues and fishing costs, with costs (fixed and operating) estimated from survey data.
SOURCE: Figure 207 from NEFMC (2003).
profits,” whereas positive profits are possible if stocks are harvested at Maximum Economic Yield (MEY). An analysis for the southeastern trawl fishery in Australia indicated that BMEY/BMSY ranged from 1.10 (spotted warehou) to 1.53 (orange roughy in the Cascade), reflecting economic factors such as the influence of biomass on harvest costs that are not incorporated in biological models alone. Depending on fishery characteristics, the optimal harvest strategies from these socioeconomic analyses can be either more or less conservative (e.g., targeting higher or lower biomass) than those determined solely by maximizing sustainable yield (e.g., Clark, 1990; Johnston and Sutinen, 1996; Grafton et al., 2007), although in general “long-term profitability is maximized at harvest rates lower than would produce MSY” (Hilborn et al., 2012).
Although a fully optimized strategy to maximize the socioeconomic benefits might not be feasible, there are often potential socioeconomic gains from increasing the degree of flexibility to achieve a given target. For example, Larkin et al. (2007) found that extending the rebuilding time frame beyond the 10 years (as allowed in New Zealand, for example) could result in significant economic gains depending on the economic and ecological characteristics of the fishery and could better meet the needs of fishing communities. Larkin et al. (2007) contrasted alternative rebuilding scenarios for an illustrative moderate-lived fish stock and found that, depending on the assumed discount rate,4 expected net economic benefits increased between 3.5% and 19.4% when rebuilding time frames were extended from 10 to 20 or 30 years, and average Total Allowable Catches (TACs) during the rebuilding period also increased between 46% and 97%.
An economic analysis as part of Amendment 13 in New England (see Box 6.1) also found that longer time horizons could increase projected benefits. However, extending the time frame is not always the optimal economic plan (see, e.g., Sanchirico et al., 2010). Flexibility could be introduced into rebuilding plans in other ways (see discussion on fishery management, below). Whenever socioeconomic benefits are expected to result from additional time, they must be weighed against the risks, such as potential negative effects on the health of the fish, condition of the ecosystem, and likelihood that rebuilding will be achieved.
Another frequently discussed concern about current rebuilding approaches is the difficulty of rebuilding in the presence of mixed stocks. As noted by Davis (2010), “[I] t may not be possible to rebuild very weak minor stock components of a mixed stock fishery without shutting down the fisheries on healthy stocks, hence there is an important socioeconomic issue involved and some possibly difficult tradeoffs.” That is, mandated rebuilding of a stock with little or no commercial value might reduce feasible harvest levels for a highly valued, more abundant species. For example, as described by Rosenberg (2010), “[Due to rebuilding measures in place for flounder and cod within the New England multispecies fishery] the higher abundance of haddock means lost opportunity for fishermen. … If effort could target haddock without bycatch then easing of restrictions might be possible.”
The management complexities of rebuilding single stocks in multi-species fisheries are not unique to this country. For example, Pascoe (2000) estimated the opportunity costs associated with protecting and rebuilding the Australian south east gemfish fishery (a bycatch species) by curtailing catches of other target species in the complex. He found that the costs of protecting the gemfish in terms of the lost economic values associated with not being able to fish the other target species in the complex could be larger than the financial returns from harvesting gemfish even after the stock was rebuilt. This example demonstrates a case in which rebuilding of a species in the presence of mixed stocks could lead to net economic losses. The generality of this conclusion, however, depends on many factors (e.g., price differences between species, discount rates, nature of the technical interactions), and it is not clear ex ante that the costs will always be as significant as those for the gemfish fishery (see, e.g., Armsworth et al., 2011). Hilborn et al. (2012) provide a discussion and quantification of similar tradeoffs in the California Current bottom-trawl fishery, concluding that rebuilding has come at “considerable short-term cost in yield from stocks that are not overfished.” The types of analysis required to understand these tradeoffs are discussed in more detail below.
In principle, a mixed-stock exception allows for flexibility to accommodate cases in which individual species are caught in conjunction with others, for example because of the difficulty and/or prohibitive cost of avoiding incidental bycatch (Holland, 2010a).5 In practice, however, the exception does not generally apply to overfished stocks in need of rebuilding. Specifically, the exception in the MSFCMA applies only when a stock is not currently overfished, mitigating measures have been considered, and increased harvest will (a) not cause the stock to fall below its Minimum Stock Size Threshold (MSST) more than 50% of the time and (b) generate long-term positive net benefits to the nation (see Chapter 2).6
_________________
4 Because benefits and costs of regulations occur over multiple years, an analysis of the tradeoffs between an action today and potential outcomes in the future needs to consider the time value of money (Goulder and Stavins, 2002). Discounting, which is the method employed for such a comparison, is analogous to a bank recognizing the time value of money by charging borrowers interest rates. A higher (lower) discount rate will place more (less) weight on benefits and costs in the present relative to the future (see Holland et al. [2010a] and U.S. EPA [2000] for a more detailed discussion). OMB Circular No. A-94 provides guidelines for discount rates to be used within cost-benefit analysis of federal programs.
5 One important, yet often overlooked, factor in discussions regarding managing mixed fisheries is the role of fishermen’s behavior (choice of where, when, and how to fish), which is itself a function of the management institution, and how this effects the level of bycatch. See, for example, Wilen (2006), Abbott and Wilen (2009, 2011), Holland (2010c), and Holland and Jannot (2012) for further discussions on these interdependencies.
6 74 Fed. Reg. 3178, 3213 (Jan. 16, 2009).
An additional consideration is that many stocks are data poor, especially relative to the data necessary to populate coupled human-natural system models required to understand the impacts of various management options. For example, Beddington et al. (2007) estimate that between 30% and 70% of fished stocks in Australia, New Zealand, Europe, and the United States have insufficient data for stock assessments (see additional discussion in Chapters 3 and 4). Quantitative stock assessments are available for about 85% of the stocks declared overfished in the United States (Chapter 3), but some of the stocks for which no quantitative assessment is available correspond to species complexes. Conceptually, Honey et al. (2010) defined data-poor methods as those that could be used to develop qualitative or quantitative control rules, without the guidance of a full stock assessment. From a socioeconomic perspective, most stocks are data poor because baseline data and understanding of socioeconomic trends and causalities do not exist (Abbott-Jamieson and Clay, 2010; Clay et al., 2010). Fulton et al. (2011) sug gest that human behavior is perhaps the greatest source of uncertainty in fisheries management, but the least adequately accounted for (see also Wilen, 2006).
As discussed in previous chapters, the ability to provide scientific advice on rebuilding plans, including stock status determinations and stock projections used to develop the plans, is subject to several sources of uncertainty. Rebuilding may occur more slowly or rapidly than initially projected. For example, the projected rebuild date for Acadian redfish was initially set at 2051, yet by 2010 stock assessments showed the stock to be successfully rebuilt, such that rebuilding was considered complete approximately 40 years ahead of schedule (Nies, 2012). Because of the uncertainty inherent in projecting future conditions, rebuilding plans are often adjusted (e.g., timelines, BMSY and FMSY) as new estimates of stock biomass and status (e.g., overfished, subject to overfishing) become available. These adjustments can cause unanticipated and significant economic and social shocks that are positive (e.g., stocks reaching a rebuilt status more rapidly than predicted, shorter rebuilding schedules, and more rapid increase in fishing than anticipated) or negative (e.g., further curtailing of catches). Recent events in the New England cod fishery (U.S. Department of Commerce, 2012) illustrate the potential harvest reductions that can occur and the potential for attendant social and economic impacts.7 Although regular stock assessment updates are necessary to incorporate new information on stock status, the constraining nature of the MSFCMA once the overfished status is declared limits potential actions that could be utilized to reduce the social and economic impacts on the affected communities.
SOCIOECONOMIC ANALYSIS OF REBUILDING PLANS
After the biological parameters of the rebuilding program, in particular the rebuilding biomass target and maximum time to rebuild, have been determined as mandated by the MSFCMA, the RFMCs in conjunction with NMFS staff then examine formally and informally a range of management alternatives consistent with these parameters. The formal analyses of the socioeconomic impacts are found, for example, in Environmental Impact Statements (EISs) and Regulatory Impact Review (RIR) documents, and the informal analysis is integrated through stakeholder participation in the RFMC process.
A number of guidance documents are of particular importance in defining the scope and nature of the economic and social impact analysis to be conducted when developing a rebuilding plan. These include the NMFS’ Operational Guidelines: Fishery Management Plan Process (NMFS, 1997), Guidelines for Economic Reviews of National Marine Fisheries Service Regulatory Actions (NMFS, 2007a), and Guidelines for the Assessment of the Social Impact of Fishery Management Actions (NMFS, 2007b). The Operational Guidelines state that the FMP should include an analysis of the beneficial and adverse ecological, economic, and social impacts of potential management options on the fishery as a whole, “in monetary or qualitative terms” (NMFS, 1997). These Guidelines address the general nature and objectives of the economic and social impact analysis, including that changes should be considered “relative to the status quo.” They also identify the scope of communities to consider and the nature of change (e.g., in fishing methods, likelihood of acceptance among fishermen, enforceability, and the effects on health and community viability).
Within the RIR documents accompanying a rebuilding plan (NMFS, 2007a), the Analysis of Alternatives (AOA) presents the data, models, and analysis of the socioeconomic tradeoffs associated with the required reductions in fishing mortality. The findings of an AOA may alter numerous aspects of a rebuilding plan, including timeline (within the biological mandates), associated annual catch limits/target fishing mortality rate, catch allocations (e.g., among fishery sectors), and the particular combination of input or output controls required to implement a particular rebuilding alternative.
The NMFS guidance on the economic and social analysis within AOAs follows broader guidance found in OMB Circular No. A-4 (U.S. Office of Management and Budget, 2003) and Executive Order 12866, “Regulatory Planning and Review.”8 Although RMFCs are free to consider a wide range of socioeconomic effects within AOAs, primary emphasis is given to economic effects.9 The RFMCs in conjunction
_________________
7 The Gulf of Maine Cod Working Group (2012) estimated that harvest reductions resulting from unexpected declines in estimated biomass would cause “New Hampshire groundfish revenues [to] be reduced by 91 percent, Maine groundfish revenues [to] be reduced by 54 percent, and Massachusetts groundfish revenues [to] be reduced by 21 percent.”
8 58 Fed. Reg. 51735-51746 (1993).
9 Some guidance is provided on noneconomic social outcomes in the AOA, however. Among those sections of the guidance document that discuss noneconomic social analysis is IV.3.e., “Changes in Other Social Concerns.”
with NMFS staff examine the social impact of a range of management alternatives predominantly in Social Impact Assessments (SIAs) as a component of the EISs under the National Environmental Policy Act (NEPA).
The committee evaluated the breadth, depth, and validity of socioeconomic analyses employed in assessing rebuilding, documented in the AOAs and EISs.10 A formal review of all rebuilding fisheries within U.S. jurisdiction was not feasible. Therefore, the committee reviewed documentation for the following fisheries: Gulf of Mexico red snapper; West Coast canary rockfish; New England cod and haddock; Southeast gag grouper; and mid-Atlantic summer flounder. These fisheries were chosen because they span a number of the geographies and dimensions that are important in determining socioeconomic outcomes, including recreational and commercial fishing (red snapper and summer flounder), mixed-stock fishery (canary rockfish), and ecosystem considerations (cod and haddock, gag grouper). The goal of this review was to evaluate the ways in which socioeconomic analysis was used to inform the selection of preferred rebuilding alternatives from a broader candidate set that meets required biological parameters.
This section first discusses the nature of the economic AOAs in rebuilding plans followed by the analysis of social impacts that accompany the plans. These two types of analyses are separated because they are often completed in parallel within the fishery management process and are part of different reporting requirements (and documents produced by the RFMCs). In fact, a disjointed policy and guidance landscape results from economic analysis occurring primarily in AOAs within the context of an RIR and social analysis occurring primarily in SIAs within the context of a NEPA EIS. This separation seems to discourage the integration of economic and sociocultural analyses.
ECONOMIC ANALYSIS OF ALTERNATIVES IN REBUILDING PLANS
This section first discusses the economic guidance on AOAs provided by the NMFS and then presents findings with respect to the reviewed AOAs. Two central questions are addressed: First, is NMFS guidance for rebuilding AOAs consistent with established approaches for the analysis of economic outcomes and tradeoffs? Second, do rebuilding AOAs in practice sufficiently analyze these outcomes and tradeoffs?
NMFS Guidance on the Analysis of Alternatives
NOAA provides guidance on the types of economic effects that should be considered, the appropriate ways to measure these effects, a selection of summarized underlying economic models, and the types of data and indicators that can or should be used to estimate different economic effects (NMFS, 2007a). The guidance, however, is not intended to prescribe a particular method but rather to provide general assistance in preparing an economic analysis (see Appendix I for Section IV of the guidance document). For example, in terms of the scope of the analysis, the guidance states that “economic analysis related to the performance of the relevant commercial and recreational users, non-consumptive users, processing sector, and retail or other market sectors is needed.” The decision on which sectors to include depends on the specific context. Moreover, while suggesting specific types of quantitative analysis and data, the guidance allows for significant flexibility:
At a minimum, a qualitative analysis should discuss the relative magnitude of changes in performance. The qualitative components of the analysis should be replaced with quantitative components when this is the appropriate option. Information should be tailored to the sector(s) being analyzed, including commercial fishing and processing, recreational and subsistence fishing, and non-consumptive uses of fishery or other living marine resources. Examples of the information that should be provided in an RIR, if relevant to the analysis, may include the following. (emphasis added; NMFS, 2007a)
This flexibility aside, the guidance for AOAs is consistent with widely accepted norms for economic analysis. For example, the guidance recommends a framework that compares (either quantitatively or qualitatively) the aggregate benefits and costs for any alternative, along with an analysis of the distribution of the impacts. In cases “where a specific action is mandated by statute or some other binding ruling, a cost-effectiveness analysis” is recommended as an alternative (NMFS, 2007a).11 The context of the decisions under consideration typically dictates the appropriate frame-
_________________
As stated within this section, “[T]he changes with respect to social concerns that are not captured in the preceding categories of [economic] effects should be addressed. Such concerns may be explicitly or implicitly identified in the problem statement, or they may arise during the development and review of alternative management actions.” Required Fishery Impact Statements (FIS) under the MSFCMA also require analysis of “social impacts of the proposed action on various components of the fishery being managed, over the entire range of the regulated species, on participants in the fishery and in other fisheries, and on fishing communities.” These and other statements in the NMFS guidance, however, provide little insight into the specific constructs, data, and methods to be used when evaluating noneconomic social effects, although they are present in the separate Social Impact Assessment (SIA) guidance.
10 Although the discussion and findings are cast within the RIR framework, the discussion also applies to the Preliminary Regulatory Economic Evaluation (PREE) that is completed prior to a preferred alternative being chosen.
11 For example, a cost-effectiveness analysis could be used to determine the minimum cost of achieving a reduction in fishing mortality over time, where the fishing mortality rate is mandated in a rebuilding plan. On the other hand, a benefit-cost analysis would be required to fully evaluate the net economic effects of a proposed mixed-stock exemption; this would seek to compare the net benefits associated with increasing the allowable harvest of one or more species in the mixed-stock complex to the net benefits (or costs) associated with a longer rebuilding time of the species under mandated rebuilding.
work. These methods are widely accepted and have well-established properties (see, e.g., Just et al., 2004; Boardman et al., 2006; Holland et al., 2010b; OECD, 2010).12 Within these frameworks RFMCs can consider tradeoffs across time, communities, and types of users. Also suggested is an evaluation of changes in jobs and income, for example as forecasted using regional economic models. In addition, the guidance briefly discusses analytic details such as (a) the need to justify in any forecasting exercise, (b) assumptions on exogenous factors (e.g., demand for seafood), (c) the choice of discount rate, (d) the time period of analysis, and (e) the role of risk and uncertainty.13 These instructions, although concise, are also consistent with widely accepted norms for economic analysis, as discussed in, for example, Boardman et al. (2006), Holland et al. (2010b), and OECD (2010).
The NMFS guidance is less clear about the treatment of different types of economic information within an AOA. An advantage of structured frameworks such as benefit-cost analysis and cost-effectiveness analysis is the existence of clear guidelines—consistent with economic theory—regarding their use (e.g., aggregation and comparison) of different types of data (cf. Just et al., 2004; Boardman et al., 2006). As discussed in the next section, the NMFS guidance requires quantitative or qualitative presentation of many types of socioeconomic data, including various measures of economic benefits and costs, as well as other indicators that do not reflect well-defined benefit or cost measures. For example, as noted by Holland et al. (2010a), “[W] hile the creation of jobs may be desirable from a variety of perspectives—and may represent an informative economic indicator—it does not usually represent an economic benefit that is counted in [benefit cost analysis].”
Indicators of Economic Effects
The indicators of the economic impacts considered in an AOA differ depending on the sector or user group. Table 6.1 presents the information required by the NMFS guidelines, along with an indication of whether the information can be captured by measures of well-defined economic benefits/costs or ecosystem service values.14 For example, according to the NMFS guidelines, AOAs should consider the impact of rebuilding on participation in the fishery (e.g., number of vessels, anglers), the reduction in catches, and changes to the economics of fishing (e.g., fish prices, costs of fishing) across all of the alternatives, including no action. To address National Standard 8 in the MSFCMA, the scale of these indicators must capture the geographic distribution of the impacts (e.g., communities and ports) and the different types of users within the broad categories.
As shown by Table 6.1, the socioeconomic information required15 for an AOA varies widely and is linked with theoretically appropriate measures of economic benefits and costs, as well as measures that are not necessarily correlated with economic benefits. For example, many required indicators report on economic impact, activity, or gross production. The information requirements and indicators fall along a continuum in terms of data needs and complexity. For example, an indicator such as the actual (or predicted) change in days at sea is easier to calculate and less uncertain (i.e., because of readily available monitoring data and the relative simplicity of the indicator) than is a measure of the change in commercial fishing profits. However, a change in days at sea is difficult to interpret in terms of the overall impact on the economics of the fishing operations (e.g., fewer days could be accompanied by higher prices of fish and therefore could correspond to higher fishing revenues and vice versa). An increase in profits, on the other hand, represents an economic benefit of the particular action for the commercial fishery. Estimating changes in profits requires the use of sophisticated econometric analysis techniques, which may not always be available or feasible within the context of a rebuilding AOA (i.e., the time, expertise, or data may be unavailable). Consequently, tradeoffs in the types of economic information used to evaluate rebuilding alternatives are necessary.
Analysis of Alternatives in Practice
Although all of the AOAs must be “a reasoned assessment of the expected direction of change in net benefits to the Nation, as well as the specific effects of individual entities of a proposed regulatory action,” the guidelines are not prescriptive (NMFS, 2007a), which reflects the need to adapt analyses to the characteristics of affected fisheries and stakeholders and the variations in data and model availability. As a result, the economic evaluations contained in rebuilding AOAs implemented by the RFMCs will vary.
This variation is in part due to the idiosyncratic nature of the economic science available across the regions. That is, in some regions, the NMFS and academic economists (many times in partnership) already have models and analysis on a specific fishery on hand when a rebuilding AOA is initiated. For example, researchers might have access to multiple years
_________________
12 Holland (2010b) suggests Management Strategy Evaluation (MSE) as a potential complement to a benefit-cost framework for rebuilding analysis.
13 For example, with respect to risk and uncertainty, the document outlines a tiered approach that increases in complexity and possibly the quality of information: qualitative discussion, sensitivity analysis, and Monte Carlo analysis. Sensitivity analysis involves running various scenarios of the forecast model under different assumptions about a parameter, such as ex-vessel price of fish, cost of fuel, discount rate, and comparing the differences in net present value. Monte Carlo methods are more sophisticated tools that can provide a distribution of outcomes under a wider range of uncertainty than can a sensitivity analysis (Judd, 1999).
14 Ecosystem service values are defined as “the flows from an ecosystem that are of relatively immediate benefit to humans and occur naturally” (Brown et al., 2007). Additional discussion of these values is provided later in this chapter.
15 Requirements are for either qualitative or quantitative consideration as appropriate within a given context.
TABLE 6.1 Information Requirements Listed in Section IV.6 of Guidelines for Economic Review of NMFS Regulatory Actions—Description and Economic Interpretation
| Information Requirement | Interpretation (type of indicator or estimate) | Well-Defined Measure of Economic Welfare (benefit or cost) | Focused Solely or Primarily on Commercial and Recreational Fisheries | Quantifies Ecosystem Service Values Beyond Those Realized by Recreational and Commercial Fisheries |
| Expected levels or changes in participation (number of fishing vessels and/or anglers, etc.) and activity (number of fishing trips, days at sea, etc.) | Economic impact, activity, or gross production | No | Yes | No |
| Expected levels or changes in harvests (commercial, recreational, and subsistence) and their distribution by sector | Economic impact, activity, or gross production | No | Yes | No |
| Expected levels or changes in nonconsumptive use of the resource | Economic impact, activity, or gross production | No | No | No |
| Expected changes in prices (commercial ex-vessel prices and recreational access prices) | Market prices | No | Yes | No |
| Expected changes in harvesting costs (fixed and variable costs, including capital and landing costs), as well as equivalent costs for nonconsumptive use activities | Benefits and costs | Yes | Yes | No |
| Expected levels and costs of processing | Economic impact, activity, or gross production; benefits and costs | Yes | Yes | No |
| Expected changes in benefits and costs incurred by specific user groups, including effects on small entities | Benefits and costs | Yes | Yes | Possibly (to the extent that these capture benefits and costs outside of recreational and commercial fisheries) |
| Expected effects on employment | Economic impact, activity, or gross production | No | Yes (unless significant employment effects are expected in other sectors) | No |
| Expected effects on profits, competitive position, productivity or efficiency of individual fishermen, user groups, or fishing communities | Multiple, including measures of benefits and costs | Yes (profits can approximate producer welfare); No (all others) | Yes | No |
| Expected effects on the reporting burden | Compliance requirements | No | Yes | No |
| Expected impacts on recreational and subsistence use, including changes in participation and catch rates and, to the extent practicable, their consumer surplus; for subsistence fishing, food and cultural availability | Multiple, including (i) economic impact, activity, or gross production, and (ii) benefits and costs | Yes (consumer surplus); No (all others) | Yes | No |
| Expected management and implementation costs attributable to the action, including enforcement costs | Benefits and costs | Yes | Yes | No |
| Expected effects on non-use values | Benefit and costs | Yes | No | Yes |
| Expected effects on fishing capacity | Industry size | No | Yes | No |
of industry survey data to develop measures of fishing costs and/or data to estimate demand curves for the fish from which to calculate consumer surplus. In some regions, the net benefits derived from recreational angler activity in affected fisheries may be estimated because the associated research has already been done. In other cases, no economic research has been conducted on the particular fishery, and necessary research cannot be conducted within the regulatory time frame. For example, without cost data, the analyst will likely focus on gross fishing revenues or discuss the impacts qualitatively (rightly so). In economic science, quantitative estimates that allow for direct comparisons across sectors of the different alternatives are preferred, but qualitative descriptions are illustrative and also valuable for decision makers.
The variation in data availability and research stem in large part from the lack of economic data collection mandates for the NMFS (unlike in the stock assessment realm). In many instances, the commercial fishing industry opposes the collection of economic and fishing data (e.g., location of where fish are caught) because of confidentiality concerns (NRC, 2000). Rules on the collection of economic data were relaxed during the reauthorization of the MSFCMA in 2006 (see sections 303(b)(7) and 402(a) of the amended MSFCMA, and discussion within NRC, 2000). Another limiting factor to comprehensive economic analysis is the predominant focus on commercial and recreational fishing in the assessments of the economic value of fish stocks found in the Stock Assessment and Fishery Evaluation (SAFE) Reports. These assessments often do not capture the total economic value to the nation of the fish stock, which would include the value of nonfishing recreational and potential nonmarket activities (see discussion below).
Although its charge does not include peer review of specific rebuilding AOAs, the committee identified a number of areas that, if addressed, could improve the analysis of social and economic impacts within rebuilding AOAs. We discuss the primary findings of this review below.
Forecasting Rebuilding Effects over Time and Space
Rebuilding AOAs in general follow NMFS guidance on analysis of economic effects. However, although the recommended tools and analyses are applicable to all RIRs, several factors complicated the conduct of rebuilding AOAs, including a need to forecast effects during a transition that may extend over long periods of time. These forecasts are complex because the associated economic and social dynamics impact and are impacted by the transition. The Committee’s review suggests that rebuilding AOAs differ substantially in their treatment of these dynamics, particularly with regard to endogenous and exogenous factors in the coupled human-natural system of the rebuilding fishery.
Endogenous factors are impacted by the alternative under consideration, that is, the effects are determined within a fishery’s socioecological system. For example, fishermen’s decisions on where, when, for what species, and how to allocate fishing effort may affect the dynamics of rebuilding; reallocation of fishing effort can either slow or speed recovery.16 Other potentially important feedbacks include changes in net fishing revenue, above and beyond that related solely to an assumed change in harvest. Revenue changes may be caused by a variety of endogenous factors including price responses to reduced landings (e.g., NEFMC, 2003), more abundant larger fish (especially in fisheries where there is a significant price gradient over size), or reduction in the search cost for fish, as the fish populations rebuild. These changes are likely to influence entry/exit decisions and profitability of the fishing fleet during the rebuilding period. The omission of these factors from the forecasts of economic effects can lead to an overestimation of costs to the fishing industry from rebuilding. To fully capture the effects of these and other endogenous factors, the analyst must couple an economic model of the commercial and recreational fishing enterprise with the fish population dynamics.
Another important yet often overlooked endogenous factor is the role of fishery management. The link between the type of regulatory structure (e.g., regulated open-access, limited-entry, catch share) and the economics of fishing is well known (see, e.g., Sanchirico and Wilen, 2007, and citations therein). The implication of this link is twofold. First, using data on fishing operations and socioeconomic impacts from one regulatory regime to forecast the impacts in another regime may lead to generalization errors (see, e.g., Wilen, 2007). Second, any assumption regarding fishery management in a distant time period is speculative at best. Most analyses proceed under the assumption that the relevant regulatory structure will remain fixed over the rebuilding horizon, unless changes in regulatory structure are under consideration as part of the AOA. Although changes in regulatory structure are difficult to predict—perhaps justifying these common assumptions—they can lead to misleading forecasts of socioeconomic effects when regulations change over time.
Exogenous factors are not impacted by the specific rebuilding alternative, but may change over time (and potentially over space). Changes in these factors also influence socioeconomic impacts. Given the length of time covered by many rebuilding analyses, the potential impact of these exogenous factors can be substantial. An example would be the price of fish when many substitute fish are available to the consumer. In this case, there would be little change in the price of the particular fish due to the reduction in landings, yet fish prices might change substantially over time because of external events. Similarly, the price of fuel is not likely to change as a result of rebuilding, but it is likely to change over a rebuilding timeline that may extend over decades. Other
_________________
16 An example would be reallocation of fishing effort to another species in the complex, which might reduce the impact of directed fishing on a rebuilding stock but increase the impact of bycatch, with concomitant impacts on rebuilding dynamics.
exogenous dynamic variables, such as changes in coastal population, alternative fishing opportunities, and demand for recreational fishing, could also be incorporated into AOAs to provide the RMFCs with more robust estimates of future impacts.
The analyst has a number of options for addressing relevant exogenous factors within a rebuilding AOA. First, the analyst might assume that these factors are fixed over time. For example, in the canary rockfish rebuilding AOA, which covers a 50-year time span, the analyst could assume that fish prices and fuel costs would remain constant. A second option is to assume that these factors will change over time based on historical rates and patterns (e.g., fuel or fish prices). Third, and perhaps most relevant, the analyst could conduct sensitivity analyses to evaluate the sensitivity of socioeconomic effects to a range of exogenous factors that may change over time.17
When addressing the potential role of endogenous and exogenous factors within a rebuilding analysis, the analyst must balance the additional information provided by an approach that accommodates change in these factors against the time and data required to develop more complex models. As a generalization, many AOAs err on the side of oversimplified economic analysis, which stands in contrast to the relatively complex fish population dynamics models used to forecast biological components of the fishery. Many of the stylized assumptions used in forecasting limit the ability of AOAs to meaningfully quantify future social and economic impacts. The result is that rebuilding AOAs primarily address short-term economic impacts. Longer-term analyses typically rely on simplifying assumptions that limit their relevance to longer-term forecasting (e.g., assuming fixed prices over time). Therefore, many of the analyses are more appropriately considered to be short to medium term even if they are simulated over a longer time span. These simplifications and the underlying uncertainty in natural and human factors limit the ability of these models to accurately project conditions that will occur in the far future.
The development of models that couple the dynamics of the natural and human systems (e.g., bioeconomic models) could improve forecasting of rebuilding effects, because they would incorporate the behavioral responses of the industry, the changes in the fish stocks, and other endogenous changes over time within a single modeling framework. Such models would also improve forecasting of the changes in fisheries (including, e.g., the number and type of vessels) that would accompany rebuilding of fish stocks, because outcomes do not necessarily move in tandem. Even in the absence of fully developed models of this type, greater attention to potential changes in both endogenous and exogenous factors (e.g., ecosystem considerations) over time, and the feedback among them, would provide a deeper and broader understanding of the socioeconomic impacts to fishery managers.
Data and Model Availability
As previously mentioned, the ability to carry out quantitative assessments is complicated by a lack of necessary data and models. For example, in response to Amendment 13 in the New England Multispecies Fishery, the analyst measured changes in producer and consumer surplus and carried out a Monte Carlo analysis of these economic changes under different assumptions about the level of uncertainty (NEFMC, 2003). In contrast, in response to Amendment 16-2 in the West Coast Groundfish fishery, the analyst used fishing revenue and landings and did not account for uncertainty in the estimates (PFMC, 2003). Addressing data and modeling gaps will require resources beyond those typically available to the RFMC and will require a collective and collaborative enterprise across the regions, in which analysts collaborate to create standardized assumptions and analyses reflecting best practices.
Because of the lack of data or appropriate models, AOAs often use proxies to measure economic effects.18 For example, fishing profit is often approximated using accounting techniques, whereas the true measure of economic profit requires an estimate of economic costs (opportunity costs) and captures the effects of a rebuilding stock on the revenues and costs of fishing. Sometimes fishing revenue is used as a proxy for fishing profit and as such does not account for the costs of fishing (which could be falling over time as the fish stock rebuilds). In the AOAs reviewed, analysts explained the pros and cons of the different proxies. However, these explanations often lacked (a) a discussion of the quality of the data used to measure the proxy and (b) guidance for the RFMCs on how to interpret the proxy, considering both the quality of the data and theoretical differences between the indicator and proxy. Inconsistencies in how proxies are measured (e.g., what was considered a fixed or variable cost, whether gross revenues included different prices for different sizes of fish) reduces the comparability of socioeconomic impacts across fisheries.
A tiered rating system to evaluate the proxies in terms of data and theoretical differences is one possible method of communicating the uncertainty around estimates. For example, results classified under Tier 1 might be derived from a peer-reviewed methodology and up-to-date socioeconomic data to measure economic benefit or cost. Those classified under Tier 2, in contrast, could utilize older or
_________________
17 Some factors might simply scale up or down the impacts, but others could impact the relative ranking of alternatives. For example, assuming a constant price of fuel into the future could lead to the conclusion that, although closing areas further from shore is less likely to result in the same economic impacts as closing inshore areas, both are economically viable options. On the other hand, if fuel prices are likely to rise in the future, then it could be concluded that closing the near shore areas will lead to unprofitable fishing while closing the offshore areas is still economically viable.
18 In other cases, benefit transfer, or a parallel transfer of biological information, is used to approximate economic or biological outcomes based on research conducted elsewhere or for other purposes (Johnston and Rosenberger, 2010).
more limited data in an otherwise rigorous analysis. For instance, the AOA in response to Amendment 27 for the Gulf of Mexico red snapper fishery uses cost data that were more than 10 years old in the measurement of fishing profits. No other cost data were available, and the associated assumptions in the analysis were clear. Nevertheless, the use of older cost data (from a different management regime) introduces a source of potential error. Tier 3 could identify indicators measured by imprecise proxies or otherwise flawed data. Such a ranking system could enable an RFMC to place more weight on those indicators that are considered more reliable and precise. However, it would require careful development and scrutiny to ensure scientific validity and salience to the analyses being conducted.
Comprehensive Measures of Economic Effects
The rebuilding AOAs reviewed by the Committee emphasized the outcomes pertaining to the commercial or recreational fishery, which reflects a similar, if not implicit, emphasis in NMFS guidance. For example, of the 14 “examples of the information that should be provided in an RIR” (NMFS, 2007a), 12 address economic outcomes in these two sectors alone. Within the reviewed AOAs, nearly all quantified socioeconomic effects relate directly or indirectly to participation (e.g., number of vessels fishing), net economic benefits, or economic impacts (e.g., jobs, income) in the commercial or recreational fishery. Although the guidance discusses the need to quantify the nonmarket ecosystem services and other socioeconomic effects that are potentially generated from rebuilding, such quantitative measures are rarely found in rebuilding AOAs. Rather, a lack of readily available information typically leads the analyst to include a qualitative discussion of these effects, if at all. For example, although NMFS guidance explicitly lists “expected effects on non-use values” as an example of “information that should be provided in an RIR, if relevant to the analysis” (NMFS, 2007a), none of the rebuilding AOAs reviewed by the committee contained a quantitative analysis of these values. The omission of quantitative information is particularly relevant for values of affected ecosystem services and other non-market benefits. The NMFS guidance, reflecting established norms for benefit-cost analysis, identifies nonmarket values as one of the relevant components of analysis: “Not all goods and services important to people are exchanged through markets, nor receive market prices. Including non-market values may be particularly important when considering amenities, such as habitat, ecosystem, recreational experiences, and protected resources, or issues affecting cultural heritage, historical and/or archeological assets, or other unique community resources” (NMFS, 2007a). Established methods exist to quantify such nonmarket benefits (Freeman, 2003; Holland et al., 2010). Yet, unlike regulatory benefit-cost analyses at the U.S. Environmental Protection Agency and elsewhere in which nonmarket benefits are routinely considered (Griffiths and Wheeler, 2005), rebuilding AOAs typically either do not include these benefits or provide only a brief qualitative discussion.
The omission of nonmarket values may or may not influence the selection of a rebuilding alternative. For example, if market and unquantified nonmarket benefits are correlated and/or if unquantified nonmarket benefits are small relative to market benefits, then the inclusion of quantified nonmarket benefit estimates might not change the qualitative conclusion regarding different alternatives. However, an alternative that yields lower market returns but larger nonmarket benefits could be discounted, or not at all considered, by an RFMC because of the lack of quantitative measures of these services. In such cases, the omission of nonmarket benefit or cost estimates from an AOA could result in an error in the calculation of economic net benefits and in a selection of regulatory alternatives based on partial and potentially incomplete information.
In many cases, quantification of nonmarket benefits and costs may not be feasible because of data limitations. Yet, even in these cases, transfer techniques are increasingly available to enable approximations of benefits (Johnston and Rosenberger, 2010).
Treatment of Risk and Uncertainty
The roles of risk and uncertainty on the socioeconomic effects of rebuilding may be evaluated by considering at least three broad aspects (Holland et al., 2010b): (1) what are the sources of risk and uncertainty in the design rebuilding plans; (2) whether to use (and model) a consistent decision framework that incorporates risk and uncertainty explicitly into the decision-making process (e.g., maximizing the expected value of the fishery subject to different types of stochastic shocks, see, Sethi et al., 2005); and (3) whether to estimate a distribution of outcomes for any alternative and present a range of possible outcomes rather than point estimates (e.g., Monte Carlo analysis).
The reviewed rebuilding plans and the alternatives considered addressed biological and implementation uncertainty in the evaluation of rebuilding times and in the employment of buffers in setting, for example, Acceptable Biological Catches (ABCs) and Annual Catch Limits (ACLs), as discussed in Chapters 3 and 4. Other sources of uncertainty, however, could inform the setting of rebuilding targets. For example, fish, labor, and fuel prices are uncertain over time. Currently, these other sources of uncertainty and risk are considered, if at all, at the time of generation of AOAs rather than during the determination of rebuilding targets. Uncertainty and risk are therefore treated in a sequential rather than simultaneous manner, which only considers a subset of the risks faced by managers and fishermen. Research in the decision sciences has shown that considering multiple sources of uncertainty simultaneously can lead to different management outcomes than can consider individual sources sequentially
(see, e.g., Sethi et al., 2005). Without further analysis, it is not clear whether this partial treatment results in buffers that are overly cautious or too risky from society’s perspective (see, e.g., Sethi et al., 2005; Kapau and Quass, 2013).
The NMFS guidance discusses risk and uncertainty but does not recommend use of a decision-theoretic framework, such as expected value analysis (Holland et al., 2010), which can consider and weigh multiple sources of risk simultaneously. Rather, the guidance focuses on the use of sensitivity analysis, which can investigate how a measure such as net present value changes when a parameter changes—the range of values for the parameter could stem from uncertainty about its future levels. Sensitivity analysis is informative but provides little guidance for the RMFCs on the relative importance of the uncertainty of one parameter over another or on potential synergistic or opposing effects of multiple types of uncertainty. Many sensitivity analyses present the impacts as point estimates rather than as a range of possible outcomes that would emerge from decision making under uncertainty.
Monte Carlo analysis represents an improvement over sensitivity analysis. With this approach, an analyst can evaluate the expected net present value, considering multiple sources of uncertainty at one time, and assign probabilities (or frequencies) to different outcomes. Monte Carlo analysis was used in the analysis of the AOA in response to Amendment 13 in the New England cod fishery (see Figure 6.2).19
A more standardized approach to accounting for risk and uncertainty in rebuilding AOAs will provide the RFMCs with a greater understanding of the implications of risk and uncertainty for decision making. The literature on decision making under uncertainty is rapidly advancing both in the understanding of how people respond to risk and in the ability to model and analyze decisions under uncertain condition. For example, recent advances in computing capacity have allowed researchers to develop a richer understanding of how investing in learning can influence the optimal set of decisions over time in the presence of multiple uncertainties (Walters, 1986; Bond and Loomis, 2009; Zhou et al., 2010). Operationalizing learning, risk, and uncertainty into an AOA might be years away, but these fundamental features are present in RFMC decisions and should be operationalized and considered rigorously.
SOCIAL IMPACT ANALYSIS OF ALTERNATIVES IN REBUILDING PLANS
This section discusses the NMFS guidance on social impacts and then the SIAs developed for a sample of rebuilding plans. As was the case for the committee’s review of the economic analyses, the focus is on two central questions. First, is the NMFS guidance for SIAs consistent with established approaches to the analysis of social outcomes and tradeoffs? Second, do EISs in rebuilding plans in practice incorporate analysis of these outcomes and tradeoffs?
NMFS Guidelines for Measuring Social Impacts
The NMFS guidance for SIAs aims to “provide Councils and fishery managers with an understanding of the objectives and techniques of SIAs …[laying] out the general process, analytical content and form of SIAs” (NMFS, 2007b). Whereas economic assessments address the market and nonmarket values and systems, SIAs consider the social and cultural values and systems, that is, the social characteristics of a fishery and community (i.e., social factor analysis) and the effects of social changes (i.e., social impact assessment). SIAs are used to predict potential adverse impacts from management changes or to evaluate the likelihood that the current social and cultural context has resulted from past changes in fisheries management associated with stock availability.
Although SIAs are required under NEPA, the MSFCMA amendments have expanded their scope to consider cumulative social impacts and to clarify social factors, aided by clear definitions of the fishing community20 and the charter, commercial, and recreational fishing sectors. The SIA calls for the use of a social factor analysis framework that identifies five major categories of social variables of interest in fisheries management: lifestyle (e.g., indigenous peoples, subsistence fishing, ethnic fishing practices); attitudes, beliefs, and values (e.g., fishery and community norms and values); social organization and structure (e.g., at the fishery, community, and family levels of analysis); population demographics (e.g., education, ethnicity); and dependence on and participation in the fishery (e.g., historical and present participation data). The social factor landscape is charted graphically to depict a baseline (i.e., community profile under the fishery management status quo), projections without management changes (i.e., social transitions under way and independent of fishery management), projections with management changes, and an overall social impact assessment, across each of the five categories (see NMFS, 2007b, p. 22 for the Framework for Social Factors Analysis table).
The prerequisite for an SIA is the development of the baseline case, or status quo in the fishery. Although the baseline arises from community profiles conducted every 3 to 5 years (NMFS, 2007b; Abbott-Jamieson and Clay, 2010), the funding and staff resources have been insufficient to update
_________________
19 Note that Monte Carlo and similar analyses require that the range of possible outcomes is bounded and that the probability distributions for these outcomes can be specified or approximated.
20 Community has many definitions in social sciences, but the MSFCMA defines fishing community as “a community which is substantially dependent on or substantially engaged in the harvest or processing of fishery resources to meet social and economic needs, and includes fishing vessels owners, operators, and crew and United States fish processors that are based in such a community” (16 U.S.C. § 1802, Sec. 3, 104-297 (16)). It is clear that fishing communities engage in fishing in a complex, multi-species manner, shifting between species and activities and through geographic space both on land and at sea (e.g., Hall-Arber et al., 2001; St. Martin and Hall-Arber, 2008; Tuler et al., 2012; Jacob et al., 2013).
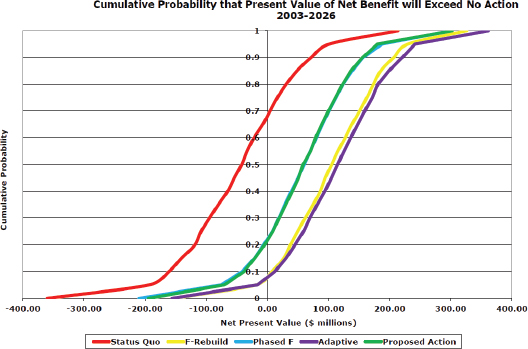
FIGURE 6.2 Cumulative probability that the net present values of the benefits of five different alternatives considered by the New England Fishery Management Council will exceed a no-action alternative over the period 2003-2026.
NOTE: The figure illustrates that there is a 70% chance that the net present value of benefit from the status quo, which represents maintaining the current rebuilding targets, will exceed the no-action alternative.
SOURCE: Northeast Multispecies Amendment 13 SEIS, December 18, 2003. Figure 201, p. I-603.
community profiles. Consequently more rapid assessment and streamlined methods for updating social baselines are being developed (Feeney, 2012; Tuler et al., 2012).
Estimation of the social changes from each alternative action should be grounded in the baseline information and assessed with the same variables used to estimate social change in the status quo. Occasionally the anticipated change in the status quo may be expressed in qualitative terms because some factors, for example lifestyle changes, are not currently or readily expressed in direct numerical terms. The guidance notes that the SIA may gather additional information through literature reviews, surveys, analytical deduction, focus groups, and Delphi methods (i.e., facilitated expert panels focusing on forecasting based upon the collective professional judgment), population samples, and statistical analyses, and they should be integrated with economic and biological assessments.21 Furthermore, the SIA “must forecast for a period of time (several years) beyond the year in which the conservation goal is attained…long enough to allow a consideration of all expected social effects. Care should be taken to ensure that the assessment time-frames are the same for the ecological, economic, and sociological impact analyses” (NMFS, 2007b). The guidance also identifies the wide range of methods for projecting social impacts.
Although the guidance for SIAs is consistent with widely accepted norms for SIAs, rapid advancements have been made and new methods have been developed since its 2007 publication. A few examples include performance measures—distributional outcomes, stewardship, and governance measures (e.g., Clay et al., 2010); well-being measures (e.g., Pollnac et al., 2006); and community vulnerability, resiliency, and dependency measures (e.g., Helies et al., 2010; Jacobs et al., 2013). For example, recently developed and streamlined vulnerability assessment tools apply theoretical and analytical frameworks from risk analysis and behavior research from the hazards and emergency management and environmental pollution control context (Tuler et al., 2012).
Analysis of Social Impacts in Practice
The committee’s review of selected rebuilding plans from across the country revealed that the scope and nature of their SIAs were widely variable (see Table 6.2).
Thus, the capacity of SIAs to provide comprehensive and valid perspectives on the social effects of rebuilding varies substantially across fisheries and RFMCs. Furthermore, although the SIAs reviewed incorporated innovative social sciences methods and indicators as they became available, the result has been SIAs that are difficult to compare over
_________________
21 The integration of social, economic, and biological assessments is predominantly achieved through the decision-making process via early involvement and cooperation among social scientists, economists, fishery biologists, and fishery managers.
TABLE 6.2 Elements of the Social Impact Assessments in Rebuilding Plans
|
|
|
| Rebuilding FMP | Scope of Social Impact Assessment |
|
|
|
| Red Snapper, |
|
| SAFMC |
|
|
|
|
| Cod & Haddock, |
|
| NEFMC |
|
|
|
|
|
|
|
|
|
|
|
|
|
| Canary Rockfish, |
|
| PAFMC |
|
|
|
|
|
|
|
|
|
|
time, which leaves unfilled the requirement that consistent baseline data be used to make projections. Furthermore, the use of economic data generated through benefit-cost analyses in regulatory decision making is generally more established than is the use of social assessments methods. The scope and nature of all socioeconomic data can be considered to be deficient; fewer social data than economic data are collected for fisheries management.
Forecasting Rebuilding Effects over Time and Space
With varying degrees of specificity, rebuilding FMPs acknowledge the social context and potential impacts, qualitatively, of management actions. For example, the red snapper SIA emphasized the social impacts on the shrimp fishing coastal communities from lower shrimp prices and higher oil prices and that the communities were still recovering from hurricane Katrina. Some communities were more likely to feel the impact of reduced shrimp fishing effort than others. In contrast, the SIA for cod and haddock within the New England multi-species groundfish complex fishery acknowledged a finer scale of social impacts and included sociocultural forecasts (see following statements from FMP Amendment 5, starting on p. 366 at NEFMC, 1993):
- “Fishing-dependent communities … will vary in their ability to adapt to the proposed actions.”
- “The sociocultural impacts will not be uniform across the region, across vessel sizes or even across gear types. Nor will the impacts be the same for each community, each generation of fishermen,
each ethnic group, and each organization. It is partly this certainty—that the impacts will vary—that creates anxiety among all who are involved in the fishing industry.”
- “The impacts of a restrictive management system, or of economic hardship brought about by declining stocks, will likely magnify…conditions, further polarizing groups within individual communities. The divisiveness could be exacerbated by members of one group only reporting violations by fishermen from ethnic groups other than their own.”
- “For a variety of reasons, including scientists’ earlier mistakes in predicting some stock sizes (e.g., herring) and past experience with regulatory change … many fishermen do not believe that the new regulations will have the positive benefits predicted. … Fishermen’s fears about the impact of the proposed measures could lead to a greater degree of non-compliance with regulations and/or technological innovations.”
Although the social impact forecasts for New England communities are relatively specific, they are not quantitative and do not analyze changes from baseline data to predict long-term trends. Nonetheless, the New England Fishery Management Council’s ongoing adaptive management activities indicate substantial advancements in the scope and nature of the SIAs from Amendment 5 (1994) to Amendment 13 (2001) and expansion of stakeholder engagement opportunities in Amendments 13 and 16 (2009), as the social sciences methods have progressed. However, it is not clear that these new applications of social analyses are part of a long-term baseline data collection effort.
Case studies for canary rockfish and other species show a similar pattern—RFMCs have incrementally increased the scope and nature of their SIA methods in subsequent FMP amendments. Although these advancements compound the challenge of establishing and systematically monitoring baseline social and economic data, they reflect critical development and evolution of the state of the knowledge. Furthermore, given the potential for disproportionate social impacts in specific communities, states are occasionally investing in additional social analysis to contribute to the overall social and economic impact assessment (e.g., Maine’s regulatory impact survey in Northeast groundfish/cod and Washington State’s depressed communities analysis in Pacific groundfish/canary rockfish).
Overall, however, baseline social impact data are rarely available, precluding forecasts of impact into the future and any qualitative or quantitative assessment of tradeoffs. For example, across the country 177 coastal community profiles were completed by 2005, with the intention of updating the profiles every 3 to 5 years, but staffing and funding limitations have prevented these updates (Abbott-Jamieson and Clay, 2010; Feeney, 2012).22 There have been comprehensive case studies to qualitatively characterize community vulnerability (e.g., McCay and Cieri, 2000 in Mid-Atlantic; Hall-Arber et al., 2001 in the Northeast), although the longitudinal monitoring does not exist.
Indicators of Social Impacts and the Models of Vulnerability
Because direct social data are rare, expensive, and time consuming to gather, particularly for the nonquantitative factors (e.g., social and community networks, cultural heritage values, subsistence fishing practices, etc.) that contribute to community dependence, resilience, and vulnerability, the use of indicators is one strategy to address this deficiency. Most commonly, indicators depend upon existing, secondary data, which emphasize the quantitative economic activity and outcome measures. However, numerous indicators for vulnerability are emerging, often with financial support and research staff contributions from the NMFS regional science centers. Each science center employs slightly different definitions and methods (see Box 6.3).
Applications of these new methods are improving the understanding of the scope and nature of social impacts and are enhancing opportunities for greater integration between social and economic impact analyses. For example, a 2011 vulnerability assessment of New Bedford, Massachusetts, illustrated the comprehensive community-wide impact from groundfish regulations, including employment of dock-side crew, damage to public docks, and other extended social impacts (Tuler et al., 2012). In addition to these social costs, considerable unmeasured economic costs are associated with these regulations (see the discussion of nonmarket and ecosystem service values in the economic sections above).
Although increasingly sophisticated social impact science is being developed and documented in rebuilding FMPs, a recent RFMC staff review of collection and use of sociocultural information concluded that “very little of the formal social impact assessment work done to date has been used in decision making” (Feeney, 2012). Others have identified slow progress toward inclusion of sociocultural analysis (Abbott-Jamieson and Clay, 2010), limited utility of qualitative descriptive social data in FMPs (Sharp and Lach, 2003), and, consequently, the likelihood that RFMCs will “see social impact assessments as more useful if those assessments were provided in a format analogous to fisheries economists and fisheries biologists’ formats [i.e., quantitative]” (Pollnac et al., 2006).
Furthermore, the guidance regarding economic and social analyses are not well integrated, which exacerbates challenges to their integration and utilization in management, particularly because both social sciences fields continue to
_________________
22 See http://www.st.nmfs.noaa.gov/humandimensions/community-profiles/index for comprehensive dataset of community profiles.
BOX 6.2
Advances in Vulnerability and Resiliency Measures
Rapid Impact and Vulnerability Assessment (RIVA)—New England
Building from concepts of risk vulnerability in environmental pollution and risk analysis (i.e., exposure, sensitivity, adaptive response actions, and adaptive capacity), the rapid impact and vulnerability assessment (RIVA) model was developed and refined through support from the NMFS Northeast Fisheries Science Center. RIVA gathers field data (e.g., interviews, secondary data sources) and analyzes causal pathways linking stressors, consequences, and the factors contributing to vulnerability. Through an iterative qualitative and graphical analytical strategy, themes of potential causal links emerge and are ground-truthed with community informants (see http://seri-us.org/sites/default/files/RVA%20guidance.pdf).
Social Vulnerability Index (SoVI)
The index synthesizes 30 socioeconomic variables, primarily from the U.S. Census Bureau, to measure a community’s ability to prepare for, respond to, and recover from changes in regulations. SoVI was used in the Pacific canary rockfish FMP amendment process. The SoVI project team identified seven indicators that have explained 69% of the variability in vulnerability measures (i.e., race and class; extreme wealth; elderly residents; Hispanic ethnicity; care-dependent females; Native American ethnicity; and service industry employment). It applied the measure to coastal counties and compared counties (see http://webra.cas.sc.edu/hvri/products/sovi.aspx).
Vulnerability Index—Gulf of Mexico
This is a composite measure from indicators of social, economic, and ecological vulnerability and resiliency, and social disruption. Social vulnerability and resilience are measured with their own cluster of indicators, including population composition, poverty, and housing characteristics. Economic structure underlies economic vulnerability and resiliency, whereas natural and technological disaster measures are indicators of ecological resiliency. Social disruption is measured by housing, economic, and personal disruption measures. Another iteration of the Vulnerability Index applied in the Gulf consists of measures of employment opportunity and community well-being from U.S. Census Bureau and other data sources from the SIA (see Jepson and Jacob, 2007; Helies et al., 2010; Jacob et al., 2013).
Engagement, Dependence, Resiliency Metrics—Pacific Council
This is an annual engagement measure for commercial (total number of vessels with at least one landing by port; total commercial ex-vessel revenue by port; and total buyers that received at least one landing by port) and recreational fisheries (number of charter vessels per port, total rental charter trips by port). Dependence is a composite measure of vessels or revenues from a particular fishery as a proportion of total vessels and fishery, both commercial and recreational. Resiliency metrics are a suite of indices to collectively represent county-level resiliency and permit comparisons across communities. Indices include an industry diversity index modified from the ecosystem diversity Shannon-Weaver Index, population density, unemployment rate, percentage of population below the poverty line, and isolation of cities (see http://www.pcouncil.org/wp-content/uploads/1112GF_SpexFEIS_ApdxE_vulnerability_analysis_100806b.pdf).
experience methodological advancements. For example, emerging bio-economic tradeoff analyses account for economic and biological dimensions, but not other, potentially significant social implications (Daniel et al., 2012).
Public Participation and Consideration of Social Impacts
As described on the Pacific Fishery Management Council website, “The Council process is a bottom-up process, emphasizing public participation and involvement in fisheries management. Public input is encouraged and appreciated.”23 Similar statements can be found from other RFMCs, because the fisheries management process is highly participatory. The mandated administrative procedures of fisheries management provide for considerable public hearings, testimony, comments, and other opportunities to hear from interested stakeholder groups. In fact, during the 2012/2013 Gulf of Maine cod quandary, the NEFMC and NMFS Northeast Regional Office increased opportunities for public comment, including a series of community meetings “to discuss commercial and recreational fishery management alternatives. [and] to provide opportunity for commercial and recreational fishermen and others to provide input to help inform what management measures we ultimately adopt.”24 A February 1, 2012, joint statement from the NOAA Acting
_________________
24http://www.nero.noaa.gov/nero/hotnews/gomcod/Gulf%20of%20Maine%20Cod%20Working%20Group%20Meeting.pdf.
Assistant Administrator for Fisheries, Samuel Rauch, and NEFMC Chair Rip Cunningham on joint meetings with the fishing industry concluded, “[W]e know whatever measures are ultimately adopted will have economic impacts on fishermen and fishing communities. Together, we remain committed to identifying measures that will keep fishermen on the water and allow this iconic resource to continue to rebuild.”25 Thus, public participation is providing an avenue for social information to reach and potentially influence fisheries management in ways that formal, systematic, and rigorous social sciences and impact assessments appear to be unable to do.
Public participation infuses the sociocultural information into the RFMC deliberations, although measuring and characterizing the impact or influence of this information (i.e., operationalizing influence) is difficult and typically not done. The RFMC report that found very little use of SIAs confirmed in a small survey that RFMC members learn of potential social impacts in a variety of ways: informal conservations with stakeholders; stakeholder comments at public meetings; and personal perceptions, knowledge, and experience. These informal sources comprised 60% of the RFMC members’ sources of information on social impacts, whereas FMP documents and presentations from RFMC staff or social scientists comprised only 20% (Feeney, 2012). Thus, socioeconomic impact information influences the management of an overfished stock, but more likely through an informal, nonsystematic, and less rigorous process than through the formal, systematic SIA process. Empirically assessing how information or input influences decision making is an emerging field of study and has not been applied in fisheries management (see, e.g., Betsill and Corell, 2008; Dur, 2008).
Nonetheless, there are considerable benefits to an open and transparent participatory process, including building the capacity to enhance the credibility and legitimacy of the process in the eyes of stakeholders, enhance mutual understanding, build trust, resolve or avoid disputes, increase stakeholder acceptance of management, and contribute to greater likelihood of compliance with the rules (e.g., Jentoft and McCay, 1995; Berkes et al., 2000; Kapoor, 2001; Berkes, 2004, 2007; Wilson, 2009; Pita et al., 2010). At the same time, participatory processes have limitations—that is, slower decision making may favor the well-funded, connected, and vocal stakeholders over the disadvantaged (see, Mikalsen and Jentoft, 2003; Suarez de Vivero et al., 2008).
Social Impact of Managing Risk and Uncertainty
The treatment of risk and uncertainty is a challenge for fisheries science, as discussed in earlier chapters. However, how risks and uncertainty are addressed, discussed, and managed in fisheries management also has an impact on stakeholders. For example, the retrospective bias in stock assessments and substantial and rapid fluctuations in the stock’s status (referred to colloquially as whip-saw and yo-yo effects) can have a negative impact on stakeholders and the overall climate for fisheries management. In New England, significant and rapid reductions in fishing effort from one year to the next have occurred for Georges Bank yellowtail, Gulf of Maine cod, witch flounder, pollock, Georges Bank cod, Georges Bank winter flounder, and plaice (Nies, 2012). At a minimum, sudden reductions such as these complicate management and create frustration among managers, industry, and other stakeholders. At the same time, they can undercut the perceived credibility and legitimacy of stock assessment science (and resulting rebuilding plans) among stakeholders. Here, credibility refers to whether stakeholders, such as fishermen or nongovernmental organizations (NGOs), perceive fisheries science and stock assessment methods as meeting a standard of plausibility and adequacy, whereas legitimacy refers to whether stakeholders perceive the output of the stock assessment process as unbiased and meeting the standards of fairness (Wilson, 2009).
Tools and strategies for discussing and addressing such uncertainty within a participatory process are emerging. For example, the International Council for the Exploration of the Seas (ICES) Working Group on Fisheries Systems considered the social implications of underemphasizing and overemphasizing uncertainty. It recommended addressing uncertainty in a transparent manner, early and continuously in the fisheries decision-making process, and identified specific tools for doing so. The “pedigree analysis” is a multi-criteria, qualitative characterization of the origins and status of information and data (Dankel et al., 2012); that is, it is a systematic documented tracking of the pathways of information and data use—where information and data originate, how they are used, what assumptions are made about the information and data. A panel of experts uses an uncertainty matrix to numerically rate the nature and scale of the uncertainty on several defined parameters (Walker et al., 2003). Systematic, diagnostic methods such as these can be coupled with extended peer-reviewed interviews of communities, involving multiple disciplines and stakeholder perspectives (Wilson, 2009; Dankel et al., 2012).
Uncertainty can be pervasive in data-poor situations in which managers must use whatever data are available to construct reasonable FMPs. Managers in many data-poor situations employ participatory approaches and incorporate traditional or local knowledge when considering alternative options. The Q-method has been used to identify and quantify fishermen’s ecological knowledge and bias (Carr and Heyman, 2012).26 Furthermore, data-poor situations are
_________________
25http://www.nero.noaa.gov/nero/hotnews/gomcod/StatementRauch-Cunningham021012.pdf.
26 The Q-method is based upon the conceptual framework of factor analysis, seeking correlations between variables. It is concerned with individuals’ viewpoints, seeking shared views or correlations across a sample of individuals and clarification on points of agreement and disagreement. Danielson et al. (2010) evaluated the use of Q-methods in evaluating public
often accompanied by limited resources for monitoring and enforcement. In these situations, participatory monitoring activities have been constructive in managing the risk and uncertainty (Parma et al., 2003; Bently and Stokes, 2009).
One strategy that aims to increase the transparency of the stock assessment modeling has been participatory modeling—it has been more commonly applied in nutrient load and watershed management, although it has been explored in a fisheries context. Rockmann et al. (2012) illustrated the potential of participatory modeling in stock assessment—facilitating and structuring dialogue about uncertainty and the quality of the state of knowledge among scientists and stakeholders, enhancing scientific understanding, and increasing the perceived legitimacy of the process among stakeholders. Participatory modeling has become an effective tool to advance openness and transparency in joint problem solving, but it has been less effective generating sophisticated modeling outputs.
Well-designed collaborative research methods have proven potential to directly enhance the credibility and legitimacy of the resulting science; increase acceptability of management actions; produce greater mutual understanding and trust among partners; and enhance opportunities to integrate diverse sources of knowledge about the coastal and marine environment (NRC, 2004; Conway and Pomeroy, 2006; Hartley and Robertson, 2006, 2008, 2009; Johnson and van Densen, 2007; St. Martin et al., 2007; and Heyman, 2011).
Fisheries Management and Rebuilding
The development and success of rebuilding plans cannot be fully understood outside of the broader context of fisheries management within which they are implemented. For example, the management institutions and approaches used to control harvest under rebuilding plans affect the incentives offered to fishermen. These in turn can affect fishing behavior and the biophysical and socioeconomic outcomes of rebuilding. This section discusses the potential interactions between the ways that fishery management occurs (and has occurred) in the United States and the outcomes of rebuilding plans, with particular emphasis on incentives for specialization and attendant impacts on the short-term costs of rebuilding.
The historical paradigm for managing fisheries in the United States has been to allocate a portion of a species’ Total Allowable Catch (TAC) to fishing sectors (usually defined by gear type or size of fishing vessel) and to accompany this allocation with additional controls on fishing locations, seasons, technology, and entry. In the West Coast ground-fish fishery, for example, the TAC for sablefish is allocated to a trawl sector, fixed gear sector, and open-access sector (smaller fishing vessels), and there are also entry and gear restrictions and no fishing zones (PFCM, 2011a). Scholars denote fisheries such as this one as regulated open-access or limited-entry fisheries (Wilen, 1985; Hanna et al., 2000).27 For fish stocks and regions that have avoided overfished and overfishing status, the current approach has received some measure of success at least from a biological perspective. However, the incentives created by regulated open-access or limited-entry regulations also affect the economics of fishing and the resilience of coastal communities—the implications of which are becoming clearer over time (St. Martin and Hall-Arber, 2008; Tuler et al., 2012). A declaration that a fish stock is overfished implies that past management approaches (reflecting the historical paradigm) have failed to maintain stocks and economic returns at desired levels (see, e.g., Sanchirico and Wilen, 2007; World Bank, 2009) and therefore have stressed the economic and social fabric of local fishing communities (Hall-Arber et al., 2001; Georgianna and Shrader, 2008; Portman et al., 2009; Tuler et al., 2012).
The potential negative economic and social impacts from regulated open-access or limited-entry commercial fisheries are well-known, as are their solutions (see, e.g., Wilen, 1985; Homans and Wilen, 1997; World Bank, 2009). For example, fishermen have been observed to increase investments in certain inputs (e.g., size of boat, engine horsepower, sonar, type of gear) as other inputs become more constrained by regulation (see, e.g., Wilen, 1985). This type of behavior, while economically justifiable for any fishermen, increases the costs of fishing and reduces profit margins and the ability to mitigate shocks to revenue in any year. Rather than discuss all of the well-known impacts of these regulations, the committee focused on three specific impacts because of their particular relevance to the broader socioeconomic outcomes of rebuilding: (1) the inability of fishermen to adjust their fishing practices throughout the year; (2) the lack of diversity of the fishing operations; and (3) the impacts on community resilience.28 We note, however, that empirically disentangling one impact from the others is difficult.
In regulated open-access fisheries that have experienced overfishing, the typical regulatory response has been to
_________________
participation processes. They noted the advantages (i.e., relies on a minimal number of research participants, is very efficient) and limitations (i.e., does not permit generalization to a population, requires considerable expertise to carry out, and results can be sensitive to sample selection).
27 Whether a fishery is regulated open-access or limited-entry is based on the presence or lack of controls on access. Regulated open-access fisheries are open for entry, but the fishing enterprise operates under a set of regulations (e.g., closed seasons and restrictions on areas, gear, and catch totals).
28 We focus here on the regulatory institutions that existed at the time the stocks were classified as overfished. In the United States, no fish stocks were classified as overfished that were under an individual fishing quota management system at the time of classification. This does not mean, however, that more rights-based approaches (e.g., catch shares) are immune to creating similar specialization, e.g., an individual quota allocation might be restricted to a particular species in a particular location and sometimes with a particular gear type. On the other hand, rights-based approaches can and often do reduce other constraints on the fishing operation in regulated open-access fisheries, such as short fishing seasons, and there is nothing inherent in their design to require such restrictions (see, e.g., Sanchirico et al., 2010, for a discussion of programs in New Zealand, Australia, Iceland, Canada, and the United States).
reduce fishing mortality and hence catches of commercial and recreational fishermen. These goals have often been achieved at least in part through use of “input controls” that restrict how, where, and when a fisherman is able to fish. These controls constrain fishing operations, for example with shorter seasons, reduced fishing areas, or reduction in gear efficiency (Homans and Wilen, 1997). If estimates of the fish stock abundance continued to move downward, then these constraints typically have been increased to prevent the stock reaching an overfished status.
Regardless of whether additional input controls on the fishing operation effectively addresses overfishing, the constraints reduce the ability of the fishing operation to adapt (e.g., timing and spatial fishing location) to changes related to a rebuilding plan. The implication is that the ability to adapt behavior to mitigate the short-term economic costs associated with further reductions in fishing mortality due to rebuilding is lowered, everything else being equal. Thus, common input-control approaches to fisheries management can exacerbate the short-term costs associated with rebuilding, because they restrict the adaptation possibilities available to fishermen.
The second economic and social impact from regulated open-access or limited-entry fisheries is the institutionalization of specialization in fishing operations. For example, restrictions on allowable gear types, combined with non-transferrable licenses associated with fish stocks, can restrict a fisherman’s ability to switch between stocks. Specialization has economic advantages; for example, it can reduce the costs of fishing or increase revenues from fishing. In addition, there might be ecological advantages if specialization results in the use of more selective fishing gear and therefore reduces bycatch (see, e.g., Garcia et al., 2012, for arguments against increasing selectivity).
Specialization also results in a lack of diversity in fishing portfolios (Kasperski and Holland, 2013) and is often accompanied by large capital investments in fishing technology suitable for a limited number of stocks. The lack of diversity and highly capitalized fleets are not necessarily an issue when a fishery is healthy and catches are controlled. However, if the fishery is driven to overfished status (either because of fishing or environmental factors), then the economic costs from reductions in catch are likely to last longer and be greater than if the fishing operations were less specialized and capitalized (i.e., allowing fishermen to adapt more successfully to additional constraints on the harvest of particular stocks). In fisheries, a more diverse fleet could mitigate some of the costs associated with rebuilding by focusing effort on other species in the same area or other fishing regions. This type of behavior is currently restricted by regulatory approaches that reduce the flexibility of fishing operations.
Third, the effects of institutionalizing specialization on the fishing sector can ripple throughout the community. Specialized and highly capitalized fishing fleets require, for instance, specially trained processing and support industries, and the overdependence of these industries on a few fish stocks increases the risks for large economic and social downturns in coastal communities if the stocks become overfished and rebuilding plans are implemented. For example, a 2011 vulnerability assessment of New Bedford, Massachusetts, illustrated the comprehensive community-wide impact from groundfish regulations (Tuler et al., 2012). The fisheries management actions contributed to a reduction in the fleet size, with corresponding decline of support services—less fuel, ice, and repair services. The function and employment of lumpers (crew who unload fish at the dock) changed: in response to regulatory constraints on when vessels could leave or return to dock and fewer vessels operating, lumpers accepted work whenever it was available and made themselves available 24 hours a day, 7 days a week, including for back-to-back boat unloading. In addition, more vessels remaining at dock resulted in dock crowding, which in turn made it difficult for fishermen to conduct repairs and affected the condition of vessels and gear. Crowded docks also contributed to increased damage to the dock, including from increased spills of hazardous materials.
Expanding Flexibility through Management Measures
RFMCs might pursue a number of options in conjunction with implementing a rebuilding plan to introduce more flexibility for fishermen and fishing communities. For example, the U.S. West Coast groundfish fishery individual fishing quota system (catch share) allows for risk pools, which are ways for fishermen to mitigate the costs associated with very low bycatch levels of canary rockfish (Holland, 2010c; Holland and Jannot, 2012). Additional flexibility, however, will not mitigate all of the near-term costs and will not reduce the potential for necessary reductions in the fishing fleet size after rebuilding has occurred.
Other ways to improve flexibility include permitting conversion of sector-based individual fishing quota allocations from one gear to another (e.g., mobile gear quota for West Coast sablefish converted to fixed gear), removing or lessening season length or area restrictions, and permitting conversion of either quota for one species to another or days at sea for one species for another (not necessarily at a 1:1 ratio). For example, Iceland permits the conversion of quota for one species to another (e.g., cod to Greenland halibut) within its individual fishing quota system (Sanchirico et al., 2006). To avoid significant overages in any one species’ TAC, Iceland uses trading ratios and caps on the amount of species conversion that an owner can undertake within the season.
Unlike disaster relief or vessel buyback programs through which fishermen receive direct compensation, these actions attempt to directly address the flexibility (or lack thereof) of fishing operations by providing opportunities for fishermen to mitigate some of the costs associated with rebuilding by changing their behavior (e.g., fishing for
TABLE 6.3 Illustration of Measures Taken to Mitigate Socioeconomic Impacts of Rebuilding
|
|
|
| Rebuilding FMPs | Mitigation Measures |
|
|
|
| PFMC: Canary Rockfish | Trawl vessel buyback program removed 34% of vessels with groundfish permits in 2004 (Hanna, 2010) |
| NPFMC: Bering Sea Snow Crab | Federal relief money for Alaska coastal communities (NPFMC, 2000) |
| Federal loan program to buy out vessels (U.S. Department of Commerce, 2004) | |
| NEFMC: Gulf of Maine cod | $30 million to assist industries and communities to develop alternative fisheries, improve fishery infrastructure, provide job training (Amendment 5, NEFMC, 1993) |
| $22 million voluntary vessel buyback program (Wang and Rosenberg, 1997) | |
| Congressionally mandated cooperative research (Hartley and Robertson, 2006; Hanna, 2010) | |
| $16 million to assist industry transition to sector management and $10 million to develop data reporting and fishery monitoring system (NOAA, 2009) | |
| Allowing 2012 year’s groundfish quota to carry over to 2013 in order to “help mitigate some of the economic impact on the fishing industry” (Bullard, 2013) | |
|
|
|
different species, times, and locations). In many respects, the flexibility added by these actions might improve the resilience of the communities and fishing industries to future shocks, whether or not they come from an overfished declaration.
Government Mitigation Measures
By law, overfished stocks require a rapid management response, even if the socioeconomic impacts are difficult to measure or predict or are believed to be severe. Fishing communities feel these impacts and respond to perceived and real harm (e.g., seek relief through the court system, appeal to state and federal elected officials). This social response has been observed in many contentious resource management processes and is not unique to fisheries—for example, limiting timber harvests due to the presence of endangered spotted owls (Noon and Murphy, 1994), California water resource management (Hundley, 2001), and wolf management and restoration (Nie, 2001). Managers and elected officials have used disaster relief packages, Congressional earmarks, and other mitigation measures to address the social and economic displacement of fishermen and fishing-dependent communities once a fish stock is declared overfished. These measures differ in a number of dimensions, including whether the measure operates within or outside the FMP and whether the measure is implementable within the RFMC or requires Congressional approval. For example, government responses that operate outside of rebuilding plans include declarations of fisheries disasters, vessel buyback programs, loans and direct funding opportunities, collaborative research, data reporting and monitoring systems, and other mechanisms (Hanna, 2010). Additionally, the U.S. Congress can and has acted on its own to provide various forms of financial relief, mandate or direct specific NOAA action, or support other stakeholders directly.
Table 6.3 contains a small sample of mitigation measures for several rebuilding fisheries, including measures taken within and outside the FMP. In the Gulf of Maine cod, for example, recent measures to partially mitigate the socioeconomic impacts of an otherwise-mandated reduction in harvest included an invocation of section 304(e)(6) as justification for 1-year interim action to reduce rather than end overfishing on the stock, a federal disaster declaration, and a transfer of 2012 carryover quota to 2013. A request for a second 1-year interim action was declined by the NOAA Regional Administrator in 2013. Another example is provided by the emergency rules adopted in the South Atlantic red snapper fishery that permit recreational 3-day weekends and commercial mini-seasons, temporarily lifting the harvest moratorium in response to lower-than-expected discard mortality (SAFME, 2012).
The effectiveness of many of these ad hoc measures has been questioned in the United States and internationally (Holland et al., 1999; Minnegal and Dwyer, 2008). The findings from rigorous socioeconomic research have been used to inform and guide impact assessments, not to inform and guide the design and implementation of mitigation options (e.g., with the goal of targeting relief to the communities more impacted, with the greatest vulnerability and least resilience). This gap presents a substantial opportunity for the application of social and economic sciences in fishery rebuilding.
SUMMARY
The primary focus of the MSFCMA’s rebuilding mandates on biological conservation contributes to tensions
among managers, fishermen, elected officials, and other stakeholders, particularly when these mandates constrain flexibility to address socioeconomic consequences. Several factors can contribute to these tensions, including divergences between expectations and reality in rebuilding trajectories, lack of understanding of the social and economic context within which rebuilding plans are implemented (because of a lack of data and analysis), and the disconnect between the participatory process—where socioeconomic impacts are often discussed but not systematically assessed—and the FMP outcome. Unexpected (or concern for potential) social and economic outcomes are often addressed outside of an FMP through federal disaster declarations, Congressional initiatives, and other ad hoc efforts. These efforts are rarely informed by social sciences and thus may not achieve their full potential or intent (e.g., ineffective buyback programs, or financial assistance not targeted at communities with largest impacts). Despite evidence of success in the biological rebuilding of many fish stocks, the social and economic dimensions of rebuilding (including both behavioral drivers and consequences) cannot be taken for granted as deterministic functions of fisheries stock size.
Current understanding of the socioeconomic consequences of rebuilding is limited by a lack of detailed analyses conducted after rebuilding plans have been implemented. Although some studies provide rudimentary ex-post assessments of the economic and social impacts of rebuilding plans (e.g., by measuring changes in fishing revenues that have occurred when catch increases because of rebuilding, such as NRDC, 2013), there is an overall dearth of rigorous ex-post assessments of rebuilding plans across economic and social dimensions. The lack of retrospective socioeconomic analysis leads to uncertainty over the net economic and other social benefits of rebuilding that have been realized, in contrast to those that are predicted. As discussed above, economic and social analyses of rebuilding plans (e.g., as part of Environmental Impact Statements, Regulatory Impact Review, and Social Impact Assessment) are only required prior to implementation. There is no requirement for NMFS or others to conduct follow-up, retrospective, or ex-post economic or other social analysis.
Challenges to measuring impacts ex post include the lack of data and the difficulty of establishing what would have occurred in the absence of a rebuilding plan (i.e., counterfactual conditions). Measuring the impacts from rebuilding, for instance, requires disentangling changes in net benefits due to a single rebuilding plan (reduction in F and TREBUILD) from changes that might have occurred due to exogenous factors (e.g., habitat change, economic conditions) and endogenous factors (e.g., change in regulatory structure). For example, the recent shift to sector management in New England will confound any analysis of the economic gains and losses associated with the rebuilding plan, because the two occur simultaneously. The lack of ex-post assessments of regulations is not unique to fish stock rebuilding—other agencies such as the Environmental Protection Agency have discussed the general lack of ex-post economic analyses (e.g., U.S. EPA National Center for Environmental Economics, 2012). Without rigorous ex-post analyses, however, it is impossible to quantify the net economic or other social benefits that have been realized from rebuilding plans.
FINDINGS
6.1: Compliance with the MSFCMA requires that economic and social considerations for rebuilding plans are contingent on biological mandates being met. Rebuilding plans that do not meet the biological mandates cannot be adopted, even if doing so would improve projected socioeconomic outcomes.
6.2: The requirement to rebuild within 10 years, whenever possible according to the biology of the stock, reduces the flexibility to adapt rebuilding plans according to economic and social considerations.
6.3: Socioeconomic considerations influence the management of overfished stocks through the public participation process (e.g., public testimony to RFMCs regarding the magnitude of socioeconomic impacts). Stakeholder participation and concerns regarding the impacts of rebuilding plans can result in ad hoc mitigation measures (e.g., disaster relief assistance) that operate outside of the fishery management process. The designs of these measures are not fully informed by social sciences, and their implications on other fisheries and on the long-term social and economic viability of coastal communities are not fully known.
6.4: The mandate that rebuilding targets must be met with a certain minimum probability, along with the requirement to utilize the most current stock assessments, may lead to marked changes to rebuilding plans based on new data and/or models as they become available. These adjustments can cause economic and social impacts, potentially both positive (e.g., rebuilding ahead of schedule and increases in allowable catch) and negative (e.g., rebuilding behind schedule and decreases in allowable catch). Although these adjustments may reflect best available science, they can influence the perceived credibility of the science among stakeholders.
6.5: The guidance on economic and social methods to use in the analysis of the alternative harvest control rules is consistent with best practices, but its implementation is variable across rebuilding plans and between RFMCs.
6.6: The treatment of uncertainty is not integrated across the ecological, economic, and social dimensions of rebuilding plans. Because of the challenges of addressing the many types of risk and uncertainty in fishery management, the cumulative risk tradeoffs are not well understood. Con-
sequently, it is not clear whether the appropriate level of precaution is being applied.
6.7: In considering different management alternatives for meeting rebuilding targets, the information provided to the RFMCs is most relevant for short-term economic impacts on the commercial and recreational fishing sectors and local communities. Although models may forecast socioeconomic outcomes over longer time periods, the simplifications and assumptions of these analyses limit their relevance to longer-term forecasting.
6.8: When evaluating socioeconomic outcomes of rebuilding plans, the RFMCs primarily focus on the economic impacts on commercial, recreational, and related fishing industries. The analysis of different management options rarely quantifies impacts on nonmarket ecosystem services or nonfishery benefits.
6.9: Retrospective reviews of the broader socioeconomic impacts of rebuilding plans are rare, at least partially because of limited data availability. These socioeconomic impacts include changes in the structure of the commercial fishing sector, economic returns, recreational values, fish processing industry, and culture of fishing in communities.
6.10: Methods exist and innovations are emerging in economic and social sciences approaches to characterize the breadth of economic and social impacts of rebuilding plans and the factors that contribute to the success of these plans, although they have not yet been broadly applied, tested, and refined to meet the information needs.
6.11: The nature of fisheries management can lead to situations that exacerbate the economic and social impacts of meeting rebuilding targets by institutionalizing the specialization of the fishing industry (including fishing fleets, processing, and related support businesses). These constraints reduce the ability of the fishermen and community to mitigate the costs associated with curtailing catches.


