
Review of Federally Implemented Rebuilding Plans
INTRODUCTION
Fishery Management Plans are developed with a main goal of preventing overfishing, and rebuilding plans are required to rebuild overfished stocks. Nationwide implementation of the rebuilding requirements of the Magnuson-Stevens Fishery Conservation and Management Act (MSFCMA) posed difficult challenges for both the National Marine Fisheries Service (NMFS), responsible for providing the technical support for the determination of stock status and for designing rebuilding plans, and the Regional Fishery Management Councils (RFMCs), responsible for selecting and implementing rebuilding plans for every stock determined to be overfished. In this chapter, the committee reviews the approach followed to implement the mandates of the MSFCMA, as well as the outcomes of the adopted management actions from the perspective of single-stock rebuilding. After introducing some basic concepts and definitions, this chapter discusses the components of formal rebuilding plans, the methods used to conduct rebuilding analyses, and the characteristics of some of the adopted plans.
The committee’s review of outcomes of rebuilding plans proceeds from a broad summary of fish stock status nationwide to a more detailed analysis of the evolution of the status of those stocks that were determined to be overfished since 1997 (using criteria specified by the 1996 Sustainable Fisheries Act), based on the annual reports presented to Congress on the status of federally managed fisheries. A more in-depth analysis of estimated trends in fishing mortality and stock size was conducted for a subset of the stocks that are assessed by means of quantitative models, using the most recent stock assessment results made available by NMFS. The empirical analysis of outcomes of rebuilding plans, as is often the case in policy analysis, has limitations because such policy interventions are uncontrolled experiments that lack the counterfactual: we do not know what the stock trajectories would have been without a rebuilding plan. Even if causality cannot be inferred, outcomes can be examined conditional on initial stock status, as evaluated in retrospect, and on the effectiveness of management to regulate fishing mortality. The analysis focused on three main questions approached in a step-wise manner: (1) how reliable are the classifications of stock status that triggered the implementation of rebuilding plans? (2) how successful are rebuilding plans at reducing fishing mortality? and (3) how are stock sizes responding? The underlying causes of failures to reduce fishing mortalities as planned are examined for a few selected cases. Finally, although strict comparisons among regions is not possible given the different realities of fisheries and fishery management institutions, a brief review of rebuilding approaches and outcomes in a few other countries and regions is presented to place the U.S. situation within an international perspective.
STOCK STATUS DETERMINATION
Under the National Standard 1 Guidelines (NS1G, see Chapter 2), a stock is overfished when its stock size (or stock biomass, B) is less than the Minimum Stock Size Threshold (MSST),1 which for many stocks is defined to be ½ BMSY (Figure 3.1(a), horizontally shaded area). A stock is subject to overfishing when the fishing mortality rate (F) exceeds the Maximum Fishing Mortality Threshold (MFMT), which cannot exceed FMSY,2 indicated by the vertically shaded area in Figure 3.1(a). Consequently, stocks in the cross-hatched region of Figure 3.1(a) are both overfished and subject to overfishing.
_________________
1 50 C.F.R. 600.310 (e)(iv)(2)(B)-(E) (2009).
2 50 C.F.R. 600.310 (e)(iv)(2)(B)-(E) (2009).
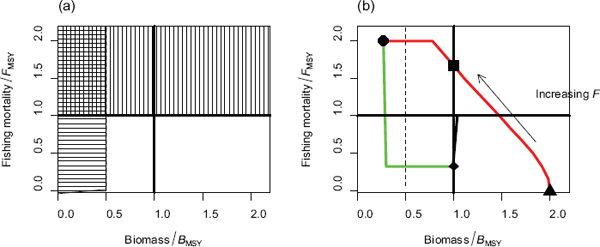
FIGURE 3.1 A phase plane plot, which is a graphical representation of changes in the status of the fishery with time with respect to realized fishing mortality and biomass. (a) The phase plane template showing regions of relative fishing mortality F/FMSY and relative biomass B/BMSY. Regions that are shaded horizontally represent overfished states (B<½BMSY), while regions that are shaded vertically indicate that overfishing is taking place (F>FMSY). Cross-hatched areas therefore represent the situation where a population is overfished and overfishing is taking place. (b) An example trajectory that a population might take from an unfished state as fishing gradually increases until overfishing takes place, leading to biomass levels that are overfished. At this point, a rebuilding plan might go into effect, leading to reduced fishing mortalities that consequently allow biomass to increase and move back about BMSY.
Generic phase plane plots (often referred to as “Kobe” plots) are used to illustrate the stages of a fishery based on the relationship between fishing mortality rate (relative to FMSY) and stock size (relative to BMSY). Over time, stocks move in the Fishing mortality-Biomass phase plane. By plotting a fishery by stage from unfished, through stages of increased fishing, overfishing, overfished, reduced fishing, rebuilding, and ultimately to a position above BMSY, phase plane plots illustrate the generic intent of the MSFCMA for overfished stocks (Figure 3.1b). A stock is rebuilt when stock size is at levels appropriate to achieve Maximum Sustainable Yield (MSY), and this outcome is maintained on average by keeping F=FMSY (although a lower fishing mortality should reduce the risk of overfishing and of the stock becoming overfished again).
The solid triangle in the bottom right corner of Figure 3.1b indicates a stock at its unfished level. Fishing mortality increases from the start of the fishery so biomass declines, as indicated by the arrow and the red line. The stock is subject to overfishing once fishing mortality exceeds FMSY (1.0 on the y-axis). The biomass drops below BMSY (solid square) and then below the MSST, given fishing mortality substantially in excess of FMSY. The stock would be considered to be in an overfished state once it drops below the MSST. A rebuilding plan is then implemented (solid circle), and fishing mortality rates are reduced to FMSY or below. The stock increases under lower fishing mortality (green lines), eventually recovering to BMSY (diamond), when fishing mortality is increased back to close to FMSY. Figure 3.1b is idealized for several reasons. For example, it includes no assessment error and no variability in recruitment, and it assumes that management decisions are implemented exactly.
In reality, the ability to provide scientific management advice, including stock status determinations and stock projections used to develop rebuilding plans, is subject to several sources of uncertainty. These sources can be categorized as follows:
- Data uncertainty: Data uncertainty results from two main sources: (1) Bias—how the data represent the processes being monitored (e.g., changes in commercial catch per unit effort [CPUE] relative to actual changes in biomass) and (2) Variation—how variable are the sample observations of the system (which can be influenced by system variability, but also by the methods and frequency used to observe it).
- Model uncertainty: All models characterize nature in a simplified manner. In many cases there may exist several plausible, but different, assumptions that are supported by the data to a similar extent but have very different implications for stock status and management. Choices of assumptions contribute to model uncertainty.
- Implementation uncertainty: Management actions are devised to control fishing mortality, but they only do so indirectly through catch and effort controls and technical measures (discussed below).
The effectiveness of regulations is uncertain given enforcement challenges and the fact that fishermen responses to regulations are difficult to anticipate.
- Unpredictability of nature: Some aspects of nature are quite variable (e.g., the size of future-year classes) and therefore very difficult to predict. Future states of nature, including population size, are modeled probabilistically, so that a reasonable range of future outcomes can be described in the context of evaluating rebuilding plans. Assumptions about the likelihood of future states of nature lead to uncertainty.
Stock assessment scientists use the best-available scientific methods to estimate stock size and fishing mortality rate. They can also make reasonable short-term projections of future stock size, especially for the well-studied fish populations. Future production is more difficult to estimate because the relationship between recruitment and biomass of spawning fish is highly variable and uncertain. FMSY is often set to an assumed value derived from life history parameters (i.e., a “proxy”) based on general experience with similar stocks elsewhere when it cannot be estimated with an acceptable degree of confidence. Setting a proxy for BMSY is more challenging than setting a proxy for FMSY, because BMSY depends on FMSY and because BMSY relies on an estimate of (or assumption about) the absolute magnitude of the average recruitment at which MSY is achieved.
Unfortunately, many U.S. stocks are not well enough studied to allow application of MSY-based control rules. For so-called “data-limited stocks,” it may only be possible to describe trends in terms of relative abundance, but not in absolute terms. In more extreme cases, only basic biological information (e.g., growth rate) is available, and catch data are unavailable or of questionable quality (e.g., most stocks in the Caribbean). A range of estimation methods and approaches exist to deal with these diverse situations (see Chapter 4 for more information related to estimating FMSY and BMSY in data-rich and data-poor situations).
IMPLEMENTATION OF REBUILDING REQUIREMENTS
Development and Review of Rebuilding Plans
As a result of the 2006 amendment to the MSFCMA, Fishery Management Plans including rebuilding plans must be designed to end overfishing immediately. RFMCs have 2 years to develop a rebuilding plan for stocks that are declared overfished by the NMFS based on the stock assessments conducted and reviewed through the respective RFMC processes.3 However, RFMCs and the NMFS can proactively propose and implement measures aimed at reducing fishing mortality even before a rebuilding plan is formally adopted. The nature of the technical analyses used to develop rebuilding plans, as well as the specific elements of a rebuilding plan, depend on the information available. The formal rebuilding plan is adopted by the RFMC and sent to the Secretary of Commerce for approval. During the development of a rebuilding plan, the public and the RFMC advisory bodies are given opportunities to provide input.
A rebuilding plan normally includes the following components:
- A target time period (TTARGET) for rebuilding the stock to BMSY (or its proxy). This target is bounded below by TMIN, the minimum time to rebuild to BMSY in the absence of all future fishing, and TMAX, the maximum rebuilding time (see Figure 2.5). TMAX is 10 years if the stock can rebuild in 10 years or less, with 50% probability, under zero fishing mortality.
- The values for parameters such as the MSST, BMSY, TMIN, and TTARGET when the rebuilding plan was first developed.
- The harvest strategy to be applied during the rebuilding period. Most harvest strategies are based on a constant target fishing mortality or on control rules that decrease the target fishing mortality when biomass drops below predefined thresholds. In other cases, the harvest strategy is based on a constant catch or a time-series of prespecified catch levels. The harvest strategy often also includes restrictions on where and when fishing can take place and the gear types that can be used.
- A general discussion of the types of management measures that will be used to implement the rebuilding plan.
Rebuilding plans require scientists and managers to make choices about targets, limits, and the probability of rebuilding. These implicit and explicit choices reflect judgements about expected benefits and costs and the level of risk that can be tolerated.
The values for MSST, BMSY, TMIN, and TTARGET can change if there is new information on stock status and/or productivity or if there are changes in the stock assessment methodology and the assumptions on which assessments are based.
For stocks with quantitative stock assessments, the development of a rebuilding plan involves two key technical aspects: (1) a rebuilding analysis that quantifies tradeoffs between exploitation rate, rate of recovery, and time to recovery and (b) an evaluation of the socioeconomic consequences of different harvest strategies and choices for TTARGET (see Chapter 6 for further discussion of the evaluation of socioeconomic factors). The process followed by the
_________________
3 Magnuson-Stevens Fishery Conservation and Management Reauthorization Act, Pub. L. No. 109-479 §103(c), 121 Stat. 3575, 3581 (2006).
Pacific Fishery Management Council (PFMC) to develop rebuilding plans for overfished groundfish stocks is provided in Box 3.1 as an example. Rebuilding analyses typically involve conducting stochastic simulations under various harvest strategies to calculate the probability of recovery. A number of choices regarding how population projections are undertaken need to be made. These choices are described and evaluated in Chapter 4.
BOX 3.1
Example: Groundfish Management by the Pacific Fishery Management Council (PFMC)
For groundfish stocks, the MSST is 25% of unfished reproductive output (often quantified as 25% of unfished spawning biomass) for rockfish and groundfish, while it is 12.5% of unfished reproductive output for flatfish. The MSST differs between these classes of stock given the relative productivity of flatfish compared to groundfish (PFMC, 2011b). Productivity is low for most groundfish stocks managed by the PFMC, so TMAX is generally TMIN plus one mean generation time (exceptions are Pacific hake, Merluccius productus, and petrale sole, Eopsetta jordani). For a stock that is newly declared to be overfished, TTARGET is the year in which rebuilding is predicted to occur with 50% probability under the selected harvest strategy. The harvest strategy is a constant spawning biomass-per-recruit strategy (equivalent to a constant fishing mortality strategy if the mix of fishing gears does not change over time), although the rebuilding plan for one overfished stock (yelloweye rockfish) involved a ramp down in catches (PFMC, 2006). Most PFMC rebuilding analyses allow for stochasticity in future recruitment, while some also allow for uncertainty in BMSY as well as the current population age-structure and reproductive output. The PFMC has Terms of Reference for rebuilding analyses for groundfish species (e.g., PFMC, 2012). The key aspects of these Terms of Reference include the following:
- BMSY should be defined using the proxies established by the PFMC Scientific and Statistical Committee (SSC), although direct estimates of BMSY can be used if they are judged to be robust (none is at present).
- TMIN is the year in which rebuilding to BMSY occurs with 50% probability if all fishing ceased the year after the stock was declared overfished
- Mean generation time is defined as the mean age of the net maternity function (i.e., the product of the survivorship and fecundity-at-age). When growth and/or natural mortality are changing over time, survivorship and fecundity-at-age are based on recent estimates to reflect current conditions
- Projections should be conducted for a full range of possible harvest strategies, including setting fishing mortality equal to zero (a strategy with a TTARGET equal to TMIN) and setting fishing mortality so recovery occurs with 50% probability by TMAX, as well as a range of harvest strategies with times to recovery with 50% probability between TMIN and TMAX
- The analyzed management strategies and choices for TTARGET for the overfished species are grouped into “alternatives” that involve different combinations of annual catch limits (ACLs) for each overfished species.
The RFMC’s SSC and other advisory bodies review the results of the rebuilding analyses and any socioeconomic analyses (discussed in Chapter 6, but see also, for example, the Groundfish Advisory Panel review of impacts in PFMC (2006)). The management strategy adopted is used in combination with the results of stock assessments to set ACLs. Rebuilding plans and annual setting of management regulations are based on a “best” assessment or a model-averaged set of assessment scenarios (see Chapter 4).
For stocks for which there is no new stock assessment (update or full), the biannual review of rebuilding plans consists of checking that catches are below ACLs. In contrast, when there is a new stock assessment, the SSC review process evaluates
(1) the catches of the overfished species relative to the annual ACLs summed over the rebuilding period;
(2) whether the rebuilding analyses met the appropriate technical requirements;
(3) the year in which rebuilding is predicted to start under the current harvest strategy relative to the TTARGET that was specified in the Management Plan Amendment 16-4 (PFMC, 2006) and the current TTARGET (which may differ from the value specified in Amendment 16-4 if the RFMC changed TTARGET since the rebuilding plan was established).
On this basis, the SSC determines which stocks are not rebuilding at the expected rate and which are very unlikely to rebuild by the specified TTARGET under the current harvest rate, and whether that rate will allow recovery by the updated value of TMAX. The latter situation can arise if a major change to the stock assessment has occurred. The SSC also recommends whether current harvest rates are a reasonable starting point for developing ACLs for the next biennial management cycle.
The choice of rebuilding time depends on the inherent productivity of the stock, as determined by its natural mortality, growth rate, and age-specific fecundity. Productivity can be quantified by the mean generation time (the average age of the mothers of offspring in an unfished population), as well as by the extent of compensation in the stock-recruitment relationship (the extent to which per capita recruitment increases on average as biomass declines, often quantified using the “steepness” parameter). Figure 3.2 shows the time to rebuild to BMSY predicted using a standard age-structured population dynamics model, as a function of biomass relative to BMSY and fishing mortality relative to FMSY for two choices of generation time and steepness (0.5 and 0.9). Figure 3.2 is highly idealized because it ignores, for example, stochastic dynamics and multispecies interactions. However, it nevertheless illustrates how populations are projected forward when conducting rebuilding analyses. TMIN is the time to rebuild when F/FMSY=0 (the y-origin). TMIN is less than 10 years for the stock with low steepness and a short generation time (Figure 3.2, top left panel) only if the stock is initially above 0.4 BMSY. In contrast, TMIN is
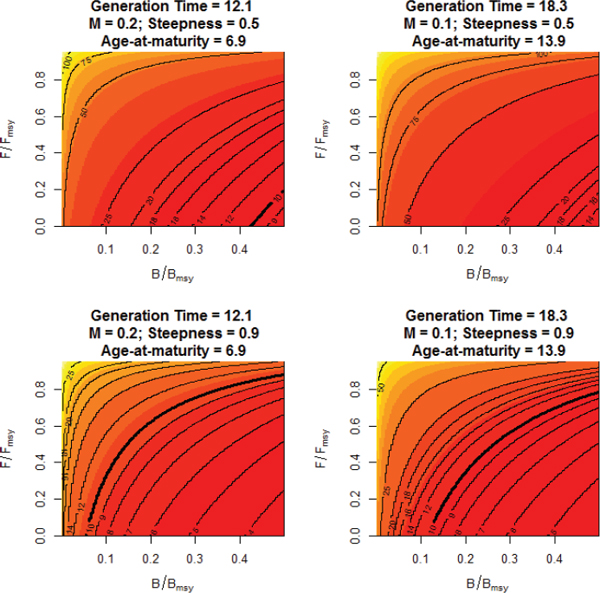
FIGURE 3.2 Time to rebuild to BMSY as a function of biomass relative to BMSY and fishing mortality relative to FMSY. Results are shown for two choices for each of the steepness of the stock-recruitment relationship and the extent of productivity (quantified by natural mortality and age at maturity, resulting in mean generation times of 12.1 and 18.3 years).
less than 10 years for most initial stock sizes if steepness is high (bottom panels).
Rebuilding to BMSY can occur relatively rapidly (less than twice the generation time) with fishing rates of 0.7 FMSY and less, when B/BMSY is close to 0.5. Larger reductions in F are required to achieve rebuilding in any given time period when the stock is more depleted; the dependence on the depletion level is nonlinear so that very low Fs are required when the stock is highly depleted (say less than 0.1 BMSY). Thus, the adoption of a harvest control rule that reduces F when stocks are depleted below BMSY will allow rebuilding even in the absence of a formal rebuilding plan, especially for stocks with high steepness (see Myers et al. [2002] for a meta-analysis of steepness values, which suggests that steepness tends to be high rather than low for most exploited stocks). On the other hand, keeping fishing mortalities closer to the long-term target (say a little below FMSY) would still achieve rebuilding, but the rebuilding period may be considerably longer, depending on the initial depletion and population parameters. Figure 3.2 also illustrates some of the effects of the 10-year discontinuity in the rule used to define TMAX discussed in Chapter 2 (Figure 2.3). If the stock in the lower right panel of Figure 3.2 (generation time=18.3 years and natural mortality M=0.1 yr-1) were depleted to ~0.12 BMSY, then the fishery should effectively be closed because it can (just) rebuild in 10 years in the absence of fishing. However, if it were even slightly more depleted (say 0.1 BMSY), then TMAX would increase to more than 28 years (i.e., 10 years plus one mean generation time), and hence the rebuilding fishing mortality could be as large as 0.8 FMSY.
Quantitative rebuilding analyses are not conducted for all overfished stocks for several reasons, including the lack of a quantitative stock assessment on which to base forecasts, complications arising when the “stock” is actually a complex of stocks, and lack of personnel to conduct the technical analyses. The 2006 reauthorization of the MSFCMA includes the requirement that all stocks have annual catch limits, which are difficult to estimate without accurate stock assessments. The reauthorization has increased the demand for stock assessment information, particularly in data-poor situations.
The amount, extent, and timing of inclusion of socioeconomic information in the analyses that support rebuilding plans differ among regions and for species within regions (see Chapter 6).
Management Controls
Several management controls can be implemented to ensure that fishing does not exceed target levels (Hilborn and Walters, 1992). Most RFMCs adopt management measures that combine input (gear restrictions, spatial and temporal restrictions in effort) and output (daily or seasonal trip or bag limits) controls. Prior to the 2006 reauthorization of the MSFCMA, some RFMCs (e.g., New England) tried to reach target catch levels using only input controls. However, to comply with the NS1G, RFMCs are now required to define ACLs as output controls.
Review of Stocks and Stock Status
As required by the Sustainable Fisheries Act (SFA), the status of U.S. stocks has been reported to Congress on an annual basis since 1997. In terms of fishing mortality, stocks are classified as being subject to overfishing or not being subject to overfishing. The classification of biomass status is more complicated. If stock size is below the MSST, then the stock is classified as overfished and therefore a rebuilding plan is required. Stocks subject to a rebuilding plan are classified as “rebuilding” if the stock size is between the MSST and BMSY. Stocks in this range that are not subject to a rebuilding plan and all stocks larger than BMSY are classified as “not overfished.” The status of many stocks is “unknown.” Reports to Congress during the early implementation of the SFA are less reliable and often used pre-SFA criteria, which did not distinguish between overfishing and overfished. Most of the stocks whose status is reported to Congress are assessed as single stocks, but some are assessed as stock complexes, which contain a group of species with similar geographic distribution and life history and that co-occur in a fishery. All are referred to here as “stocks.”
Of the total number of stocks identified in the reports to Congress, 230 of them (contributing greater than 90% of the total fishery landings) were selected for their importance to commercial and recreational fisheries and were used to construct a Fish Stock Sustainability Index (FSSI)4 as an indicator of management and stock performance. Stocks in the FSSI group are scored according to their status in terms of stock size (one point awarded if B>MSST and another point if B>0.80 BMSY), whether overfishing is taking place (one point if overfishing is not occurring), and whether “overfished” and “overfishing” status are known (half a point each). The FSSI hence summarizes the trends in whether major stocks (those which constitute the bulk of the total catch in U.S. waters) are overfished or subject to overfishing.
In addition to the species included in the FSSI, 248 stocks or stock complexes are included in the report to Congress. The status of many FSSI and non-FSSI stocks relative to overfishing and being in an overfished state is unknown because not all of these stocks are assessed using quantitative methods. Some stocks cannot be classified, for example, in situations where no assessment (qualitative or quantitative) has been conducted for the stock or it has not been possible to estimate BMSY and FMSY with acceptable reliability. In some cases, although no analytical assessment is available for a given stock, the stock status is evaluated based on trends in survey data or commercial catch per unit of effort. This is, for
_________________
4 These reports are available at http://www.nmfs.noaa.gov/sfa/statusoffisheries/SOSmain.htm.
TABLE 3.1 Summary of Stock Status for FSSI and non-FSSI Stocks Reported to Congress as of September 30, 2012 by Overfishing and Overfished Category
| FSSI Stocks | Non-FSSI Stocks | ||||||
| Overfishing? | Overfishing? | ||||||
| Yes | No | Unknown | Yes | No | Unknown or NA | ||
| Overfished? | Yes | 21 | 17 | 1 | 1 | 3 | |
| No | 3 | 111 | 8 | 30 | 7 | ||
| Rebuilding | 2 | 9 | |||||
| Approaching Overfished | 4 | 1 | 1 | ||||
| Unknown | 2 | 24 | 27 | 31 | 175 | ||
| TOTAL | 32 | 162 | 36 | 2 | 64 | 182 | |
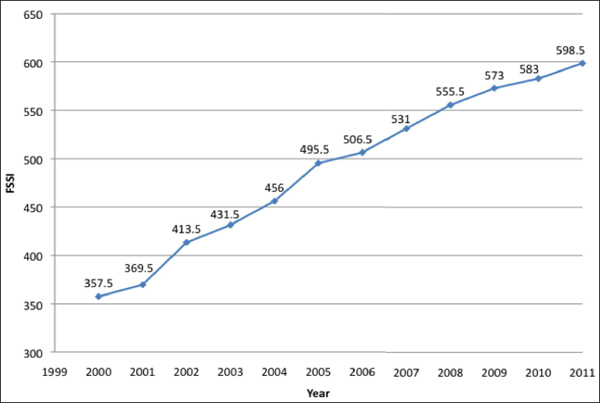
FIGURE 3.3 Fishery Status Sustainability Index for U.S. fisheries since 2000.
SOURCE: NMFS, 2012.
example, the case of the Pribilof Islands blue king crab, as well as the stocks of silver hake and the species of skates from the New England Fishery Management Council (NEFMC).
Of the 230 FSSI stocks, only 168 were classified in terms of both overfishing and overfished status in the third quarter of 2012: 23% of these were considered overfished (B<MSST), and fishing mortality was estimated to be above FMSY in more than half of the overfished stocks (Table 3.1). The majority (77%) of the FSSI stocks whose status was determined were not overfished and were not subject to overfishing; overfishing was still taking place in 18% of the stocks. The FSSI has shown a steady improvement since 2000 (Figure 3.3). Status could be determined for only a small fraction of the non-FSSI stocks, and the majority was neither overfished nor subject to overfishing. Fifty stocks
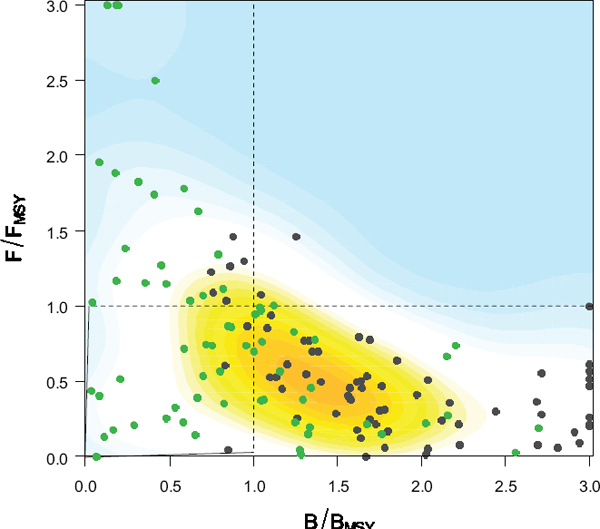
FIGURE 3.4 Realized F/FMSY versus B/BMSY for 137 U.S. fish stocks (117 FSSI stocks and 20 non-FSSI stocks) assessed in 2012. Stocks for which F/FMSY>3 are reported as F/FMSY=3 and stocks for which B/BMSY>3 are reported as B/BMSY=3. Stocks that have at some time been declared overfished and are included in this study are indicated as green dots, while other stocks are indicated as black dots.
are currently under rebuilding plans.5 In 1997, when the first report to Congress was prepared, 30% of assessed stocks (86 out of 279) were overfished, although for most species the existing overfishing definitions were based wholly or in part on a fishing mortality rate, not biomass levels.6
Current estimates of B/BMSY and F/FMSY for 137 stocks (117 FSSI and 20 non-FSSI) assessed using quantitative methods (made available to the committee by NMFS) are shown in Figure 3.4. Points that are above the horizontal line correspond to stocks that are subject to overfishing (F>FMSY); stocks on the left of the vertical line (B<BMSY) may be classified as overfished when B<MSST, or as rebuilding (MSST≤B<BMSY) when they were once declared overfished but are now estimated to be above MSST but not yet rebuilt (B>BMSY). A stock is defined to be rebuilt if it has recovered to the estimated BMSY. Of the stocks included in this figure, which correspond to stocks for which information is available for estimation of B/BMSY and F/FMSY, 21% (29 of 137 stocks) are currently below MSST, 6% (8 of 137 stocks) were overfished but are now above MSST and are under rebuilding plans, and 17% (23 of 133 stocks) are being fished at an intensity in excess of FMSY.
Over the period 1997-2011, after the SFA was signed into law, 85 federally managed stocks (79 FSSI and 6 non-FSSI) were at some point declared to be overfished or approaching an overfished state and were therefore subject to being placed under a rebuilding plan (Table 3.2). This list of stocks was compiled by NMFS staff at the request of the committee; it does not include stocks that were declared
_________________
5http://www.nmfs.noaa.gov/sfa/statusoffisheries/2012/third/Q3_2012_FSSI_nonFSSIstockstatus.pdf.
6http://www.nmfs.noaa.gov/sfa/statusoffisheries/Archives/StatusofFisheriesReportCongress1997.htm#Summary.
TABLE 3.2 The 85 Stocks That Have Been Declared Overfished and Their Current Status Relative to FMSY, BMSY, and MSST (as of 2012 status report to Congress, quarter 3)
| Stock | Jurisdiction | Included in Evaluation Set | Analytical Assessment | Current Overfished Status | Overfishing Now | Year Declared Overfished | First Year of the Plan | Year Declared Rebuilt | Time Frame for Rebuilding | Last Year with Assessment Results |
| Queen conch—Caribbean | CFMC | No | No | Overfished | Yes | 2000 | 2005 | 15 | ||
| Caribbean grouper Unit 1 | CFMC | No | No | Overfished | Yes | 2000 | 2005 | 25 | ||
| Caribbean grouper Unit 2 | CFMC | No | No | Overfished | No | 2000 | 2005 | 30 | ||
| Caribbean grouper Unit 4 | CFMC | No | No | Overfished | Yes | 2005 | 2005 | 10 | ||
| Gray triggerfish—Gulf of Mexico | GMFMC | No | Yes | Overfished | Yes | 2008 | 2008 | 6 | 2010 | |
| Greater amberjack—Gulf of Mexico | GMFMC | Yes | Yes | Overfished | Yes | 2001 | 2003 | 10 | 2009 | |
| Red snapper—Gulf of Mexico | GMFMC | Yes | Yes | Overfished | No | 2000 | 2001 | 32 | 2008 | |
| Albacore—North Atlantic | HMS | Yes | Yes | Overfished | Yes | 1999 | 2007 | Not specified | 2007 | |
| Bigeye tuna—Atlantic | HMS | Yes | Yes | Rebuilding | No | 2000 | 2008 | Not specified | 2009 | |
| Blacknose shark—Atlantic | HMS | No | Yes | Overfished | Yes | 2008 | 2010 | 18 | 2009 | |
| Blue marlin—Atlantic | HMS | Yes | Yes | Overfished | Yes | 1997 | 2001 | Not specified | 2009 | |
| Bluefin tuna—Western Atlantic | HMS | Yes | Yes | Overfished | Yes | 1997 | 1999 | 19 | 2009 | |
| Dusky shark—Atlantic | HMS | Yes | Yes | Overfished | Yes | 1999 | 2003 | 100 | 2009 | |
| Porbeagle—Atlantic | HMS | No | Yes | Overfished | No | 2006 | 2008 | 100 | 2005 | |
| Sailfish—Western Atlantic | HMS | No | Yes | Rebuilding | Yes | 1998 | 2008 | Not specified | 2007 | |
| Sandbar shark—Atlantic | HMS | Yes | Yes | Overfished | No | 1999 | 2003 | 66 | 2009 | |
| White marlin—Atlantic | HMS | No | No | Overfished | Yes | 1997 | 2001 | Not specified | 2004 | |
| Butterfish—Gulf of Maine/Cape Hatteras | MAFMC | No | Yes | Undefined | No | 2004 | 2010 | 4 | 2008 | |
| Tilefish—Mid-Atlantic Coast | MAFMC | Yes | Yes | Rebuilding | No | 1997 | 2001 | 10 | 2008 | |
| Acadian redfish—Gulf of Maine/ Georges Bank | NEFMC | Yes | Yes | Rebuilt | No | 2001 | 2004 | 2012 | 47 | 2010 |
| American plaice—Gulf of Maine/ Georges Bank | NEFMC | Yes | Yes | Rebuilding | No | 2003 | 2004 | 10 | 2010 | |
| Atlantic cod—Georges Bank | NEFMC | Yes | Yes | Overfished | Yes | 2002 | 2004 | 22 | 2010 | |
| Atlantic cod—Gulf of Maine | NEFMC | Yes | Yes | Overfished | Yes | 2002 | 2004 | 10 | 2010 | |
| Atlantic halibut—Northwestern Atlantic Coast | NEFMC | Yes | Yes | Overfished | Yes | 1997 | 2004 | 52 | 2010 | |
| Atlantic wolffish—Gulf of Maine/ Georges Bank | NEFMC | No | Yes | Overfished | Yes | 2010 | 2010 | Not specified | 2010 | |
| Ocean pout—Northwestern Atlantic Coast | NEFMC | Yes | No | Overfished | Yes | 1999 | 2004 | 10 | 2010 | |
| Stock | Jurisdiction | Included in Evaluation Set | Analytical Assessment | Current Overfished Status | Overfishing Now | Year Declared Overfished | First Year of the Plan | Year Declared Rebuilt | Time Frame for Rebuilding | Last Year with Assessment Results |
| White hake—Gulf of Maine/ Georges Bank | NEFMC | Yes | Yes | Overfished | Yes | 1999 | 2004 | 10 | 2007 | |
| Windowpane—Gulf of Maine/ Georges Bank | NEFMC | No | Yes | Overfished | Yes | 2010 | 2010 | 7 | 2010 | |
| Windowpane—Southern New England/Mid-Atlantic | NEFMC | Yes | Yes | Rebuilt | No | 2002 | 2004 | 2012 | 10 | 2010 |
| Winter flounder—Georges Bank | NEFMC | Yes | Yes | Rebuilding | No | 1999 & 2010 | 2010 | 2003 | 7 | 2010 |
| Winter flounder—Southern New England/ Mid-Atlantic | NEFMC | Yes | Yes | Overfished | No | 2003 | 2004 | 10 | 2010 | |
| Witch flounder - Northwestern Atlantic Coast | NEFMC | N0 | Yes | Overfished | Yes | 2010 | 2010 | 7 | 2010 | |
| Yellowtail flounder—Cape Cod/ Gulf of Maine | NEFMC | Yes | Yes | Overfished | Yes | 2002 | 2004 | 19 | 2010 | |
| Yellowtail flounder—Georges Bank | NEFMC | Yes | Yes | Overfished | No | 2005 | 2006 | 10 | 2010 | |
| Yellowtail flounder—Southern New England/Mid-Atlantic | NEFMC | Yes | Yes | Rebuilt | No | 2000 | 2004 | 2012 | 10 | 2011 |
| Barndoor skate—Georges Bank/ Southern New England | NEFMC | No | No | Rebuilding | No | 2000 | 2003 | Not specified | 2010 | |
| Smooth skate—Gulf of Maine | NEFMC | No | No | Rebuilding | No | 2000 & 2008 | 2010 | 2001 | 7 | 2010 |
| Thorny skate—Gulf of Maine | NEFMC | No | No | Overfished | No | 2000 | 2003 | 25 | 2010 | |
| Blue king crab—Pribilof Islands | NPFMC | Yes | No | Overfished | No | 2003 | 2004 | 10 | 2010 | |
| Bocaccio—Southern Pacific Coast | PFMC | Yes | Yes | Rebuilding | No | 1999 | 2000 | 22 | 2010 | |
| Canary rockfish—Pacific Coast | PFMC | Yes | Yes | Overfished | No | 2000 | 2001 | 26 | 2010 | |
| Cowcod—Southern California | PFMC | Yes | Yes | Overfished | No | 2000 | 2001 | 67 | 2008 | |
| Darkblotched rockfish—Pacific Coast | PFMC | Yes | Yes | Rebuilding | No | 2001 | 2002 | 23 | 2010 | |
| Pacific ocean perch—Pacific Coast | PFMC | Yes | Yes | Overfished | No | 1999 | 2000 | 18 | 2010 | |
| Petrale sole—Pacific Coast | PFMC | No | Yes | Rebuilding | No | 2009 | 2012 | 4 | 2010 | |
| Yelloweye rockfish—Pacific Coast | PFMC | Yes | Yes | Overfished | No | 2002 | 2003 | 71 | 2010 | |
| Black sea bass—Southern Atlantic Coast | SAFMC | Yes | Yes | Rebuilding | Yes | 1999 | 2000 | 10 | 2010 | |
| Red porgy—Southern Atlantic Coast | SAFMC | Yes | Yes | Overfished | No | 2000 | 2000 | 16 | 2004 | |
| Red snapper—Southern Atlantic Coast | SAFMC | Yes | Yes | Overfished | Yes | 2000 | 2001 | 35 | 2009 | |
| Snowy grouper—Southern Atlantic Coast | SAFMC | No | Yes | Overfished | Yes | 2000 | 2006 | 34 | 2002 | |
| Hancock Seamount Groundfish Complex | WPFMC | No | No | Overfished | Undefined | 2000 | 1986 | Not specified | ||
| Red grouper—Gulf of Mexico | GMFMC | Yes | Yes | Rebuilt | No | 2000 | 2003 | 2007 | 10 | 2008 |
| Blacktip shark—Gulf of Mexico | HMS | No | Yes | Rebuilt | No | 1999 | 2006 | 30 | 2004 | |
| Blacktip shark—South Atlantic | HMS | No | No | Undefined | Undefined | 1999 | 2003 | 30 | 2004 | |
| Swordfish—North Atlantic | HMS | Yes | Yes | Rebuilt | No | 1997 | 1999 | 2009 | 10 | 2008 |
| Bluefish—Atlantic Coast | MAFMC | Yes | Yes | Rebuilt | No | 1999 | 2001 | 2008 | 9 | 2010 |
| Black sea bass—Mid-Atlantic Coast | MAFMC | Yes | Yes | Rebuilt | No | 2000 | 2000 | 2009 | 10 | 2010 |
| Scup—Atlantic Coast | MAFMC | Yes | Yes | Rebuilt | No | 2000 | 2008 | 2009 | 7 | 2010 |
| Summer flounder—Mid-Atlantic Coast | MAFMC | Yes | Yes | Rebuilt | No | 1999 | 2000 | 2011 | 13 | 2010 |
| Sea scallop—Northwestern Atlantic Coast | NEFMC | Yes | Yes | Rebuilt | No | 1997 | 1999 | 2001 | 10 | 2009 |
| Haddock—Georges Bank | NEFMC | Yes | Yes | Rebuilt | No | 2000 | 2004 | 2010 | 10 | 2010 |
| Haddock—Gulf of Maine | NEFMC | Yes | Yes | Approaching overfished | Yes | 1999 | 2004 | 2011 | 10 | 2010 |
| Pollock—Gulf of Maine/Georges Bank | NEFMC | Yes | Yes | Rebuilt | No | 2002 | 2004 | 2010 | 10 | 2009 |
| Silver hake—Gulf of Maine/ Northern Georges Bank | NEFMC | No | No | Rebuilt | No | 1997 | 1999 | 2002 | 10 | 2009 |
| Silver hake—Southern Georges Bank/Mid-Atlantic | NEFMC | No | No | Rebuilt | No | 1997 | 1999 | 2007 | 10 | 2009 |
| Goosefish—Gulf of Maine/ Northern Georges Bank | NEFMC/ MAFMC | Yes | Yes | Rebuilt | No | 1997 | 1999 | 2008 | 10 | 2009 |
| Goosefish—Southern Georges Bank/Mid-Atlantic | NEFMC/ MAFMC | Yes | Yes | Rebuilt | No | 1997 | 1999 | 2008 | 10 | 2009 |
| Spiny dogfish—Atlantic Coast | NEFMC/ MAFMC | Yes | Yes | Rebuilt | No | 1998 | 2000 | 2010 | 5 | 2010 |
| Blue king crab—Saint Matthews Island | NPFMC | Yes | Yes | Rebuilt | No | 1999 | 2000 | 2009 | 10 | 2010 |
| Snow crab—Bering Sea | NPFMC | Yes | Yes | Rebuilt | No | 1999 | 2000 | 2011 | 10 | 2010 |
| Lingcod—Pacific Coast | PFMC | Yes | Yes | Rebuilt | No | 1999 | 2000 | 2005 | 10 | 2008 |
| Pacific hake—Pacific Coast | PFMC | Yes | Yes | Rebuilt | No | 2002 | 2004 | Not specified | 2011 |
| Stock | Jurisdiction | Included in Evaluation Set | Analytical Assessment | Current Overfished Status | Overfishing Now | Year Declared Overfished | First Year of the Plan | Year Declared Rebuilt | Time Frame for Rebuilding | Last Year with Assessment Results |
| Widow rockfish—Pacific Coast | PFMC | Yes | Yes | Rebuilt | No | 2001 | 2002 | 2011 | 14 | 2010 |
| Chinook salmon—Northern | PFMC | No | Yes | Rebuilt | No | 2011 | Not specified | 2003 | ||
| California Coast: Klamath (fall) | ||||||||||
| Coho salmon—Washington Coast: Queets | PFMC | No | Yes | Rebuilt | No | 2009 | 2011 | Not specified | 2008 | |
| King mackerel—Gulf of Mexico | SAFMC/ GMFMC | Yes | Yes | Rebuilt | No | 1999 | 1987 | 2008 | Not specified | 2006 |
| Yellowtail snapper—Southern Atlantic Coast/Gulf of Mexico | SAFMC/ GMFMC | Yes | Yes | Rebuilt | No | 2000 | 1992 | 2003 | 10 | 2010 |
| Vermilion snapper—Gulf of Mexico | GMFMC | Yes | Yes | Rebuilt | No | 2003 | 2004 | 2006 | 10 | 2010 |
| Winter skate—Georges Bank | NEFMC | No | No | Rebuilt | No | 2000 & 2007 | 2010 | Not specified | ||
| Southern New England | ||||||||||
| Gag—Gulf of Mexico | GMFMC | No | Yes | Overfished | Yes | 2009 | 2012 | 10 | 2008 | |
| Scalloped hammerhead—Atlantic | HMS | No | Yes | Overfished | Yes | 2011 | Not specified | 2005 | ||
| Southern Tanner crab—Bering Sea | NPFMC | Yes | Yes | Overfished* | No | 1999 & 2010 | 2000 | 2007 | 10 | 2011 |
| Chinook salmon—California | PFMC | No | Yes | Overfished | No | 2010 | 2012 | 1 | 2003 | |
| Central Valley: Sacramento (fall) | ||||||||||
| Coho salmon—Washington Coast: | PFMC | No | Yes | Rebuilt | No | 2009 | 2012 | Not specified | 2007 | |
| Western Strait of Juan de Fuca | ||||||||||
| Red grouper—Southern Atlantic Coast | SAFMC | Yes | Yes | Overfished | Yes | 2000 | 1992 | 15 | 2008 | |
The column “Included in Evaluation Set” indicates whether the stock is one of the 55 considered for detailed analysis. “Analytical Assessment” indicates whether there is an accepted analytical assessment for the stock: the current overfished and overfishing status are status relative to BMSY and FMSY from the most recent assessment (see the last column for the most recent year for which estimates of biomass and fishing mortality are available). “First Year of Plan” indicates the year when a rebuilding plan was adopted, while “Time Frame for Rebuilding” is the current length of the rebuilding plan (which may differ from the length of the rebuilding period when the plan was first developed). It should be noted that some stocks (e.g., Bering Sea Tanner crab) have been declared overfished for a second time, having rebuilt under an earlier rebuilding plan.
*Stock reclassified as rebuilt in the last (quarter 4) 2012 status report to Congress based on stock assessment estimates included in this report.
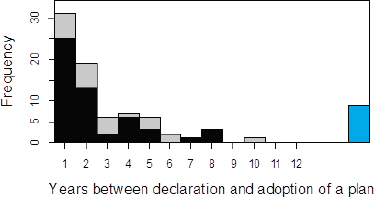
FIGURE 3.5 Number of years between a stock being declared overfished and the adoption of a rebuilding plan for the 85 stocks declared overfished since 1997. The solid bars denote the 55 stocks considered in detail in the analyses. The blue bar corresponds to stocks that rebuilt before a rebuilding plan was developed (5 stocks) or adopted (implementation delayed due to court decisions in 2 cases) or for which a rebuilding plan has not yet been developed (2 stocks).
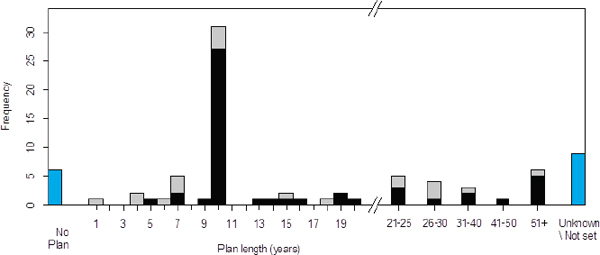
FIGURE 3.6 Length of the rebuilding plan for the 85 stocks considered in this study. Bars are for individual years until 20 years and then for the following groups of years: 21-25 years, 26-30 years, 31-40 years, 41-50 years, and 51+ years. The solid bars denote the 55 stocks considered in detail in the analyses. Bars are shown in blue for the stocks for which a rebuilding plan was never developed and for the stocks for which a desired time to rebuild has never been set.
overfished using pre-SFA criteria not based on biomass reference points (e.g., some South Atlantic grouper species) or stocks that are no longer listed as individual stocks (e.g., many shark species that were added to the Large Coastal Shark Complex and cannot be retained in commercial or recreational fisheries).
Rebuilding plans were adopted for most stocks that were declared to be overfished within 2 years (Figure 3.5). However, the time between overfished designation and implementation of a rebuilding plan has extended up to 10 years. Reasons for longer time periods between the declaration of overfished status and the establishment of a rebuilding plan include delays associated with court decisions (e.g., Dusky shark and sandbar shark7), insufficient information to develop a rebuilding plan (e.g., Atlantic halibut), and differences in policy and law associated with stocks that are internationally managed (e.g., albacore and bigeye tuna in the Atlantic). Rebuilding plans were not established for some stocks (e.g., Pacific hake, Merluccius productus, and Coho salmon, Oncorhynchus kisutch) because they were reclassified as rebuilt before a rebuilding plan could be developed and adopted (Table 3.2).
The length of the target rebuilding period (TTARGET) differs among stocks (Figure 3.6). As expected, a large num-
_________________
7http://http://www.nmfs.noaa.gov/sfa/statusoffisheries/Archives/StatusofFisheriesReportCongress2002.pdf.
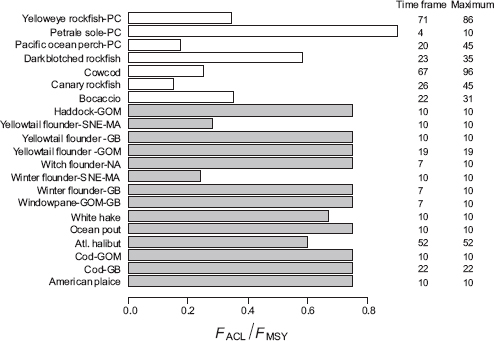
FIGURE 3.7 Target fishing mortality (FACL) used to calculate 2012 Acceptable Biological Catches for groundfish stocks subject to rebuilding plans under the New England Fishery Management Council (NEFMC, grey bars) and the Pacific Fishery Management Council (PFMC,white bars), and the corresponding length of the rebuilding plan. The values under the heading Maximum correspond to the maximum permissible rebuilding period. Fishing mortalities are scaled to estimated FMSY. Rebuilding plans are based on a constant fishing mortality strategy except for Petrale sole.
ber of rebuilding plans are designed to rebuild stocks within 10 years. However, some plans focus on shorter rebuilding times, while others allow longer rebuilding times because recovery projections under zero fishing mortality indicate that rebuilding cannot occur with at least 50% probability within 10 years. Time horizons for rebuilding were not specified for nine stocks, which correspond to highly migratory stocks in the Atlantic (subject to international rebuilding plans), groundfish on Hancock Seamount (a species complex), barndoor skate (managed as part of a skate complex and only caught as bycatch), and Atlantic wolfish (too much uncertainty to select a rebuilding time). No rebuilding time was specified for king mackerel in the Gulf of Mexico because the rebuilding plan for this species was developed before the SFA.
The majority of the adopted rebuilding plans are based on a constant fishing mortality strategy. The target fishing mortality (FACL) used to calculate the Accepted Biological Catches (ABC) depends on the TTARGET selected by the RFMC, which must be between TMIN and TMAX. The FACL has to be lower than FMSY, but how much lower depends on how each RFMC resolves the various tradeoffs involved in the decision. For example, Figure 3.7 compares the values of FACL scaled by FMSY, used to calculate the 2012 ABCs for groundfish stocks subject to rebuilding plans in New England and in the Pacific coast. In general, the PFMC has selected rebuilding periods (TTARGET) substantially shorter than the maximum established by the NS1G, and has therefore chosen lower values of FACL as a fraction of FMSY. Petrale sole has a higher FACL/FMSY. However, the rebuilding plan for this stock is based not on a constant fishing mortality strategy but on the standard control rule used for stocks that are not overfished (the 25-5 rule8) (PFMC, 2011b), because rebuilding analyses showed that this rule was adequate to allow rebuilding to BMSY within 10 years (Haltuch, 2011).
The NEFMC set FACL by selecting the lower of 0.75 FMSY or FREBUILD, where the latter is the fishing mortality rate that achieves a 50% probability of rebuilding by the target year.9 In most cases for NEFMC stocks, the maximum allowable rebuilding period has been selected (typically 10 years) and FACL has been set at 75% FMSY, but much larger reductions have been adopted when a stock was not rebuilding at the expected rate and the end of the rebuilding time frame was approaching. This was the case for the Southern New England/Mid-Atlantic stocks of yellowtail flounder and winter flounder, for which the original TTARGET was set at 2014. The FACL used to calculate the 2012 ABC was 28% FMSY for yellowtail flounder, corresponding to
_________________
8 The 25-5 harvest control rule is designed to prevent flatfish stocks from becoming overfished and serves as an interim rebuilding policy for stocks that are below the overfished threshold. This rule sets the ACL to the catch corresponding to FMSY when the stock is at 25% of the unfished level (less a buffer to account for scientific uncertainty) and to zero at 5% of this level.
9http://www.nero.noaa.gov/nero/regs/frdoc/12/12MulFW47EA.pdf.
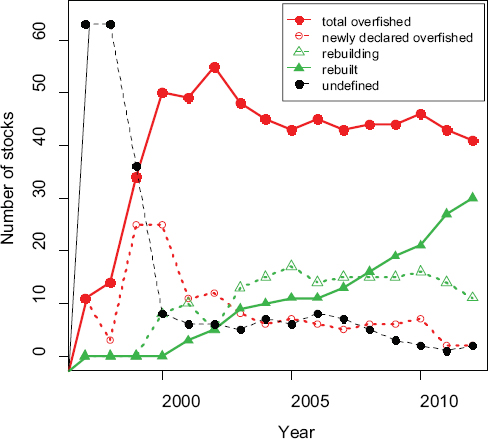
FIGURE 3.8 Number of stocks classified as overfished, newly declared overfished, rebuilding, rebuilt, and undefined each year for the set of 85 stocks declared overfished during the period 1997-2012. The number of undefined stocks (represented by the black dotted line) was significantly reduced as many stocks were classified for the first time.
FREBUILD, and 24% of FMSY for winter flounder. The latter stock would not rebuild by 2014, so the NEFMC opted in 2009 to reduce fishing mortality as much as possible without closing the other fisheries in the area.
OVERVIEW OF OUTCOMES OF REBUILDING EFFORTS
Changes in Reported Stock Status over Time
Figure 3.8 shows trends in the stock status summaries for the 85 stocks in Table 3.2 relative to being in an overfished state. The status of most of these stocks was not determined until 1999-2000 when the majority of the overfished designations occurred; thus the number of stocks whose status was undefined declined markedly between 1998 and 2000. The total number of stocks classified as overfished peaked in 2002 at 55 and has declined to an average of 45 since 2004. Although the rate of new overfished designations decreased markedly after 2000, an average of 6 new stocks per year has been designated as overfished during 2004-2010. The number of stocks rebuilt has increased consistently over time, while the number of stocks in rebuilding status (MSST<B<BMSY) has been relatively constant since 2004. Of the 85 stocks declared overfished since 1997, 42 are no longer classified as overfished: 11 are rebuilding and 31 were subsequently designated as rebuilt, one of which is currently considered undefined (Table 3.3). Four additional stocks that were declared rebuilt became overfished again, and one is approaching overfishing (Table 3.2).
For stocks that were classified as rebuilt, the number of years from being designated as overfished to being declared rebuilt was often less than anticipated (Figure 3.9). In five of those cases (Pacific hake, Georges Bank winter skate, and three salmon stocks), the stocks were assessed to be rebuilt before a rebuilding plan was implemented. As discussed in the next section, some of these rebuilt designations correspond to situations when stock status was reevaluated following an updated stock assessment rather than as the direct result of evidence of recovery following reduced fishing mortality.
The current status of the stocks that were declared overfished varies by region (see Table 3.3 for a summary). New England had the largest number of stocks declared overfished under the SFA (26 of 85 stocks), followed by the Pacific West Coast and the highly migratory stocks (14 stocks each). The contrast among regions is still present, with New England showing the largest number of overfished stocks despite several stocks rebuilding. Success in eliminating overfishing
TABLE 3.3 Summary of the Current Status of Stocks That Have Been Declared to Be Overfished Under the SFA (by region)
| Council | Number of Stocks Classified as Overfished Since 1997 | FSSI Stocks | Current Status Relative to MSST and BMSY | |||||||
| Number overfished (<MSST) | Number rebuilt (>BMSY) | Number approaching an overfished state | Number rebuilding (>MSST & <BMSY) | Number undefined | Number Subject to Overfishing (F>FMSY) | With Analytical Assessments | Number Included in the Evaluation Set | |||
| New England | 26 | 25 | 12 | 9 | 1 | 4 | 0 | 7 | 20 | 17 |
| New England/Mid-Atlantic | 3 | 3 | 0 | 3 | 0 | 0 | 0 | 0 | 3 | 3 |
| Mid-Atlantic | 6 | 6 | 0 | 4 | 0 | 1 | 1 | 0 | 6 | 5 |
| South Atlantic | 5 | 5 | 4 | 0 | 0 | 1 | 0 | 3 | 5 | 4 |
| South Atlantic/Gulf | 2 | 2 | 0 | 2 | 0 | 0 | 0 | 0 | 2 | 2 |
| Gulf of Mexico | 6 | 6 | 4 | 2 | 0 | 0 | 0 | 3 | 6 | 4 |
| Caribbean | 4 | 4 | 4 | 0 | 0 | 0 | 0 | 3 | 0 | 0 |
| Pacific | 14 | 10 | 5 | 6 | 0 | 3 | 0 | 0 | 14 | 9 |
| North Pacific | 4 | 4 | 2 | 2 | 0 | 0 | 0 | 0 | 4 | 3 |
| Western Pacific | 1 | 1 | 1 | 0 | 0 | 0 | 0 | 0 | 0 | 0 |
| High Migratory | 14 | 13 | 9 | 2 | 0 | 2 | 1 | 8 | 12 | 7 |
| Total | 85 | 79 | 41 | 30 | 1 | 11 | 2 | 24 | 72 | 55 |
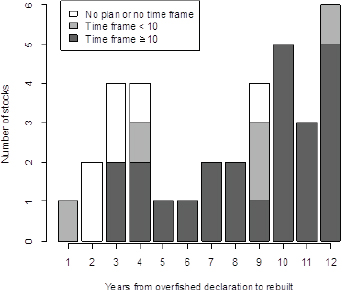
FIGURE 3.9 Frequency distribution of number of years between being declared to be overfished and rebuilt for the 85 stocks declared overfished since 1997. The figure is truncated at 12 years because insufficient time has passed to fill in the rest of the distribution.
has also varied across regions. For example, none of stocks designated as overfished and managed by the PFMC and the North Pacific Fishery Management Council (NPFMC) is currently subject to overfishing, while overfishing is still taking place in seven stocks managed by the NEFMC and in eight stocks of the highly migratory category.
Analysis of Time Series Data
To evaluate the changes in fishing mortality and biomass following declaration of overfished status, the committee used a subset of stocks that are assessed by quantitative methods. Of the 85 stocks declared overfished since 1996, 72 (85%) had a quantitative stock assessment that estimated biomass, fishing mortality, and their respective reference points BMSY and FMSY or their proxies (Table 3.2). Such stock assessments could have formed the basis for forecasting under different management arrangements. The analyses of trends and outcomes of management actions presented below are based on a subset of 55 of the 85 stocks in Table 3.2 for which (a) quantitative stock assessments are available and (b) there are at least 3 years between when the stock was declared overfished (year YD) and the most recent year for which estimates of F/FMSY and B/BMSY are available. Appendix C of this report provides time series of catches, fishing mortality, biomass and recruitment, and phase plane plots for all of these stocks. The data and assessment estimates were assembled from the Species Information System database available at the National Oceanic and Atmospheric Administration (NOAA, as of September of 2012), complemented by information provided by individual assessment scientists at NOAA’s Fishery Science Centers. Fishing intensity is expressed in several ways depending on the stock. In some cases, the actual fishing mortality rate for fully recruited age classes is provided; in other cases, fishing intensity is expressed as a proportional reduction in spawning biomass-per-recruit relative to that when the stock was unfished. Similarly, biomass may correspond to female spawning stock biomass, number of eggs, or even male biomass (in the case of crab species). Trends in estimated F/FMSY and B/BMSY before and after the year each stock was declared to be overfished are shown in Figure 3.10, by region. These trends are used to evaluate (1) changes in initial stock status as a result of assessment updates, (2) estimated changes in F, and (3) changes in B, in that order.
Status at the Time the Stock Was Declared Overfished
Changes in the number of stocks classified in the different status categories reflect not only actual changes in stock status, but also the fact that when stock assessments are updated with new data, and perhaps under somewhat different assumptions, their original status category in a given year may change. Thus, to understand the responses to management actions in terms of fishing mortality and biomass, it is important to consider the status of each of the stocks at the time of overfished designation according to its most recent assessment. This perspective presumes that the most recent assessment is the most correct, but this cannot be guaranteed, and the variation in results suggests that the results likely would be somewhat different were the comparisons below to be conducted in the future based on further updated assessments.
The changes in status of the 55 stocks evaluated relative to FMSY, BMSY, and MSST based on the most recent stock assessments are summarized in Table 3.4 and Figures 3.11 and 3.12. Although at the time these stocks were declared overfished their biomass was estimated to be below the MSST, the most recent assessments indicate that 20 (36%) of these stocks were not overfished in the year before designation (YD-1), and 10 were actually above BMSY (Table 3.4; Figure 3.11). Only 26 of the 55 stocks were both overfished and experiencing overfishing when declared overfished according to the latest assessments. Of the 21 stocks that would now be classified as rebuilt based on these assessments, 6 were already above BMSY at the time of overfished designation and 5 were below BMSY but not overfished, according to the same assessment. The reason for these results is that every time a stock assessment is updated with new data the entire time series of F and B estimates change, including the F and B at time YD-1 and likely the value of the reference point BMSY. In some cases, these changes are substantial, leading to a reclassification of the original stock status. For example, the Pacific hake stock was classified as overfished in 2002, but updated assessments indicated that the stock was above BMSY when declared to
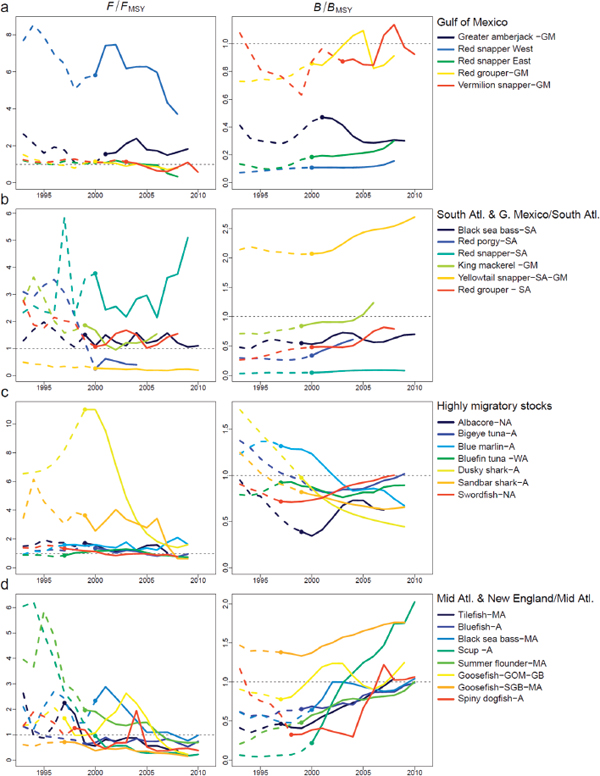
FIGURE 3.10 Trends in F/FMSY (left column) and B/BMSY (right column) since 1993 estimated by the most recent assessment for stocks in different jurisdictions. Dashed lines and solid lines correspond, respectively, to the periods before and after the year each stock was declared to be overfished (identified by a solid dot).
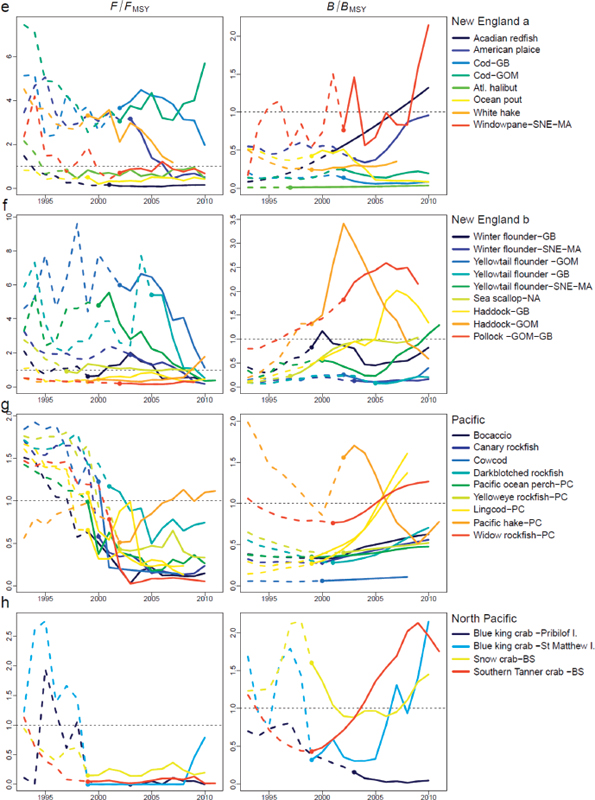
TABLE 3.4 Status of the 55 Stocks Relative to FMSY, BMSY, and MSST based on the most recent stock assessments.
| B<MSST | MSST≤B<BMSY | B≥BMSY | Total | |
| (a) Status 1 year before being designated as overfished | ||||
| F>FMSY | 26 | 7 | 3 | 36 |
| F≤FMSY | 9 | 3 | 7 | 19 |
| Total | 35 | 10 | 10 | 55 |
| (b) Status 3 years after being designated as overfished | ||||
| F>FMSY | 17 | 6 | 2 | 25 |
| F≤FMSY | 12 | 13 | 5 | 30 |
| Total | 29 | 19 | 7 | 55 |
| (c) Status at last year covered by the assessment | ||||
| F>FMSY | 11 | 3 | 1 | 15 |
| F≤FMSY | 11 | 9 | 20 | 40 |
| Total | 22 | 12 | 21 | 55 |
Results are shown for the year before the stock was declared overfished, 3 years after the overfished designation, and the most recent year with information on stock status.
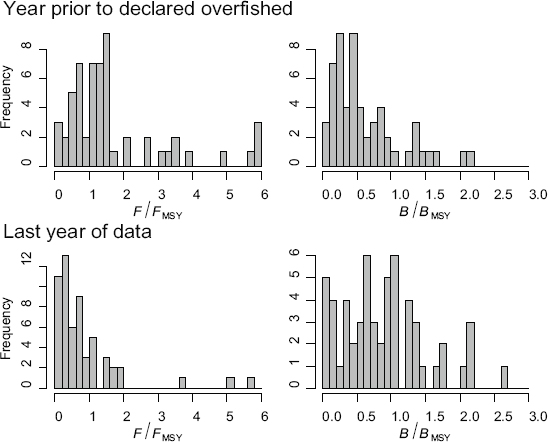
FIGURE 3.11 Distribution of stock status in terms of F/FMSY and B/BMSY in the year before the stock was declared to be overfished and in the last year included in the assessment, all based on the most current assessments. Values of F/FMSY>6 are included in the largest class.
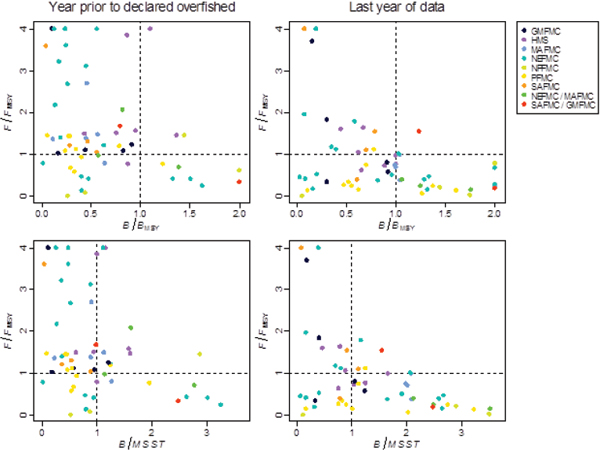
FIGURE 3.12 Stock status in terms of F/FMSY, B/BMSY, and B/MSST the year before the stock was declared to be overfished and during the last year for which assessment information is available, based on estimates from the most recent assessment. Each dot represents a stock, and different colors correspond to RFMC jurisdictions. The scale of the F/FMSY axis is truncated so that the dots at the upper limit correspond to F/FMSY>4.
be overfished (see Figure C.33, Appendix C). In addition, the uncertainty in stock assessment results is such that some stocks currently considered not to be overfished may in fact be overfished.
The initial status at the time of overfished designation varied across the regions, with overfished stocks in the Atlantic generally being subject to much higher levels of overfishing than those in the Pacific (Figure 3.12).
Changes in Fishing Mortality
Of the 35 stocks that are now estimated to have been below MSST the year before they were declared overfished, 9 had fishing mortalities below FMSY (Table 3.4). Therefore, according to the most recent assessments, these stocks were overfished, but overfishing was not taking place. Reasons differ among stocks. Some stocks were depleted many years before they were declared overfished. This is the case for Atlantic halibut, which essentially was not targeted by any fishery when it was declared overfished (Figure C.4, Appendix C). Also, fishing mortality on ocean pout dropped below FMSY in 1992, well before the stock was declared overfished under the SFA (Figure C.32, Appendix C). For other stocks, preemptive management actions occurred before the overfished declaration. For example, the directed fishery for Pribilof Islands blue king crab was closed in 1999 by the State of Alaska when stock size and catch rates dropped, although the stock was only declared overfished in 2003 (see Figure C.10, Appendix C). Yet in other cases, reductions in F were a byproduct of measures implemented to rebuild other stocks. This is the case for yelloweye rockfish (Figure 3.10g), declared overfished in 2002, whose fishing mortality had been reduced because of the restrictions placed on the West Coast groundfish fishery to rebuild other “shelf” rockfish, in
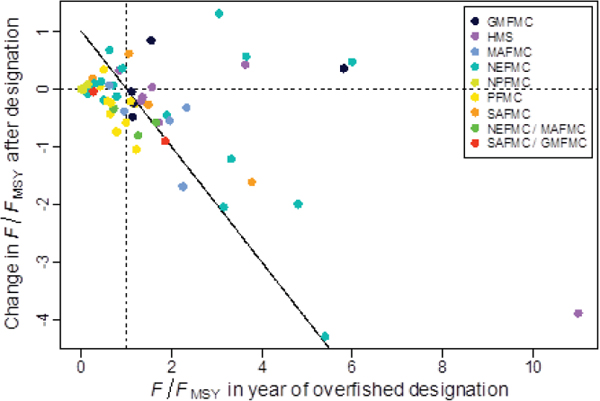
FIGURE 3.13 Change in fishing mortality relative to FMSY following overfished designation as a function of F/FMSY in the year when the stock was declared overfished (YD). Each point corresponds to a stock, colored coded by Regional Fishery Management Council (RFMC). The change in F/FMSY was calculated as FYD/FMSY - FYD+3/FMSY, i.e., the difference between the relative Fs estimated for YD and 3 years later. The solid line, which has slope -1, indicates the change that would have been required to stop overfishing when F/FMSY was larger than 1 (points to the right of the vertical dashed line). Points above the solid line correspond to stocks for which overfishing was taking place 3 years after they were designated as overfished.
particular canary rockfish, which was declared overfished in 1999 (Wallace, 2001).
As expected, fishing mortality for most stocks dropped following the designation as overfished. According to current assessments, the fishing mortality at the time of overfished designation exceeded FMSY for 36 stocks; this number dropped to 25 after 3 years and is 15 at present (Table 3.4; Figure 3.11). In the majority of stocks for which overfishing was taking place, fishing mortality dropped either before or soon after the overfished designation, but the extent of the drop differed among regions (Figure 3.10). The reduction in F in the Pacific (Figure 3.10g, h) was more consistent across stocks and occurred earlier (around year 2000) than in the North Atlantic (Figure 3.10e, f). In addition, the extent of overfishing was more severe for many of the Atlantic stocks than for stocks in other regions: fishing mortality was well above FMSY when stocks were declared overfished in the Atlantic, whereas in the Pacific it was generally either slightly above or below FMSY.
Although the decrease in F over the first 3 years after overfished designation tended to be larger the higher the initial F/FMSY (Figure 3.13), in some cases it was insufficient to stop overfishing (dots above the solid line). Furthermore, in five stocks (Gulf of Maine yellowtail flounder, the two cod stocks, Gulf of Mexico red snapper, and sandbar shark), F continued to increase even though it was more than three times FMSY in the year of overfished designation.
When overfishing was successfully stopped, the number of years it took for fishing mortality to be reduced below FMSY ranged from 2 to 10 years (Figure 3.14).
Various factors lead to management not always being effective at stopping overfishing. In particular, the relatively poor performance for stocks managed by the NEFMC can be attributed to the combined effects of delays implementing rebuilding plans, difficulties implementing reduced target fishing mortalities, and biases in the stock assessments for some of the stocks. Prior to the 2006 amendment, which required the use of ACLs, the primary means to implement the rebuilding target F was through the control of days-at-sea and time/area closures. Although days-at-sea were adjusted in an attempt to remain below the Target Total Allowable Catch (TTAC) derived from model projections under FACL,
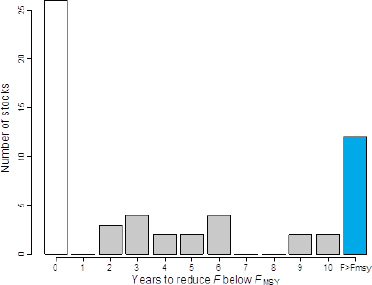
FIGURE 3.14 Number of years since each stock was declared to be overfished for fishing mortality to be reduced below FMSY, according to the most recent assessment. Results are for the 55 stocks selected for detailed evaluation. The blue bar corresponds to stocks that were still subject to overfishing (F>FMSY) in the last year covered by the assessment. The white bar corresponds to stocks not subject to overfishing at the time of declaration according to current assessments.
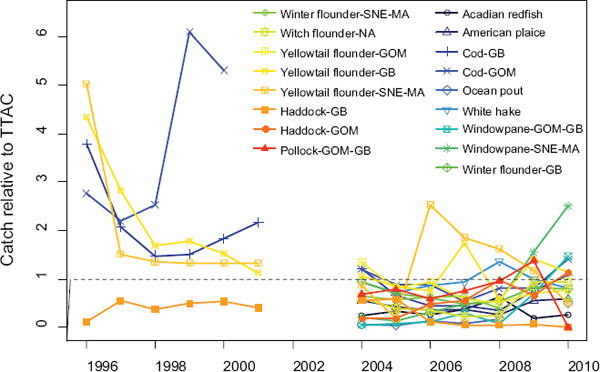
FIGURE 3.15 Catches of New England groundfish relative to Target Total Allowable Catches (TTACs) or Annual Catch Limits (ACLs) (since 2007). TTACs were not set in 2002-2003. Catches from Georges Bank correspond to U.S. catches only. In all cases, data correspond to calendar-year catches.
SOURCE: NEFMC.
the catch was only controlled indirectly, and the fishery was not closed when the TTAC was exceeded. Before 2002, catches of Georges Bank and Gulf of Maine cod and yellowtail flounder routinely exceeded the respective TTACs, but new, more effective effort controls were introduced in 2004, and catches have been generally kept below the TTACs since then, except for Southern New England-Mid-Atlantic (SNE-MA) windowpane and yellowtail flounder, and to a lesser extent Georges Bank yellowtail flounder (Figure 3.15). In the case of the two cod stocks, the TTACs were not exceeded. Thus, the failure of the rebuilding plans for these species (that were started in 2004) was not due to catches above the target amount.
In terms of stock assessment biases, there has been a tendency for some assessments to consistently overestimate stock size and underestimate fishing mortality (Legault, 2009). This tendency has been referred to as a “retrospective pattern,” a problem that has affected several stock assessments, primarily but not exclusively in New England. Figure 3.16 illustrates the problem with four NEFMC stocks for which current F is estimated to be higher than FMSY. The lines in each panel correspond to the time series of estimates of F/FMSY and B/BMSY produced by successive stock assessments; the end point of each line is the value used to determine stock status in the year when the assessment was conducted, which is used as the initial value to conduct stock projections for setting catch limits. It is expected that the estimates of historical F and B will vary when assessments are updated using new data. However, there is a tendency for successive updates to be in the same direction, that is, there is a retrospective pattern indicative of a bias in the estimates. In the examples provided, most notably in the cases of Georges Bank cod and yellowtail flounder, historical F estimates have been adjusted upwards and estimates of historical spawning stock biomass (SSB) have been adjusted downwards in each assessment update. This implies that the biomasses used to set allowable catches have been overestimated, leading to catches that were too high and fishing mortalities well in excess of the F rebuilding targets. The committee notes, however, that although this bias contributed to overfishing at no time during this period of stock assessments were the initial retrospective estimates of F below the most recent estimates of FMSY. The source of the retrospective pattern is not always clear, and thus the root of the problem cannot be corrected through modeling or data standardization. An ad hoc downward adjustment has been applied to the current estimates of SSB in cases of persistent retrospective patterns to avoid exceeding the target Fs (Legault, 2009).
In other cases, the failure of rebuilding plans to end overfishing has been due to difficulties in reducing overall fishing mortality when a species is caught as bycatch of a different fishery. This was, for example, the case of the red snapper stock in the Gulf of Mexico, whose juveniles are incidentally caught by shrimp trawl fisheries. The requirement to install devices in the shrimp nets to reduce discards led to improvements, but they were insufficient to end overfishing10 (Cowan et al., 2009). Subsequent rebuilding measures adopted in 2007 included a shrimp trawl fishing effort threshold to reduce bycatch, in addition to further reductions in commercial and recreational catch limits. Although the 2009 assessment (the most recent available for this review) still estimated fishing mortalities in excess of the FMSY proxy, estimated recent landings have led to a conclusion that overfishing has ended for this stock.11
Changes in Stock Size
The outlook in terms of biomass status relative to BMSY has also improved following overfished designation, but responses are smaller than those for fishing mortality (Figure 3.11). Although 35 stocks were below MSST 1 year before designation as overfished, 29 were overfished after 3 years, and 22 in the most recent assessment (Table 3.4). Conversely, 10 stocks were above BMSY the year before stocks were declared overfished, a number that has increased to 21 at present (Figure 3.11). Of the original 35 stocks that were below MSST, 10 rebuilt, 5 are rebuilding, and 20 are still overfished (Figure 3.17). The rebuilding delay reflects the time to reduce F below FMSY (Figure 3.12) and the time for biomass to rebuild once F is reduced. Stocks that rebuilt did so over periods that ranged from 5 to 13 years (Figure 3.17).
The difference in biomass between the year of the last assessment and the year the stock was declared overfished, scaled relative to BMSY, can be used to quantify the actual change in biomass following overfished designation. This metric, which looks at the direction of change of B, not whether it is approaching or has exceeded BMSY, shows that 76% of the stocks (42 of 55) have increased in biomass since overfished designation (Figure 3.18). However, in a large percentage (58%) of the stocks that were below BMSY, the increase has not been sufficient to achieve rebuilding within the time period during which stock responses have been evaluated (Figure 3.18a, dots below the solid line).
A plot of the change in B/BMSY as a function of the average F/FMSY since the year of overfished designation (Figure 3.18b) shows that most stocks increased in biomass when fishing mortality was less than or equal to FMSY. Some stocks still showed appreciable rebuilding when fishing mortality was above FMSY but less than 1.6 FMSY. Conversely, none of the stocks that had fishing mortalities in excess of 2 FMSY achieved any marked increase in biomass. One stock that stands out as an exception is the Southern New England/Mid-Atlantic stock of yellowtail flounder, which increased in biomass with a mean F of 2.35 FMSY. We note, however, that the upturn in biomass for this stock occurred after F
_________________
10http://sero.nmfs.noaa.gov/sustainable_fisheries/gulf_fisheries/red_snapper/overview/rebuilding/index.html.
11http://www.nmfs.noaa.gov/sfa/statusoffisheries/2012/first/Q1%202012%20FSSI%20Summary%20Changes.pdf.
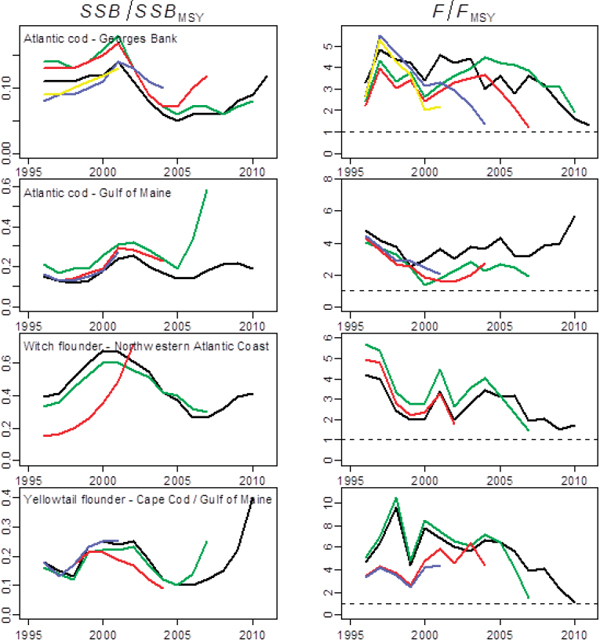
FIGURE 3.16 Time series of estimates of spawning biomass and fishing mortality, relative to the respective MSY reference points, produced by successive assessments for four stocks managed by the New England Fishery Management Council. Each color represents a new updated assessment: black is the most recent, and green, red, blue, and yellow are the preceding assessments, in that order. Time series are truncated in 1996 to focus on the most recent period.
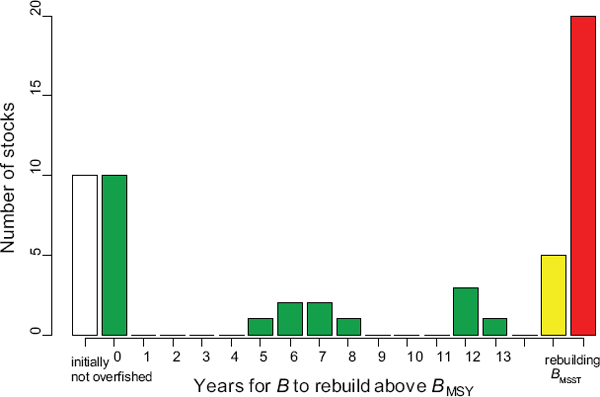
FIGURE 3.17 Number of years since each stock was declared to be overfished for biomass to rebuild above BMSY. Results are based on the 55 stocks selected for detailed evaluation. The red bar corresponds to stocks that were still overfished in the last year covered by the assessment and the yellow bar to stocks that exceeded MSST, but were still below BMSY. The white and first green bars correspond, respectively, to stocks that according to current assessments were respectively above MSST and BMSY in the year before being designated as overfished.
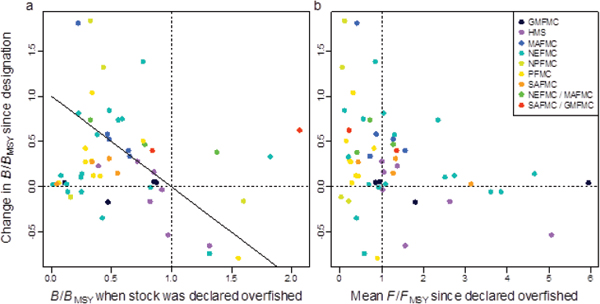
FIGURE 3.18 Change in relative biomass B/BMSY since overfished designation, versus B/BMSY when the stock was declared overfished (left panel) and as a function of average F/FMSY since overfished designation (right panel). The change in biomass was calculated as the difference in biomass between the year of the last assessment and the year the stock was declared overfished, scaled relative to BMSY The solid line in the left panel indicates the change that would have been required to achieve rebuilding (when B/BMSY was < 1). Each dot corresponds to a stock, colored by region.
had decreased to less than 2 FMSY, staying below FMSY in recent years (Figure C.63, Appendix C12). In addition, the recent increase in biomass for this stock, expressed in units of BMSY, appeared amplified by the use at the last assessment of a much lower value for BMSY (corresponding to recent low recruitment levels13).
A low fishing mortality, on the other hand, has not been sufficient to achieve rebuilding to BMSY for all stocks, in the time frame over which population responses have been assessed. Some stocks have not shown any significant rebuilding despite fishing mortality being controlled (e.g., Atlantic halibut), and two stocks (ocean pout and blue king crab [Pribilof Islands]) were below BMSY when declared overfished and declined appreciably even with F<FMSY. Lack of recovery in the case of blue king crab has been explained by regime shifts (see further discussion in Chapter 5). Atlantic halibut had been overfished for about a century and was severely depleted (< 0.1 BMSY) when fishing mortality was reduced (Figure C.4, Appendix C). These conditions have been associated with slow recovery rates and highly uncertain projections (Neubauer et al., 2013). The other stocks that decreased in biomass with average F<FMSY were Gulf of Maine haddock, eastern Bering Sea snow crab, and Pacific hake, all of which were above BMSY when declared overfished and are considered rebuilt. Pacific hake biomass is largely driven by highly variable recruitment and increasing fishing pressure (Figure C.33, Appendix C). Similarly, Gulf of Maine haddock had a very strong recruitment pulse in 1999 and, according to the last assessment, had already rebuilt when it was declared overfished; the decrease in biomass followed the passing of this strong year class, coupled with recent increases in fishing mortality (Figure C.29, Appendix C).
The changes in fishing mortality and biomass (based on the most recent assessments) over the entire period since being declared overfished are summarized in Figure 3.19 by region.
Although there is clearly considerable (regional) variation in trends, the general direction is for reduced fishing mortality (evidenced by arrows that indicate movement from the upper left to the lower left quadrant) and increased biomass (indicated by arrows from the lower left to the lower right quadrant). In addition, the majority of cases in which rebuilding or at least an increase in biomass occurred (arrows indicating displacement to the right), occurred when fishing mortality was below FMSY. Overall, most of the 55 stocks conform to classical fisheries theory in that biomass increases when fishing mortality is reduced.
Conclusions
Most U.S. fisheries have been managed using simple, constant, exploitation rate strategies, whereby the Overfishing Limit (OFL) is determined by applying a fixed target fishing mortality rate (F) to predictions of exploitable biomass for the following years and the Acceptable Biological Catch (ABC) is then computed by reducing the OFL to account for scientific uncertainty. Historically, few fisheries have sustained constant exploitation rates over time, partly because F increases when fisheries are developing. Even after FMSY has been reached, F often continues to increase, as illustrated in Figure 3.1a. In fact, the majority of stocks that were declared overfished and for which quantitative assessments are available (see Appendix C) exhibit this inverse relationship between F and B as biomass declines below BMSY, ending when the stock reaches the point where it is declared overfished. Fishing mortality may continue to increase beyond FMSY if exploitable biomass is consistently overestimated (e.g., Figure 3.16) or if there is a time lag between decreasing biomass and implementing reductions in catch limits. In theory, constant exploitation rate strategies and harvest control rules that decrease F when biomass drops below some threshold could achieve desired rates of rebuilding, but the historical trends observed for the majority of these stocks did not follow the trajectories expected under such management strategies.
The designation of a stock as overfished and the subsequent required implementation of a rebuilding plan have, in most cases, resulted in a change away from this pattern of increasing F with decreasing B and have prompted a reduction in F. The evaluation of F and B trends, based on a subset of 55 stocks assessed by quantitative methods, indicates that F was reduced below FMSY in 23 of the 36 stocks that were subject to overfishing at the time of overfished designation. Stocks now estimated to have been below their MSST when declared overfished (35 of the 55 stocks) have generally increased in biomass when F was reduced or kept below FMSY (21 stocks) and may be either rebuilding (5 stocks, or 14%) or have already rebuilt (10 stocks, or 29%). Of the 20 stocks estimated to still be overfished, 11 stocks (31%) had fishing mortalities well below FMSY in the last year included in the assessment, and many of them are showing significant rebuilding progress, while 9 stocks (26%) continued to be subject to overfishing. Overall, stocks that rebuilt or whose biomass increased appreciably were, in almost all cases, experiencing fishing mortalities below FMSY. These general conclusions about stock responses are similar to those of other studies of rebuilding overexploited populations (e.g., Milazzo, 2012; Neubauer et al., 2013; Sewell et al., 2013), although the percentage of stocks that fall in each response category would of course depend on the specific collection of stocks considered and on when the analysis was conducted. In addition, the percentage of U.S. stocks that rebuilt (29%) is somewhat lower than in
_________________
12 To view any of the time series plots (Figures C-1 to C-64), go to http://www.nap.edu/catalog.php?record_id=18488 and click on “Related Resources.”
13 Southern New England and Mid-Atlantic yellowtail flounder assessment summary for 2012. 54th SAW Assessment Summary Report. http://www.nefsc.noaa.gov/publications/crd/crd1218/partb.pdf.
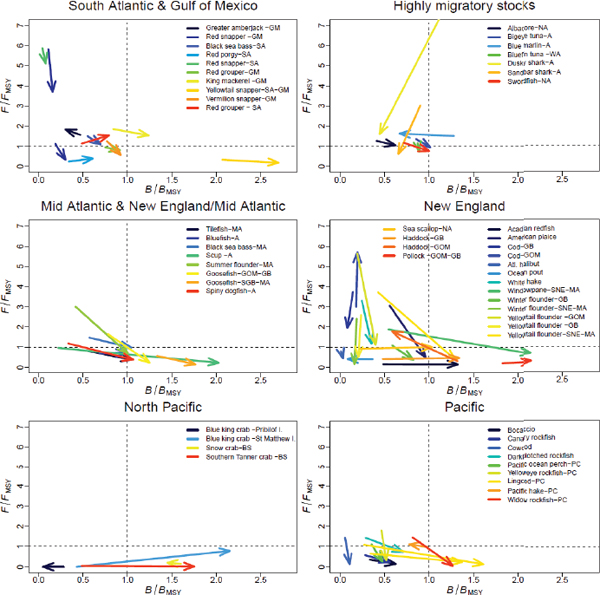
FIGURE 3.19 Change in status (F/FMSY and B/BMSY) from being declared overfished to the present. Results are shown for the subset of 55 stocks included in the evaluation, by region.
other studies because stocks now estimated to have not been overfished at the time of overfished designation were not included in the analysis.
A stock may not rebuild in a timely manner for a variety of reasons. First, target exploitation rates are selected so that there is at least a 50% probability of achieving rebuilding within the specified time period. Under such a criterion, even if everything went according to plan, only half the stocks would be expected to recover within the selected time horizon. Second, F for some stocks has continued to be high, still exceeding FMSY, in spite of the implementation of rebuilding plans with a target F equal to 75% FMSY or less. The failure of rebuilding plans to achieve adequate reductions in F reflects implementation problems due to ineffective input controls and a lack of accountability measures (e.g., as in New England before 2004), difficulties in lowering fishing mortality of species caught as bycatch of other fisheries, or errors in the estimates of stock size leading to ACLs that are too high. Nature is variable and changing, leading to high uncertainty in the stock assessments and population forecasts used to set ACLs even when data are abundant; furthermore, assessments can be consistently
biased as in the case of retrospective patterns. Third, there may be delays or difficulties in reducing target exploitation rates due to litigation and delays in implementing rebuilding plans.
The requirement for a rebuilding plan is triggered by the designation of a stock as overfished. Although this legal requirement was effective in forcing corrective management measures and in achieving needed reductions in F in the majority of the cases, reliance on the determination of stock status relative to a specific overfishing stock threshold (as opposed to a gradual reduction in F when the stock becomes depleted) is problematic. The review of changes in stock status associated with assessment updates presented in this chapter indicates that the determination of stock status has a relatively high probability of being wrong, given the uncertainties inherent in specifying a threshold for action and in determining whether the stock has dropped below that threshold. This dependence on an uncertain classification of stock status creates disjointedness in the management response mechanism needed to maintain fisheries at sustainable levels, and it amplifies the instabilities caused by changes in stock status associated with successive assessment updates. Management strategies that incorporate a smoother response to changes in stock biomass, as used in other jurisdictions (discussed below), are likely to be more robust to errors in determination of stock status and reevaluation of reference points.
INTERNATIONAL PERSPECTIVES
Introduction
Fisheries management, including efforts to rebuild overfished fish stocks, is arguably more advanced in the United States than in other countries or international organizations. The SFA mandated rebuilding of overfished stocks to BMSY 6 years before most nations committed to a comparable objective at the 2002 World Summit on Sustainable Development (United Nations, 2002). The latter committed to “[m]aintain or restore stocks to levels that can produce the maximum sustainable yield with the aim of achieving these goals for depleted stocks on an urgent basis and where possible not later than 2015” (United Nations, 2002).
Since 2002, several countries and jurisdictions have established or strengthened policies to prevent overfishing and rebuild overfished or depleted stocks. For example, the European Commission (EC) reformed its Common Fishery Policy in 2002 with the overarching objective of ensuring exploitation of living marine resources that provide sustainable economic, environmental, and social conditions (Article 2 of European Union, 2002). Australia established its Commonwealth Harvest Strategy Policy in 2007, and New Zealand finalized its Harvest Strategy Standard the following year (New Zealand Ministry of Fisheries, 2008). Canada similarly implemented the 2009 Sustainable Fisheries Framework (Fisheries and Oceans Canada, 2009). In 2012, the Organisation for Economic Co-operation and Development (OECD) published a report, which profiled seven member nations, including the United States, Australia, Canada, Korea, New Zealand, Norway, and Turkey (OECD, 2012). These profiles demonstrate the range of approaches that have been implemented throughout the world.
The fishery management frameworks in Australia, New Zealand, and Canada have important similarities to the U.S. approach based on the MSFCMA and NS1G. All aim to maintain or rebuild stocks to BMSY or larger. The frameworks limit fishing mortality to FMSY and require a reduction in fishing mortality as stock size decreases below BMSY, although they differ in how much below BMSY the stock must be to trigger a reduction and by how much fishing mortality is reduced. However, the frameworks in these three countries either have no time limit on rebuilding depleted or overfished stocks, or they have greater flexibility than in the United States.
New Zealand
Management of fish stocks in New Zealand is based on the 1996 Fisheries Management Act, which requires that the Total Allowable Catch (TAC) be set to maintain the stock at or above a level that can produce the MSY or to enable the size of any stock that is presently below that level to be increased. The sizes of stocks that are below BMSY should be increased “within a period appropriate to the stock, having regard to the biological characteristics of the stock and any environmental conditions affecting the stock.” As such, the 1996 Fisheries Management Act does not impose hard limits on the year by when depleted stocks are to be rebuilt. However, as noted below, such limits are included in the more recently adopted Harvest Strategy Standard.
New Zealand’s Harvest Strategy Standard (New Zealand Ministry of Fisheries, 2008, 2011) defines the target level for a New Zealand fish stock as “the desired biomass level or fishing mortality rate, or catch or proxies for each of these.” This Standard requires the definition of (a) a target level about which a fishery or stock should fluctuate, (b) a soft limit that triggers a requirement for a formal, time-constrained rebuilding plan, and (c) a hard limit below which fisheries should be considered for closure. Stocks that have fallen below the soft limit “should be rebuilt back to at least the target level in a time frame between TMIN and 2 * TMIN with an acceptable probability,” where TMIN is defined as in the United States. The Standard contains guidelines for the information that should be provided for stocks between the soft limit and the target (New Zealand Ministry of Fisheries, 2011), but there is no pre-specified rebuilding time frame for the stocks. The default soft limit is 50% of BMSY or 0.2 B0, whichever is higher, and the default hard limit is 25% of BMSY or 0.1 B0, whichever is higher.
Australia
The Commonwealth Fisheries Harvest Strategy Policy adopted by the Australian government (DAFF, 2007) provides a framework for the management of fisheries, which includes the definition of explicit default target and limit reference points and harvest control rules. Reference points used as targets are those related to Maximum Economic Yield (MEY). The biomass associated with MEY, BMEY, is usually set at the default proxy of 1.2 BMSY, and the default proxy for BMSY is 0.40 of the unfished level. Harvest control rules call for a progressive reduction of fishing mortality from FMEY to zero as biomass drops from BMSY to BLIM≥½ BMSY. A risk criterion has been established requiring that there is less than a 10% chance of the stock falling below BLIM per generation time under application of the harvest strategy. A rebuilding strategy, possibly including additional conservation measures, has to be developed for stocks that fall below BLIM. However, rebuilding management responses may be part of the “normal” harvest strategy, which specifies measures as a function of estimates of stock size. As far as setting a rebuilding time frame, the Australian legislation recognizes “that there are likely to be a number of alternative time paths to rebuild a stock” and that “the optimal time path to rebuild a stock has an economic component.” Still, “typical recovery times are defined as the minimum of: (1) the mean generation time plus 10 years or (2) three times the mean generation time (where the mean generation time is defined as the average age of a reproductively mature animal in an unexploited population).”
A variety of harvesting strategies that do not require the use of model-based F or B reference points have been developed for data-poor or low-value stocks. These may involve the use of empirical reference points and indicators (e.g., catch rates, age/size composition), effort controls, and area closures. Additional precaution may be implemented in order to achieve performance that is consistent with that of the model-based harvest rules.
The adoption of the Harvest Strategy Policy at the national level has been accompanied by increased use of spatial management, with 38% of Australia’s Exclusive Economic Zone currently within Marine Parks,14 a close to 30% reduction in fishing capacity through a government-funded buy-back program (Vieira et al., 2010) and significant investment to deter foreign illegal fishing15 (Sainsbury, personal communication).
Canada
Canada’s fisheries are primarily governed by the Fisheries Act. However, the Fisheries Act itself does not include specifics on rebuilding. Instead, the Act authorizes Fisheries and Oceans Canada to manage rebuilding through Integrated Fisheries Management Plans. The United Nations Agreement on Straddling and Highly Migratory Fish Stocks (UNFA), which went into effect in 2001, commits Canada to use the “precautionary approach” in managing both its migratory and domestic stocks. As a result, in 2006 Canada developed a fishery decision-making framework incorporating the Precautionary Approach,16 which classifies stock biomass as critical, cautious, or healthy. The amount harvested must be progressively reduced once a fish stock has fallen out of the healthy category and into the cautious zone. The reference point that separates healthy from cautious is known as the Upper Stock Reference (USR), which may be the target biomass, but could be another, higher target.
European Union
Fisheries management in the European Union (EU) is comparable to that in Canada, New Zealand, Australia, and the United States in many respects, but its fisheries are not performing as well in terms of stock status. EU fisheries are managed by the European Commission (EC) according to the Common Fisheries Policy (CFP), most recently reformed in 2002. The Policy calls for application of the precautionary approach to protect and conserve living aquatic resources, provide sustainable exploitation, and minimize impacts of fishing on marine ecosystems. It also calls for progressive implementation of an ecosystem-based approach to fisheries management. However, the lack of operational guidance for fisheries management and a clear priority for preventing overfishing is a serious problem with the Policy (Sissenwine and Symes, 2007). The EC also concluded, “No priority is set for these objectives and, while direct references are made to adopting a precautionary and an ecosystem approach, it is not clear how this relates to economic and social conditions. There are no clear indicators and yardsticks that could provide more concrete guidance or to help measure policy achievements” (European Commission, 2009). The EC review reported that 88% of European stocks were being fished beyond MSY, but the situation has improved since the report was issued.
In 2006, the EC adopted a policy for “implementing sustainability in EU fisheries through maximum sustainable yield” to fulfill its World Summit on Sustainable Development commitment to maintain or restore stocks to levels that can produce MSY by 2015 (European Union, 2006). According to the policy, the EC interprets its commitment to restore stocks to the MSY level by 2015 as meaning reducing fishing mortality to or below the FMSY level. Unlike the United States and many other countries, the EC policy does “not seek to manage biomass levels” (European Union, 2006,
_________________
14 Details of the Australian system of marine reserves are provided in http://www.environment.gov.au/marinereserves/overview.html.
15http://www.aic.gov.au/publications/current%20series/rpp/100-120/rpp109/08.html.
16http://www.dfo-mpo.gc.ca/fm-gp/peches-fisheries/fish-ren-peche/sff-cpd/precaution-eng.htm.
Section 3.3). It argues that biomass targets are highly uncertain because of environmental variability. The International Council for the Exploration of the Sea (ICES) began giving catch advice according to an MSY approach in 2010 (ICES, 2010). This approach uses a biomass reference point as a trigger for reducing fishing mortality, but it does not require an estimate of BMSY because such estimates are considered to be dynamic and uncertain, particularly for fisheries that have been overfished for so long that BMSY is an extrapolation outside the range of stock observations.
In 2009 the EC launched a public process to discuss the EU’s management of fisheries. The debate focused on a suite of issues that included fleet overcapacity, inadequate policy guidance for decision making and implementation, political will around issues of enforcement, and the roles and responsibilities of the fishing industry. This process resulted in a new CFP agreement to be implemented in early 2014, which involves a commitment to ending overfishing by 2015 where possible, and at the latest by 2020, for all fish stocks.
Comparison of Stock Status Statistics
Although data are difficult to compare, recent assessments indicate that stock status in the United States is similar to that found in Canada, New Zealand, and Australia. In 2012 the United States reported that 20% of assessed stocks were overfished while 13% were undergoing overfishing (Table 3.1). For stocks with known status in 2011, Canada reported that 12% were harvested above approved levels, and, in terms of biomass, 60% were healthy, 26% required caution (i.e., a progressive reduction in removal rate is required), and 14% were in the critical zone (i.e., below a limit reference point where removals are kept to the lowest possible level).17 For New Zealand, the percentage of depleted stocks (comparable to “overfished” in the United States) decreased slightly from 19% to 17% and the percentage of stocks subject to overfishing decreased from 25% to 18% from 2009 to 2012 (Mace, 2012, personal communication). Finally, of these four countries, Australia reported the lowest percentages of stocks classified as overfished (12%) and undergoing overfishing (6%), for stocks whose status could be determined as of 2011 (Woodhams et al., 2012).
The proportion of European stocks subject to overfishing is much larger than in the United States, Canada, Australia, or New Zealand, although it has dropped substantially over time (Table 3.5). However, 80% of stocks in the Mediterranean and Black Seas are reported as still undergoing overfishing in 2012 (European Commission, 2012).
The United Nations Food and Agriculture Organization (FAO) reported that about 30% of the world’s fish stocks of known status are overexploited (which corresponds to overfishing in the United States) (FAO, 2012). Thus, the United States, Canada, New Zealand, and Australia are performing somewhat better than Europe and the worldwide average (Figure 3.20).
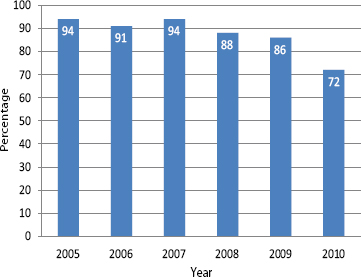
FIGURE 3.20 Percentage of European stocks with overfishing relative to FMSY.
SOURCE: European Union, 2012.
FINDINGS
3.1: During the period 1997-2011, 85 stocks or stock complexes were at some point declared to be overfished or approaching an overfished state and were therefore subject to being placed under rebuilding plans. Rebuilding plans were implemented for 79 of those stocks.
3.2: Analysis of the annual reports to Congress indicates that 42 of these 85 stocks are no longer classified as overfished: 11 are rebuilding and 31 were subsequently designated as rebuilt, one of which is currently considered of undefined status. Four additional stocks that were declared rebuilt became overfished again, and one is approaching overfishing.
3.3: The 10-year rule determined the target year for rebuilding in 31 of the 70 stocks for which rebuilding plans with a defined rebuilding time frame have been implemented.
3.4: Target fishing mortalities have generally been lower than 75% FMSY. In some regions, target fishing mortalities are substantially lower, and rebuilding time frames chosen in those regions are much shorter than the maximum specified by the National Standard 1 Guidelines. More extreme reductions in target fishing mortalities have been effected in situations in which rebuilding progress was slower than
_________________
17 Data provided by Environment Canada, http://www.ec.gc.ca/indicateurs-indicators/default.asp?lang=en&n=1BCD421B-1.
anticipated when the rebuilding plan was adopted and the target year for rebuilding was approaching.
3.5: Because of the uncertainty in stock assessments, the perceived status offish stocks relative to overfished status in any particular year can change substantially as more data become available and assessment methods are changed over time. According to the most recent assessments available, there is a substantial probability of
- Classifying stocks as overfished and requiring rebuilding plans when later assessments indicate that the stocks were not below the Minimum Stock Size Threshold.
- Classifying stocks as rebuilt when the updated assessments indicate that the stock was not overfished.
The probability of classifying stocks that are overfished as healthy cannot be quantified from the data available, but may also be high.
3.6: Estimated trends for 55 stocks declared overfished, assessed by quantitative methods, and placed under rebuilding plans indicate that fishing mortality has generally been reduced, and stock biomass has generally increased. Of the 35 stocks now estimated to have been below their MSST when declared overfished, 10 have rebuilt, 5 are rebuilding (MSST<B<BMSY), and 6 have increased in size. Of the remaining 20 stocks estimated to still be overfished, 11 had fishing mortalities well below FMSYin the last year included in the assessment and are therefore expected to rebuild if low fishing mortalities are sustained. Stocks that rebuilt or whose biomass increased appreciably were, in almost all cases, experiencing fishing mortalities below FMSY.
3.7: Some stocks continue to be subject to overfishing despite fishing targets being set at or below FMSYwith the intent of rebuilding within the maximum time frame. Retrospective patterns in the assessments leading to overestimation of stock size have contributed to this continuing overfishing.
3.8: Although rebuilding plans have target years for recovery to BMSY, the rate at which stocks rebuild is probabilistic such that some stocks will rebuild before the target year while others will rebuild after the target year or not rebuild until environmental conditions improve, even if the rebuilding plan is implemented as intended, fishing mortalities are close to the targets, and targets are based on robust stock assessments.
3.9: More than half of the nation’s 478 stocks and stock complexes identified in the stock status reports to Congress are either unassessed or unknown with regard to their status as overfished or overfishing.
3.10: Countries that have legal or policy mandates for ending overfishing and rebuilding stocks appear to have better stock status on average than other countries.


