
Technical Considerations in Developing Rebuilding Plans
INTRODUCTION
The Magnuson-Stevens Fishery Conservation and Management Act (MSFCMA) requires that fisheries be managed to achieve Optimum Yield (OY), which, under the current specification of the law, is considered to be the Maximum Sustainable Yield (MSY) as reduced by ecological, economic, and social factors1 (Chapter 2). Consequently, the concept of MSY is a key to the implementation of the MSFCMA, as it is for fisheries management in general worldwide (United Nations, 2002). According to theory, a population (quantified in terms of biomass, measured as the number of individuals multiplied by their average weight) can produce an annual surplus in biomass that can be harvested sustainably. Over the range of population biomasses, there exists a level at which the average sustainable surplus and associated harvest is maximized. Broadly, if a population is allowed to grow until it reaches its environmental carrying capacity, then surplus production will cease and the population will grow no further. Production may also be negligible if the population is driven to critically low levels, at which it would be considered collapsed. Theoretically, between these maximum and minimum population levels, a surplus in production can be harvested on a regular basis while the population is sustainably maintained. The maximum surplus production thus determines the MSY, which occurs at some intermediate population size (BMSY). The fishing mortality corresponding to this MSY, FMSY, is the rate of population removal by the fishery that will maintain the average population size at BMSY. The function that relates surplus production to fishing mortality (F) and population biomass (B) is referred to as the production function. It has been recognized for some time that trying to harvest at MSY on an ongoing basis is fraught with risk because of the variability and uncertainties that exist in nature, science, and management (Larkin, 1977). Nevertheless, the concept can be a useful one in establishing sizes and harvest rates that a population can sustain and be productive, given its life-history characteristics and dynamics.
ACCOUNTING FOR UNCERTAINTY IN FISHERIES REBUILDING
The ability to implement MSY-based fisheries management depends upon the characteristics of the stocks and the fisheries, the quality and quantity of data available for both, the production model chosen, and the frequency at which assessments occur so that management can act adaptively. MSY concepts were designed for, and work best for, data- and knowledge-rich fisheries, which are generally those stocks that are of greatest economic value, productivity, and volume. The high-valued Alaskan fisheries, which constitute more than half of the annual landings in the United States by weight (NMFS, 2012), exemplify a number of success stories in this context (Chapter 3). In contrast, most stocks in the Caribbean and Western Pacific are considered “data-poor” and do not have enough information for estimation of MSY or application of MSY-based control rules.
MSY, BMSY, and FMSY can be influenced by a number of factors:
- MSY depends on fishing practices. FMSY is usually treated as a single value under the assumption that the relative fishing mortalities-at-age are constant (i.e., time-invariant fishing selectivity is assumed). Depending on the fishing gear or combination of gears used, it might be possible to increase the long-term sustainable yield by reducing the proportion
_________________
1 16 U.S.C. § 1801(b)(4); 16 U.S.C. § 1802(33).
of small fish captured (e.g., with larger trawl mesh size). The fact that FMSY depends on selectivity can lead to counterintuitive outcomes when management measures are applied through adjustments in gear selectivity. For example, if mesh size is changed to protect smaller fish and increase potential long-term yield, then the BMSY associated with the resulting new selectivity pattern could also be larger. This could lead to an overfished condition without overfishing having occurred, if current biomass is less than the new, larger BMSY.
- MSY depends on environmental conditions. MSY is derived from a production function, which depends on biological processes, including reproduction, growth, and natural mortality. These processes are all affected by environmental conditions, which vary in space and time, such that MSY also changes. BMSY is therefore usually interpreted as the long-term average biomass level associated with FMSY. This approach is probably satisfactory when there are interannual or relatively short-term fluctuations in environmental conditions. However, a production function or an estimate of BMSY based on a past average may not be a useful representation of the future in cases when gradual environmental changes occur over longer time periods (e.g., decadal) or when permanent changes in average conditions occur, such as phase shifts (see Chapter 5).
- MSY depends on ecological interactions. Biological processes for one species (e.g., growth and natural mortality) are affected by changes in the abundance of interacting species, which may also be subject to management. Competition for food and predator-prey interactions make it unlikely that all species can be maintained simultaneously at the BMSY values calculated for each species individually. Just as the single-species production function depends on fishing practices that influence the size composition of fish in the population, the multispecies production function depends on fishing practices that influence the species composition of the community. Multispecies production functions have been calculated for communities of fish (e.g., Brown et al., 1976) and have been considered in the setting of a multispecies Total Allowable Catch (TAC) for the International Commission for the North Atlantic Fisheries (ICNAF) (Halliday and Pinhorn, 1985; O’Boyle, 1985). The impact of ecological interactions on rebuilding is discussed further in Chapter 5.
- MSY depends on technical interactions. When a fishery aimed at one species generates fishing mortality on other species, which occurs both in mixed-stock fisheries and in the inevitable situations of bycatch, it is referred to as “technical interaction.” It is generally not possible to apply desired fishing mortality rates to all species simultaneously when there are technical interactions, so the maximum total average catch that can be taken from a community of interacting species is lower when there are technical interactions. The target fishing mortality for some stocks may need to be reduced below (perhaps substantially below) FMSY if the mix of stocks caught includes some unproductive (or rebuilding) stocks, given the requirement to avoid overfishing of any stocks. The practice of reducing the target fishing mortality for productive stocks to avoid overfishing unproductive stocks is common and is referred to as “weak stock management.” For example, catches of yellowtail rockfish off the U.S. coast were substantially reduced when the widow rockfish was declared overfished and its harvest subsequently reduced. Weak stock management, and technical interactions in general, can lead to marked economic and social impacts, as discussed in Chapter 6.
- MSY relates to biological yield (number, weight, or volume of fish). It does not account for the value of the fish, the cost of catching the fish, the distribution of benefits from fishing, or the socioeconomic impacts of fisheries management measures. Although they exist, economic analogs of MSY (e.g., Maximum Economic Yield, as defined in Chapter 2) are not currently used for status determination in the United States. (See Chapter 6 for details on the socioeconomic dimensions of rebuilding.)
Setting Reference Points and Targets for Rebuilding
As outlined in Chapter 2, the National Standard 1 Guidelines (NS1G) specify that overfishing is occurring when fishing mortality is above the Fishing Mortality Maximum Threshold (FMMT), which is equal to or less than FMSY. A stock is considered overfished when stock biomass drops below the Minimum Stock Size Threshold (MSST).2 MSST is commonly set at ½ BMSY, but guidance has been provided indicating that other values might be selected. Restrepo et al. (1998), for example, advocated for MSST=(1– M) BMSY, where M is the instantaneous rate of natural mortality. The current NS1G state that MSST should be a biomass level from which a stock will recover to BMSY in 10 years if F=FMSY. Measures must be put in place to reduce mortality when overfishing (i.e., F>FMSY) is estimated to occur. Once the overfished threshold is impinged upon (i.e., B< SST), a fishing mortality that would allow for rebuilding, FREBUILD, is usually determined with the goal of fishing at low enough levels to allow biomass to grow to BMSY with 50% probability or greater within a specified time period. Ultimately
_________________
2 50 C.F.R. 600.310 (e)(iv)(2)(B)-(E) (2009).
the target fishing mortality used to calculate the Accepted Biological Catch (ABC) (FACL) may be lower than this, as is the case in New England where FACL is set to FREBUILD or 75% FMSY, whichever is less (see Chapter 3). There exists considerable variability in how these reference points are defined and how population biomass is monitored relative to the BMSY reference point.
Three general approaches have been used to derive biological reference points using population dynamics models (Sissenwine and Shepherd, 1987). These are the classical production modeling approach (Graham, 1935; Schaefer, 1954, 1957; Pella and Tomlinson, 1969), the yield-per-recruit approach (Thompson and Bell, 1934; Beverton and Holt, 1957), and the spawner-recruit approach (Ricker, 1954; Beverton and Holt, 1957). The classical production model follows changes in population biomass relative to changes in catch to estimate the intrinsic rate of population growth and the carrying capacity, which can be used to determine FMSY and BMSY. The yield-per-recruit model follows the changes in the biomass of a cohort of fish through time due to mortality and individual growth to determine the fishing mortality that maximizes the lifetime yield for that cohort (FMAX). The estimates of FMAX and other Fs derived through yield-per-recruit analyses, such as for example F0.1, have often been used as proxies for FMSY when there is insufficient information to support one of the other two approaches. When age information is available, a spawner-recruit model might be formulated and spawning stock levels that maximize the catch (the product of yield-per-recruit and recruits) can be determined. Thus, the F and B that maximize production in this context are again interpreted as FMSY and BMSY. However, even in these situations, the relationship between number of recruits and measures of reproductive potential may be so uncertain that proxies (such as F35% or F40%, defined as the fishing mortality that reduces the average spawning stock biomass-per-recruit to 35% or 40% of the unfished level) might be used instead (see, for example, the work by Clark, 1991, 2002). Consequently, there are several approaches to deriving biological reference points depending on the information available. In the many cases when information about production is limited or unavailable, reference points may still be calculated, albeit with increased uncertainty.
In practice, FMSY is more robustly estimated and has a firmer foundation for implementation than does BMSY, especially in situations where reference points are used in a rebuilding context. The value of FMSY varies directly with the slope of the stock-recruitment or stock-production relationship. Overfished stocks have data at low abundance that may allow this slope, and hence FMSY, to be estimated with greater confidence than will stocks without data at low abundance. In contrast, the biomass reference points BMSY and the unfished biomass, B0, depend on the strength of density dependence, which determines the curvature of the stock-production relationship. The degree of curvature is not well determined from data at low abundance. Therefore the estimates of BMSY are expected to change (and hopefully improve) as stocks rebuild. Even if BMSY is not used as a target, biomass reference points are usually still used to specify harvest control rules, as discussed in the section below. Here the choice of biomass threshold may be less critical to the performance of the harvest control rule provided that F is reduced smoothly when biomass falls below the threshold.
The problem with estimating BMSY from stock-recruit data is that it requires fitting a compensatory stock-recruitment function to estimate the average recruitment corresponding to BMSY so that it can be multiplied by the spawning stock biomass-per-recruit at FMSY. Even for stocks that have been reduced to low abundance, the stock-recruitment relationship may remain uncertain. This can occur when the relationship between recruits and spawning stock appears to be a random scatter of points. Here there would be no evidence that recruitment decreases with decreases in spawning stock biomass. In this situation, FMAX may be the best proxy for FMSY, although F01 might be more precautionary. In the case when there is a scatter of points that shows at least some evidence of decreasing recruitment with decreasing spawning stock biomass, an estimate of the slope at the origin is possible. If the slope corresponds to an F that is less than FMAX, then one might use that estimate for FMSY, otherwise FMAX may still be the best proxy for FMSY. In these cases of uncertain stock-recruitment relationships, it is common to turn to F proxies such as F35% or F40%, as discussed above. Regardless of whether a direct FMSY estimate or proxy is used, assumptions about the distribution of recruitment are required to estimate BMSY. The choice of proxy is also uncertain because proxies may have been derived using generic life histories, which may be inadequate for the stock in question. There is a tradeoff between choosing an uncertain reference point or a potentially biased proxy. More years of data over a greater range of stock abundance should allow for estimation of these biological reference points with more precision.
Potentially very rudimentary and ad hoc reference points are used in data-poor situations where even the most basic productivity information is lacking. For example, management actions may be based on changes in fishery-dependent or -independent CPUE indices over time, relative to some reference level (as is done for the skate complex in New England and coral reef fish in the Western Pacific). Some experts have suggested using other metrics such as changes in average length as a proxy for mortality (Brodziak et al., 2012) or defining overfishing in terms of declines in growth, recruitment, economic value, or ecosystem integrity (Russ, 1991). Although relating these metrics directly to BMSY is not always possible, establishing such benchmarks for management action in data-poor situations should facilitate keeping the fishery at some sustainable level, although that level may not be optimal or necessarily equate to the legal equivalent of BMSY.
Given the wide range of information available to estimate reference points, it is not surprising that the operational
definitions for overfishing and overfished vary among U.S. regions and even among stock categories within regions (Table 4.1). This variation can lead to inconsistencies among regions. For example, the North Pacific Fishery Management Council (NPFMC) would declare a stock of Pacific Ocean perch (Sebastus alutus) to be overfished if its biomass was less than half of the estimate of B35%. In contrast, the Pacific Fishery Management Council (PFMC) would declare the stock overfished if its biomass was below 25% of the unfished equilibrium biomass, B0. Consequently, the nature of the fishery, the condition of the environment, the quality of the data, and even the background and experience of the scientists and managers will play a role in determining whether a stock needs rebuilding, how and to what level it should be rebuilt, and the mechanisms by which progress toward rebuilding will be monitored.
Resolving the problem of accounting for scientific uncertainty in formulating management advice is more complicated than simply choosing how to specify the reference points. For many, if not most, stocks there may be multiple
TABLE 4.1 Summary of the Overfishing and Overfished Definitions for Various Selected Categories of Fish and Invertebrate Species by RFMC
(a) New England Fishery Management Council
|
|
||
| Species Group | Overfished Definition | Overfishing Definition |
|
|
||
| Northeast Multispecies | ||
|
GOM Cod |
B<½ BMSY | F>F40% |
|
GBK Cod |
B<½ BMSY | F>FMSY |
|
GOM and GBK Haddock |
B<½ BMSY | F>FMSY |
|
American Plaice |
B<½ BMSY | F>FMSY |
|
Witch Flounder |
B<½ BMSY | F>F40% |
|
GOM and GBK Winter Flounder |
B<½ BMSY | F>FMSY |
|
CC/GOM and GBK Yellowtail Flounder |
B<½ BMSY | F>FMSY |
|
SNE/MA Yellowtail Flounder |
B<½ B35% | F>F40% |
| Other Speciesa | B<½ BMSY | F>FMSY |
| Scallops | B<½ BMSY | F>MFMTb |
| Monkfish | B<½ BMSY | F>MFMTc |
| Small Mesh Multispecies | ||
|
Silver Hake |
B<½ BMSYproxy | F>F0.1 |
|
Northern Red Hake |
3 yr mean CPUEsurvey<1.6 kg/tow | F>FMSY proxy |
|
Southern Red Hake |
CPUEsurveyd<25th percentile of CPUEsurvey series | NA |
|
Offshore Hake |
CPUEsurveyd<25th percentile of CPUEsurvey series | NA |
| Dogfish | B<½ BMSYproxye | F>MFMTf |
| Red Crab | B<½ BMSY | F>FMSYg |
| or Average CPUE<CPUEbase for 3 yrs CPUEsurvey | ||
| or Average CPUE<CPUEthreshold in 1 yr | ||
| Skates | ||
|
Winter andLlittle |
CPUEsurveyd<75th percentile of CPUEsurvey series | 3 yr CPUEaverageh>20% |
|
Barndoor |
CPUEsurveyd<½ 0.81 kg/tow | 3 yr CPUEaverageh>30% |
|
Thorny |
CPUEsurveyd<75th percentile of CPUEsurvey series | 3 yr CPUEaverageh>20% |
|
Smooth and Clearnose |
CPUEsurveyd<75th percentile of CPUEsurvey series | 3 yr CPUEaverageh>30% |
|
Rosette |
CPUEsurveyd<75th percentile of CPUEsurvey series | 3 yr CPUEaverageh>60% |
|
|
||
a Pollock, redfish, white hake, Atlantic halibut, ocean pout, windowpane flounder, SNE/MA winter flounder, wolfish, herring.
b MFMT is based on a stochastic YPR model.
c MFMT is based on an FMSY PROXY’FMAX.
d Overfished status is determined based on current survey CPUE measured as mean weight per tow when compared to a percentile of the CPUE from a specified time series of stable CPUEs.
eBMSY PROXY set to SSBMAX.
f MFMT is based on an FMSY PROXY’Frep.
gFMSY is defined as average landings/average survey index during stable period.
h Overfishing determined as a decline of X% or more in the 3-year moving average of CPUE measured as mean weight per tow in the Autumn survey.
(b) Mid-Atlantic Fishery Management Council
|
|
||
| Species Group | Overfished Definition | Overfishing Definition |
|
|
||
| Squid, Butterfish, Mackerel | Unknown | Unknown |
| Bluefish | B<½ BMSY | F>FMSY |
| Spiny Dogfish | B<100,000 mt | F>FMSY |
| Summer Flounder | B<½ BMSY | F>FMSY |
| Scup | Spring survey<2.77 kg/tow | F>FMSY |
| Black Sea Bass | Unknown | F>FMAX |
| Surfclam | B<½ BMSY | F>FMSY |
| Ocean Quahog | B<977,000 mt | F>F25% |
| Tilefish | B<½ BMSY | F>FMSY |
| Monkfish | B<½ BMSY | F>FMAX |
|
|
||
(c) South Atlantic Fishery Management Council
|
|
||
| Species Group | Overfished Definition | Overfishing Definition |
|
|
||
| Shrimp | B<½ BMSY | F>FMSY |
| Spiny Lobstera | NA | NA |
| Black Sea Bass | B<(1–M)BMSY | F>FMSY |
| Red Porgy | B<(1–M)BMSY | F>FMSY |
| Red Snapper | B<(1–M)BMSY | F>FMSY |
| Snowy Grouper | B<MSST | F>FMSY |
| King Mackerela | B<(1–M)B30% | F>F30% |
| Yellow Snapper | NA | NA |
| Red Grouper | B<½ BMSY | F>FMSY |
|
|
||
a Managed jointly with GMFMC.
(d) Gulf of Mexico Fishery Management Council
|
|
||
| Species Group | Overfished Definition | Overfishing Definition |
|
|
||
| Shrimp | B<½ BMSY | F>FMSY |
| Spiny Lobstera | NA | NA |
| King Mackerela | B<(1–M)BMSY | F>FMSY |
| Spanish Mackerela | B<(1–M)BMSY | F>FMSY |
| Cobia | NA | NA |
| Gray Triggerfish | B<(1–M)B30% | F>F30% |
| Greater Amberjack | B<(1–M)BMSY | F>MFMT |
| Red Snapper | B<(1–M)B26% | F>F26%SPR |
| Gag | B<(1–M)BMSY | F>FMAX |
| Red Grouper | B<(1–M)BMSY | F>FMSY |
|
|
||
a Managed jointly with SAFMC.
(e) Caribbean Fishery Management Council
|
|
||
| Species Group | Overfished Definition | Overfishing Definition |
|
|
||
| Queen Conch | NA | NA |
| Caribbean Grouper | NA | NA |
| Spiny Lobster | NA | NA |
|
|
||
(f) Pacific Fishery Management Council
|
|
||
| Species Group | Overfished Definition | Overfishing Definition |
|
|
||
| Groundfish | ||
|
Rockfish and Elasmobranches |
B<¼ B0 | F>F50% |
|
Roundfish |
B<¼ B0 | F>F45% |
|
Flatfish |
B<1/8B0 | F>F30% |
| Salmon | B<½ BMSY or ¾ BMSYe | F>MFMTd |
| High Migratory Speciesa | B<(1-M) BMSY for M £ ½ | F>FMSY |
| B<½ BMSY for M>½ | ||
| Coastal Pelagic Species | B1+<150,000 mt (Pacific sardine)b | Catch>OFL |
| B1+<18,200 mt (Pacific mackerel) b | ||
| Catch>31,000 mt (Jack mackerel)c | ||
| Catch>9,750 mt (northern anchovy northern pop)c | ||
| Catch>25,000 mt (northern anchovy southern pop) | ||
| Egg escapement-per-recruit<30% unfished (market squid)c | ||
|
|
||
a Defaults; used unless an RFMC develops alternative definitions.
bB1+ is the biomass of animals aged 1 and older.
c There are monitored species in the CPS Fishery Management Plan.
d MFMT is less than or equal to FMSY where FMSY is either estimated or for Chinook salmon assumed to be 0.78.
e Biomass is a 3-year geometric mean of annual spawning escapement. BMSY is estimated variously for each salmon stock.
(g) North Pacific Fishery Management Council
|
|
||
| Species Group | Overfished Definition | Overfishing Definition |
|
|
||
| Groundfish | ||
|
Tiers 1 & 2 |
B<½ BMSY | Catch>OFL |
|
Tier 3 |
B<½ B35% | Catch>OFL |
|
Tiers 4-6 |
N/A | Catch>OFL |
| Bering and Aleutian Islands Crab | ||
|
Tiers 1 & 2 |
B<½ BMSY | Catch>OFL |
|
Tier 3 |
B<½ B35% | Catch>OFL |
|
Tier 4 |
B<½ BMSYproxya | Catch>OFL |
|
Tier 5 |
NA | |
| Scallops | NA | Catch >OFL |
|
|
||
a An average biomass selected by the NPFMC SSC as reflecting when the stock was at BMSY.
(h) Western Pacific Fishery Management Council
|
|
||
| Species Group | Overfished Definition | Overfishing Definition |
|
|
||
| Pelagics | B<max (1-M, ½) BMSY | F>FMSY if B> max (1–M, ½) BMSY |
| F>FMSYB/ max (1–M, ½) BMSYif B> max (1–M, ½) BMSY | ||
| Bottom Fish | B<max (1-M, ½) BMSY | F>FMSY if B> max (1–M, ½) BMSY |
| F>FMSYB/ max (1–M, ½) BMSY if B> max (1-M, ½) BMSY | ||
| Crustaceans | NA | NA |
| Precious Corals | NA | NA |
| Corals | Effort>EffortMSY | CPUE<CPUEMSY |
|
|
||
plausible representations of the dynamics and productivity of a stock with little scientific basis for choosing among them, even when classical estimation methods are applicable and a given choice for the reference point is clear (e.g., FMSY based on a stock-recruitment relationship). For example, the fit of either a Beverton-Holt or Ricker stock-recruitment model to the data may appear to be equally plausible, but the biological reference points estimated with the two models may be dramatically different (see, for example, Myers et al., 1994 and Barrowman and Myers, 2000). Unfortunately, the choice of how the dynamics are represented may be critically important for determining the tradeoffs between short-term and long-term benefits from the fishery and risks to the stock. In such situations, scientists are more often communicating the uncertainty to managers and policy makers, outlining the implications of each plausible model under the alternative rebuilding strategies, usually in the form of some decision table (see, for example, Lane and Stephenson, 1998; MacCall, 1999). The bridge between best use of science and accounting for risk in decision making will continue to develop with necessary input from all parties involved.
Harvest Control Rules
FREBUILD is defined as the fishing mortality rate that would allow the stock to recover with 50% or greater probability (the probability is a management choice) to BMSY within the allotted recovery time period (i.e., by TTARGET). FREBUILD is typically determined through simulations conditioned upon a population-dynamics model and according to a harvest control rule (HCR), which may call for changes in F as a function of stock status and possibly other variables. Ideally, HCRs are established by the Regional Fisheries Management Councils (RFMCs) during the development of the Fishery Management Plan (FMP), which is implemented, hopefully, prior to any need for stock rebuilding. HCRs should specify the strategy for maintaining a sustainable fishery and should establish what actions to take if a stock is designated overfished or if overfishing is taking place. HCRs might include rules that differ according to whether the stock is healthy, just below BMSY, overfished, or in a rebuilding phase (Punt, 2003; Punt and Ralston, 2007), although it would be best if they were constructed so as to avoid discontinuities, as discussed below. Simulations that use HCRs, and are based on the assessment model or a reasonable approximation of it, can then be used to predict what is likely to happen under different management scenarios when exploring options for the target rebuilding year. Most modern simulation methods allow for quantification of the uncertainty associated with the projections, such that the probability of the stock being above or below BMSY in any future year can be calculated. However, even if the projections are relatively accurate, the population is still, by definition, only expected to reach the target biomass level half of the time if the plan chosen is based on a 50% rebuilding probability.
The current “10-year rule,” established by the NS1G to set the maximum rebuilding time, leads to a discontinuity because a small change in information (or model assumptions) can lead to a major change in the maximum permissible time to rebuild to BMSY (TMAX). The HCRs used to determine Annual Catch Limits (ACLs) have similar discontinuities, depending on whether or not a stock is under a rebuilding plan. Figure 4.1 provides illustrative examples of how and when discontinuities can occur and be avoided (based loosely on control rules used by the NPFMC and the PFMC for groundfish stocks). Figure 4.1(a) shows the HCRs for stocks whose sizes are larger than MSST (taken to be 0.5BMSY in this example) and therefore are not subject to a rebuilding plan. Fishing mortality is maintained at a rate that is less than FMSY when biomass is larger than BMSY to ensure that overfishing does not take place with some chosen probability, and fishing mortality should decline when stock size is smaller than BMSY. However, if the stock had been designated overfished and has not rebuilt, then ACLs would be based on an HCR such as that in Figure 4.1(b). The change from the “normal FMP” HCR in Figure 4.1(a) to the rebuilding HCR in Figure 4.1(b) can lead to a marked change in allowable fishing mortality and hence catch. Paradoxically, rebuilding HCRs can result in an increase in removals compared to what would have been expected under the “normal” HCR, as can be seen by extending the dashed diagonal line in Figure 4.1(a) to intersect the lower horizontal line in Figure 4.1(b) at some stock sizes. In addition, once the stock has rebuilt to BMSY, the fishing mortality will increase from the rebuilding fishing mortality (0.2FMSY in Figure 4.1(b)) to the fishing mortality under the “normal” HCR. Thus, the target fishing mortality for a stock whose size is between MSST and BMSY depends on whether the stock is governed by normal FMP HCRs (if it has not been overfished) or by a rebuilding plan. Such discontinuities resulting from implementation of the NS1G exemplify the advantages of policies that adjust fishing mortalities gradually and smoothly as a function of changes in stock size regardless of whether or not the stock has been designated overfished.
In general, the ability to satisfy management goals while avoiding unnecessary disruptions in the operation of a fishery is best achieved when there are few or no discontinuities. For example, a control rule such as that in Figure 4.1(c) would permit rebuilding to BMSY while avoiding discontinuous changes in fishing mortality. However, the time to rebuild to BMSY would not necessarily match the time expected under the existing rules for determining TMAX, although the values for the parameters of the HCR could be chosen with this intent in mind. An additional advantage of having a single, continuous HCR is that it reduces dependence on the application of status determination criteria (overfished versus not overfished), which may be highly uncertain and prone to changes with successive assessment updates, as discussed in Chapter 3. The recent re-categorization of the yellowtail flounder stock from southern New England as rebuilt pro-
FIGURE 4.1 Illustrative harvest control rule (HCR) for a stock for which MSST = ½ BMSY. (a) An HCR for stocks that have not been declared overfished, (b) an HCR for stocks that have been declared overfished, illustrating an abrupt discontinuity in allowable fishing mortality, and (c) an HCR that does not have any discontinuities. Note that the diagonal dashed extension of the rule segment in (a) is not used in practice because stocks below MSST are managed under a rebuilding plan.
vides an example of one such highly uncertain decision.3 Status determination for this stock depended on which of two proposed recruitment scenarios was accepted. One scenario involved a reduction in stock productivity since about 1990, leading to an estimate of BMSY= 2,995 metric tons (mt) and to the conclusion that the stock had rebuilt. A much larger BMSY= 22,615 mt, which would imply that the stock was still overfished, was estimated under the alternative recruitment scenario, which attributed the low recent recruitments to the current small size of the spawning stock and predicted higher recruitments for spawning stock biomasses larger than 4,319 metric tons. The Stock Assessment Review Committee (SARC, the external peer-review body in New England and the Mid-Atlantic charged with reviewing benchmark assessments) concluded that the evidence was 60:40 in favor of the productivity change and the stock was reclassified as rebuilt. The Scientific and Statistical Committee (SSC) decided that ABCs and management in general should be based on a change in productivity and that in this case 30 years of low productivity was enough evidence that something differed from the long-term average of the entire time series (approximately 70 years). The justification for lowering the rebuilding target in this case is very weak. As discussed in Chapter 5, this committee found no evidence of a decrease in recruits per unit of spawning biomass for this stock.
_________________
3 54th SAW Assessment Summary Report, http://www.nefsc.noaa.gov/publications/crd/crd1214/crd1214.pdf.
Probability of Meeting Rebuilding Deadlines
Determining the probability of meeting rebuilding deadlines is difficult and subject to much uncertainty because of variability in the ecosystem, the dynamics of the exploited fish populations, the fishery, and the data collected. Stock projections are generally based on the most recent stock assessment, which provides estimates of stock size relative to BMSY (or its proxy), the age structure of the population, mean generation time, productivity, and fishing selectivity parameters, all of which are imprecise. A model of the relationship between spawning stock size and future recruitments is fitted to the historical estimates as part of the stock assessment and is used to project the population forward adopting many of the stochastic realizations, such as those shown in Figure 4.2. Alternatively when model fits are considered unreliable, stochastic simulations are based on re-sampling historical recruitment estimates from a period of time considered applicable to the projection period. A better approach would be to re-sample the recruits per spawners ratio (R/S) because R must be conditional on S regardless of how noisy the data may be.
Most stock assessments and associated projections do not include all of the relevant sources of uncertainty (Punt et al., 2012a). If they include uncertainty at all, then they likely include only those components of variation that can most directly be quantified. Hence, bootstrap or finite-difference approximations are often used to characterize uncertainty in
FIGURE 4.2 (a) Multiple stochastic time-trajectories of biomass relative to BMSY (light lines) and the median of these stochastic projections (solid line) for one example management strategy, (b) the probability of recovery to BMSY for five management strategies, (c) the expected catch for five management strategies, and (d) the fishing intensity for five management strategies. Fishing intensity is measured as the complement of spawning stock biomass-per-recruit (1-Spawning Potential Ratio). The solid lines in (b)-(d) correspond to the management strategy in (a).
the biomass estimates resulting only from variation in the data. Alternatively, Markov Chain Monte Carlo methods can be used to account for uncertainty in key assumed parameters, such as the rate of natural mortality. However, even these methods do not often account for model uncertainty, management uncertainty, or the process uncertainty associated with changes in the environment, the ecosystem, or even the population (see the analysis of Taylor, 2011, for an example of how environmental variables might be considered in the decision-making process). Consequently, the variation shown in projections underestimates the true level of uncertainty, and the expectations associated with rebuilding timelines should therefore be tempered. That being said, quantification of the relative uncertainty of predictions is useful, as is the motivation to decrease the uncertainty of the stock assessment provided by such calculations, for example through improved data collection and model design. Some sources of uncertainty, such as whether recruitment will be better or worse than expected in a specific future year and the form of the stock-recruitment relationship, are more difficult to resolve.
Alternative Approaches to Conducting Assessments and Rebuilding Analyses
Best-Assessment Models
The standard approach used in most regions to adjust catch limits or other management regulations, whether or not a stock is under a rebuilding plan, involves the use of a single best estimate of current or projected stock size. Often a range of stock assessment models of varying levels of complexity or several alternative configurations of a standard stock assessment model are applied, and the best of these is selected using some formal model selection criteria, examination of residuals, or consideration of the relative plausibility of each model as assessed by a review group (Butterworth, 2007).
The most common approach to formulating management advice in the United States involves using a single best model for estimating stock levels, setting biological reference points, assessing stock status, and conducting rebuilding projections. This approach has its advantages. From a practical standpoint, the use of a single model implies that only one set of values of model parameters (and their corresponding measures of uncertainty) is needed to develop projections and evaluate management options. Because many alternative rebuilding management strategies might be explored, the single model greatly simplifies the process of interpreting outputs and reduces the time needed to evaluate scenarios. From a scientific standpoint, the strengths and weaknesses of the selected model become well explored and understood during the vetting process, for example, a SARC, SEDAR (SouthEast Data Assessment and Review), or STAR (Stock Assessment Review) process. Of course, developing and using several approaches (including not only using alternative models, but also systematically tracking various data indices such as trends in CPUEs, sizes at age in surveys and catch, and life history parameters) in an ongoing manner during the assessment process is both recommended and highly informative (NRC, 1998a).
An alternative approach is to use multiple models. In this case, either (1) the outcomes, conditioned on each of the models being valid, are presented to managers separately in a decision table (Walters, 1986; MacCall, 1999) that highlights the relative benefits and risks under the alternative perceived states of nature or (b) the model results are averaged to arrive at a weighted best estimate of the current state of the system and of the weighted performance statistics of evaluated harvesting strategies (e.g., Brodziak and Legault, 2005). Model averaging may create a practical advantage by arriving at a single outcome, which can be agreed upon by an RFMC SSC and then used for RFMC decision making, when there are multiple plausible models and no consensus on the best characterization of the state of nature. This is a common situation, especially when many parties are involved in the science and management decision process. Model averaging can also be advantageous when the models represent a balanced perspective of alternative states of nature and when the uncertainty associated with model choice can be carried forward in an integrated way. In other situations, model averaging may facilitate compromise that allows decision making to move forward when parties cannot agree. However, the averaging process may cause the smoothing over of inconsistent results. Furthermore, model averaging may preclude deeper understanding of the consequences of alternative characterizations of states and natures and identification of the associated risks that is often the result of debate and consensus building, especially if the models under consideration are highly contradictory (Schnute and Hilborn, 1993).
Consideration of multiple models is more likely to reflect the actual uncertainty in the system and to allow for examination of the consequences associated with the various management decisions under the alternative states of nature. This approach was recently used in New England for Gulf of Maine cod (NMFS SARC 55, see also Punt, 2013). However, from a practical standpoint, this approach requires development of simulations for all of the combinations of candidate management actions and possible states of nature. Management actions here refer to decision rules applied consistently over time (as opposed to, for example, single ACLs). Although the multiple model approach has been applied around the United States, the numbers of model combinations and management options can grow rapidly, making delivery of a timely and interpretable set of outcomes challenging.
Management Strategy Evaluations
An alternative to the best-assessment approach is the “management procedure” approach or Management
Strategy Evaluation (MSE), which is increasingly being used to specify management actions for commercially exploited fish and invertebrate populations worldwide (Punt, 2006; Butterworth, 2007). Management procedures are combinations of predefined data used as input to calculate catch quotas (or other regulations), assessment methods or algorithms used to process the data (which may or may not include an assessment model), and harvest control rules. The fundamental difference between the management procedure and best-assessment approaches to setting quotas is that the former uses a fully specified feedback decision rule that has been simulation-tested across a wide range of scenarios and the latter uses a rule to set the quotas in practice that changes whenever best-model assumptions change. In the section on case studies later in this chapter the committee presents two rebuilding plans that were developed using the management procedure approach: those for the New Zealand red rock lobster (Jasus edwardsii) and the southern bluefin tuna (Thunnus maccoyii).
The performance of alternative management procedures is explored using computer simulation under the wide range of population dynamics models available for characterizing populations and ecosystems. These systematic, computer-generated thought experiments allow for testing of management strategies and rebuilding plans (e.g., Punt and Ralston, 2003) before implementation and can be used to identify different paths to achieve a set of management goals. Generally, the model scenarios used in MSE focus on the various sources of scientific and management uncertainty that affect population or ecosystem projections, as well as future catch rates. Conceivably the models and analyses could be extended to address questions of cost-benefit tradeoffs in a socioeconomic context (see, for example, discussions in Chapter 6). Although the NS1G approach to treating scientific and management uncertainty aims to reduce the risk of overfishing occurring, it is unknown whether, and by how much, long-term potential yield is sacrificed. MSE should be used to quantify the likely tradeoff between risk and yield and to help to develop strategies that are robust to the major identified uncertainties while providing fishery benefits in line with specified management objectives and legal mandates.
MSE may identify HCRs or management and associated rebuilding strategies that go beyond and perhaps outperform those formulated under the classical MSY perspective, including simple rules based on trends of abundance indicators or spatial harvesting strategies (e.g., rotation, spatial closures). Management procedures can be divided into those that are “empirical” and those that are “model-based.” Empirical management procedures specify management actions directly from the data collected from the fishery without use of an intervening assessment model (e.g., De Oliveira and Butterworth, 2004). These procedures may simply adjust regulations in response to trends in fishery indicators or they may involve some empirical target or threshold. Model-based management procedures, on the other hand, commonly employ simpler models than those used for standard assessments to facilitate exploration of a variety of management options without greatly increasing the computational burden of the evaluation process. It is generally believed that empirical management procedures are more responsive to rapid changes in monitoring data, but at the expense of higher variation in catches (Butterworth and Punt, 1999; Cox and Kronlund, 2008; Punt et al., 2012b).
A quantitative and rigorous approach to evaluating models and developing robust control rules can be extremely helpful when multiple interpretations of the data are possible and there is no consensus on a single best model. The southern bluefin tuna case study described later in the chapter provides an example of how a lack of scientific consensus and a management impasse was resolved by incorporating multiple models into evaluation of alternative rebuilding strategies. There are, however, some caveats associated with the analyses and models that form the basis of the MSE approach. First, these analyses can be computer- and time-intensive. Second, although the objective is to identify a fully specified decision rule to calculate the harvest controls (e.g., the ACL) directly from new and historical data, the approach should always be coupled with ongoing monitoring and periodic in-depth stock assessments to ensure that observed trends are within the range of possibilities considered in the simulations (Butterworth, 2008).
Interim Reviews/Monitoring/Assessments and Adaptive Management Options
Rebuilding plans must be reviewed at least every other year. A wide range of interpretations exists for what constitutes review of a rebuilding plan. The review can range from comparing catches expected under the rebuilding plan with those actually taking place, to reviewing and updating stock assessments, which might result in updated estimates of BMSY (or its proxy) and consequently a reevaluation of stock status relative to BMSY. Thus, the evaluated status of the stock may change for a variety of reasons that have little to do with changes in the ecological condition of the stock. The frequency with which stock assessments are updated sets the pace for all adaptive management decisions, including possible corrective actions to management arrangements. However, the frequency of assessments, and the associated peer-review process whereby the analyses and assessment results are vetted in an open forum, differ markedly across regions. In the North Pacific, assessments for many of the major species are performed on an annual basis (e.g., hake, sablefish, yelloweye rockfish), with SSC peer review and more in-depth peer reviews only conducted when there is a significant change in the data or models. In New England, benchmark assessments are often done on a 3- to 4-year cycle with full peer review, but updated assessments typically have not been provided during the interim period until recently.
FIGURE 4.3 Spawning stock biomass (SSB) of Georges Bank cod projected from a series of retrospective stock assessments (terminal years 2000 through 2006).
NOTES: Analysis conducted by the New England Groundfish Augmented Plan Development Team to evaluate performance of projections by comparing the distribution of projections from each retrospective model (shown using different colors) to the estimates from the 2007 assessment (red line), taken as “the truth. (Details of the simulation analyses are provided at http://www.nefmc.org/tech/cte_mtg_docs/120824/a_110802_APDT_report.pdf.) The upper and lower limits are the 5th and 95th percentiles of the bootstrapped projections. A line connects the terminal year model estimate from each retrospective assessment (indicated by a dot) with the median value of the bootstraps in the following year.
SOURCE: Liz Brook, personal communication.
When assessments are not updated every year, the ABCs are calculated based on model projections from the terminal year of the last stock assessment conducted. The uncertainty around projected stock sizes increases with the number of years projected, which contributes to implementation errors. Furthermore, infrequent assessments and the resultant reliance on longer projections to set the ABCs tend to amplify the impact of the estimation errors in cases of severe retrospective patterns (see Chapter 3). Simulation analyses conducted by the New England Groundfish Augmented Plan Development Team4 indicate that the magnitude of the retrospective bias (i.e., the difference between the projected mean and most current stock size estimate for a given year) tends to increase with the number of years projected (Figure 4.3). The process that defines the frequency and use of New England stock assessments is currently under review. The NEFMC will likely modify the process in the next few years to create a two-tiered approach associated with a timelier process for identifying and providing benchmark and update assessments. Part of the difference between regions is historical, but part is circumstantial. Some regions show greater biological productivity and others greater species diversity. Some regions have higher human population concentrations near their shores and consequently exhibit greater human impact and influence. Programmatically, the number of assessment scientists relative to the number of stocks that are regularly assessed varies by region, although a shortage of human resources limits the capacity to fully carry out the needed analyses in all regions. Some regions are more subject to litigation, indicating that assessments are more contentious in some regions (thus the review processes are more onerous and involved). In addition, fisheries in some regions are so diverse, so spread out, and so data limited, that conducting an assessment at all is nearly impossible. All of these factors, of course, affect how stock status is evaluated and
_________________
4 Details of the simulation analyses are provided at http://www.nefmc.org/tech/cte_mtg_docs/120824/a_110802_APDT_report.pdf.
reevaluated, how benchmarks and thresholds are specified and updated, and the timeliness with which management actions are reexamined.
Results from updated stock assessments are compared with projections to evaluate progress toward rebuilding targets and thus to guide adaptive management decisions. However, as mentioned earlier, rebuilding fishing mortality rates are only expected to occur within the selected time frame 50% of the time. A particular stock may not rebuild at the expected rate even if fishing mortality has decreased by the appropriate amount. The methods for evaluating stock status do not change because, for example, recruitment may be lower than projected in the rebuilding analysis (e.g., Georges Bank yellowtail flounder). The uncertainty in these systems is great, and although a biomass target and the evaluation of a range of rebuilding timelines are essential to formulating options and to planning, once a specified timeline is chosen, the outcome will be variable and rebuilding may be faster or slower than expected. Attempting to adjust the FACL to achieve rebuilding by the specified timeline will meet with decreasing flexibility as TTARGET approaches. In the extreme (e.g., the case of Southern New England/Mid-Atlantic winter flounder), rebuilding may not be achievable even by setting FACL to zero. The PFMC has agreed to conduct an MSE to evaluate alternative rules for revising rebuilding plans.
Mixed-Stock Fisheries
Fish species do not live in isolation; they represent components of a community that exhibits a range of interactions and varying degrees of overlap in space and time. The influence of ecosystem biological interactions on the exploited populations and their fisheries are discussed in Chapter 5. Here we highlight some of the technical issues associated with what is often referred to as “technical interaction.” Sparre and Venema (1998) define three types of interactions that exist in a multi-species, multi-fleet system. Biological interactions are between fish stocks and other biological components of the system. Economic interactions are between fleets (e.g., competition). Technical interactions refer to situations in which fishing mortality occurs in one stock when fishing occurs in another,5 which may be due to several fish species being harvested together (true multi-species fishery) or fish being caught incidentally as bycatch. Data collection, assessment science, determination of biological reference points, and regulation and management can become much more complicated when technical interactions exist, especially in the context of single-species approaches to assessment and management, which is the current dominant paradigm. The impact of technical interactions involving overfished and rebuilding stocks has led to losses in yield for healthy stocks, because the mixed stock exception as it has been written has not been invoked. This loss in yield is expected because FMSY is a limit reference point, but it is exacerbated when unproductive stocks are placed under rebuilding plans. For example, the valuable sea scallop (Placopecten magellanicus) fishery is closed when the bycatch of yellowtail flounder (Limanda ferruginea) exceeds the TAC of yellowtail flounder (see Gedamke et al., 2005, for an example).
Obviously, the mixed-stock problem has implications for those less productive or more vulnerable stocks as well, because an F that is reasonable for the targeted stock may cause fishing mortalities in excess of FMSY for the bycaught species (several examples are provided by Milazzo, 2012, in the context of rebuilding). Although efforts are perennially made to modify gear to avoid or allow escapement of nontarget species as well as to identify and close areas that will act as spatial refugia or to create bycatch hot-spot maps, as is often done with industry participation to avoid premature closures, there will always remain the unintended removal of certain nontarget species.
Time and area closures based on the overlap in distribution of the different stocks and the biology of the species in question, as well as gear and behavior modifications (Dunn et al., 2013), could be used to keep F below FMSY for all species. However, even use of these techniques may not achieve this goal without reducing F for most species in a multi-species fishery to well below target levels. If using FMSY as a limit reference point for all species in a mixed-stock fishery is problematic (i.e., results in too much loss of yield and subsequent loss of social and economic benefits), then what alternatives might be considered? Essentially, it is necessary to consider the risks associated with fishing some stocks above FMSY. Higher levels of fishing mortality may be allowed over some time periods or in some areas only. At the extreme, the F that drives a component population to threatened or endangered status (referred to here as FTHREAT) would clearly be undesirable and ultimately unacceptable under the U.S. Endangered Species Act. However, to make the mixed-stock exception operational, it may be useful to consider F values intermediate to FMSY and FTHREAT. For example, a reasonable upper limit on F might be FMSST, the F that corresponds to the overfished threshold at a theoretical equilibrium, even though fishing at this level will increase the likelihood of stocks becoming overfished.
It would be necessary to use ecosystem modeling (Latour et al., 2003) and MSE (Ives et al., 2013) to evaluate the concomitant gains and risks associated with alternative harvest strategies, considering the fishery as a whole (i.e., the tradeoffs between risks and increase in fishing opportunities associated with not having to reduce F to FMSY for all stocks). One strategy could be to identify “major target” species for which F should remain below FMSY (or which need to be rebuilt within a given period) and, within this context, to
_________________
5 Here one might distinguish between technical interactions that are really due to technical issues and those that appear to be technical interactions but can be minimized by changes in fishing behavior. See, for example, the SeaState program in Alaska that makes use of behavioral changes to reduce what might have been considered a technical interaction.
identify the benefits of allowing F to exceed FMSY for “non-major” stocks. This approach to mixed-stock fisheries could also be applied to rebuilding non-major stocks; the time to rebuild such stocks (or whether the stocks are rebuilt to MSST or all the way to BMSY) could be adjusted given the estimated impacts on fisheries for major stocks.
The consequences of applying single-species harvest strategies to multi-species fisheries are well established (e.g., Clark, 1990, and references therein). It could be argued that most fisheries operate in a multi-species setting. The move toward Ecosystem Based Fisheries Management (e.g., Pikitch et al., 2004) will certainly cause scientists and managers to be confronted more often by this issue. For example, the use of multi-species production or age-structured models often gives rise to exploitation rates that are applicable to species complexes or even entire ecosystems (Mueter and Megrey, 2006). Implicit in these situations is the differential rate of exploitation across individual species within the complex, which will need to be addressed biologically and in the context of the law. In any event, some mechanism for monitoring the status of the less productive components of mixed-species complexes must be established. Much of this discussion on multi-species fisheries applies equally to multiple stocks of a single species. The challenge here of course is presented by the added complexity of identification of substocks within a species. More generally, it is recognized that the tradeoffs in managing mixed stocks are not easily addressed. A concern is that a management structure that allows F to exceed FMSY for some system components, even if restricted to limited areas or time periods, could easily be abused. However, the mixed-stock issue is one that needs focused attention and careful consideration in order to increase net benefits from fisheries.
Data-Poor and Knowledge-Limited Stocks
The 2006 amendments to the MSFCMA are most readily implemented in the context of data-rich stocks, for which reliable catch and survey information are available and quantitative stock assessments can be conducted. Fortunately, a great majority of the nation’s most valuable fisheries, the focus of much of this report, have sufficient information for developing MSY-based control rules, which have proven effective for rebuilding some overfished stocks and for ending overfishing (Chapter 3).
The directives of the MSFCMA, however, must also be applied to stocks for which there is little or no information available, which is problematic. In the context of the MSFCMA, “data-poor” stocks are defined as those for which reliable MSY-based reference levels are unavailable. However, the limitations on data and knowledge vary widely both within and among management regions. What is considered data-poor in Alaska could be considered data-rich in the Caribbean. The nature of this variability and how RFMCs are dealing with it will be discussed in this section.
There are many data-limited stocks, for which it is unrealistic to calculate an annual catch with a specified probability of preventing overfishing. A variety of ad hoc methods have been developed, but their performance is largely unevaluated and it unknown whether they are more or less precautionary than strategies applied for stocks where probabilistic modeling is possible. It would be contrary to the precautionary approach if less data and scientific information resulted in a higher catch being acceptable.
Some stocks are truly data limited, and no attempt at an analytical assessment can be made. For other stocks, information may be available, but the assessments are not reliable because of lack of contrast in the data, inconsistencies in the findings, or biases in the resulting estimates (e.g., silver hake in New England). Such stocks might be considered “knowledge-limited,” because data exist for these stocks, but the information is spotty or inconsistent. Even the situation discussed above in which decision makers are faced with multiple plausible models might also be viewed as being knowledge-limited. The MSY-oriented components of the NS1G are difficult to apply in both data-limited and knowledge-limited situations, but this is seldom acknowledged (Adkison, 2007). In reality, all stock assessments are knowledge-limited to some degree, and therefore it is more appropriate to consider fish stocks on a continuum of data and knowledge availability, from almost no information at one extreme to high-quality data and knowledge at the other (Figure 4.4). The suitability of different management approaches depends in part on where the stocks and fisheries lie on this continuum.
When rich sources of data and knowledge are available (e.g., many of the high-value stocks in Alaska), annually updated stock assessments are the norm, which are typically based on long-term catch histories and survey data, resulting in relatively accurate biological production estimates and allowing for the evaluation of projections under various management scenarios. Focus on these high-valued stocks is understandable but has led to unintended consequences for smaller, data-limited stocks.
At the low end of the continuum in Figure 4.4, stocks are typically smaller in scale and value (e.g., many of those in the Caribbean) and are assessed with less frequency and rigor, or have never been assessed at all. However, many of the lower-valued stocks contribute importantly to the ecosystem (e.g., forage fish) or as components of multi-species fisheries (e.g., a coral reef fishery). Most coral reef fisheries coincide with areas of high biodiversity (e.g., the Caribbean), where fishermen typically do not venture far from their local ports and target many different species simultaneously. In these small-scale, multi-species fisheries, local socioeconomic conditions may depend more on overall ecosystem health than on any individual species or stock (Cinner et al., 2011). In data-poor situations, therefore, it may be more appropriate to consider other scientifically sound paradigms for assessment and management that incorporate socioeconomic and
FIGURE 4.4 Conceptual diagram showing where stocks lie on three theoretical gradients: data availability (often inversely correlated with uncertainty), individual stock value (ex-vessel landings), and the relative applicability of current MSY-based control rules for rebuilding.
ecosystem considerations holistically in selecting control rules and for judging the success of rebuilding (see below).
Problems of data-poor fisheries are not insignificant in scope. More than half of the stocks or stock complexes managed in the United States have overfishing thresholds that are not defined or not applicable, or their overfishing status is unknown (NMFS, 2012). Data limitation is potentially solvable. Indeed, Restrepo et al. (1998) recommended that a first priority should be to gather the data needed to bring a stock and its assessment up to data-moderate levels. However, this solution may not be realistic in many situations because of costs or difficulties in sampling small-scale fishing operations. In contrast, knowledge limitation, such as inconclusive assessments or systematic biases, may or may not be solvable by collecting more data.
The next section of the report focuses on the methods and frameworks used in rebuilding plans to manage data-poor stocks within the context of the MSFCMA. Some of these methods allow for determination of MSY-based control rules and ACLs without analytical stock assessments. For stocks lowest on the data-poor spectrum, alternative paradigms might be more appropriate (Bentley and Stokes, 2009).
Methods for Developing Rebuilding Plans for Data-Poor Fisheries
Conceptually, Honey et al. (2010) defined data-poor methods as those that could be used to develop qualitative or quantitative control rules, without the guidance of a full stock assessment. There are several recent reviews of data-poor approaches and methods (e.g., Restrepo et al., 1998; Maunder et al., 2006; McCall et al., 2009; Honey et al., 2010; Berkson et al., 2011; Dorn et al., 2011; McGillard et al., 2011; Punt et al., 2011; Brodziak et al., 2012; ICES, 2012). Berkson et al. (2011) offer a tiered approach to setting ABCs based on a gradient of information availability, as well as a variety of methods for various tiers. Control rules within FMPs (e.g., Table 4.2, which illustrates the tiered system for overfished limits [OFLS]) are used by the South Atlantic FMC.
The problem of data-limited stocks is potentially complicated by the requirement for accountability measures, which is particularly problematic for fisheries for which there is a substantial lag in the availability of catch information such that within-year closure of the fishery is not feasible (e.g., many recreational fisheries). The catch may exceed the ACL if the stock size is larger than anticipated when the ACL was set. In this case, accountability measures, such
TABLE 4.2 Tiers of Stocks as Used to Define OFLs and ABCs for Stocks with Various Levels of Data and/or Knowledge Limitations
|
|
|
| Tier 1 | Assessed stocks: Whenever possible, ABC recommendations should conform to an ABC control rule that is based on the probability of overfishing (i.e., P∗ approach). |
| Tier 2 | Depletion-based stock reduction analysis (DB-SRA): If the information necessary to implement the RMFC’s approved ABC control rule is not available (e.g., MSY reference points, projected stock size, distribution of OFL, etc.), then the basis of the ABC should be explicit about what aspects of the derivation were based on expert judgment. |
|
—Requires full history of landings and other life history information for the stock. |
|
|
—Gives a probability distribution function of OFL. Could apply P∗ or other risk/p level to derive ABC. |
|
| Tier 3 | Depletion-corrected average catch (DCAC) (MacCall, 2009): If components of the ABC control rule cannot be provided, then a provisional ABC should be based on alternative approaches, but deviation from the control rule should be justified. |
|
—Requires less data than Tier 2. |
|
|
—Provides provisional sustainable catch. |
|
| Tier 4 | Catch data only: Difficult to prescribe. |
|
—Requires judgment and careful consideration of all available sources, which may vary greatly between stocks falling in this tier. |
|
|
|
|
SOURCE: SAFMC, 2011a.
as reducing the ACL the next year or closing more areas to fishing (as proposed for the Caribbean), result in a reduction in fishing mortality and stock growth and greater likelihood of exceeding the ACL again, triggering more accountability measures. Ironically, if stock size is smaller than anticipated, then the ACL is less likely to be exceeded and a catch limit that is too high is likely to be maintained. Applying accountability measures without ascertaining the reason why an ACL is exceeded is potentially destabilizing, particularly for data-limited stocks.
Conceivably, other forms of fishery management (e.g., Marine Protected Areas or effort limits) that are more robust to uncertainty could be recommended, but the NS1G interpret the MSFCMA as requiring an annual catch limit except under limited circumstances.
Alternative Paradigms
In many cases, data and knowledge are too limited to develop robust MSY control rules and achieve the NS1G requirements. A recent SEDAR data evaluation review, for example, concluded that “despite several attempts, no acceptable quantitative assessments have been developed for Caribbean stocks because data to support traditional stock assessment methods simply do not exist for the species considered so far” (SEDAR, 2009, p. 3).
Often the response to managing stocks without quantitative stock assessments is to invoke the precautionary approach (FAO, 2005). This approach includes developing management measures that incorporate ecosystem-level and space-time-based harvest controls such as Marine Protected Areas (MPAs), designed to protect essential habitat (i.e., breeding, nursery, and feeding grounds) by excluding anthropogenic impacts at critical places and times. The value of MPAs depends in part on the value of the protected habitat. In the Caribbean, multi-species spawning aggregations for large predatory reef fishes (e.g., groupers and snappers) occur along shelf edges and reef promontories, particularly in association with vertical structures (Koenig et al., 2000; Coleman et al., 2011; Heyman and Wright, 2011; Kobara et al., 2013). Such sites have been protected as part of an alternative strategy to rebuild overfished grouper and snapper stocks in the Caribbean and the South Atlantic (see case studies below).
Without data, however, it is nearly impossible to monitor or evaluate the outcomes of some of these rebuilding efforts. Biomass usually increases within well-enforced MPAs (e.g., Aburto-Oropeza et al., 2011), and MPAs can contribute to local fish populations through emigration and larval export (Harrison et al., 2012). However, the overall effect of MPAs on rebuilding entire stocks is difficult to assess. The relationship between MPAs and stock rebuilding represents an important area for future research.
Although management measures contained in the 2006 reauthorization of the MSFCMA primarily rely on output controls (i.e., ACLs, TACs), an alternative approach uses input control rules (e.g., effort controls), iteratively and adaptively, as stocks increase or decrease. Another approach to managing and monitoring fisheries without the need for full stock assessments involves the use of marine reserves as “reference” ecosystems, where unfished biomass and age structure can be compared to exploited portions of stocks. In addition, density-ratio control rules have been proposed as a way to use comparisons between biomass within marine reserves versus biomass outside reserves to develop control rules (Babcock and McCall, 2011; McGillard et al., 2011). However, these control rules have not been applied in practice.
Challenges and Unintended Consequences to Implementing the MSY Paradigm
MSY-based biological reference points present conceptually reasonable management thresholds for information-rich stocks. Empirical evidence on directional changes or responses of such stocks to fisheries management actions is generally consistent with conventional fisheries models. However, the focus on highly defined reference point estimates often overstates the degree of accuracy with which the stocks can be assessed. This uncertainty increases particularly for less-valued and less-studied stocks (Figure 4.4). Stocks interact with each other and with other components of the ecosystem (see Chapter 5), which leads to several scientific and technical challenges that should be considered. Although needed, an ecosystem focus that incorporates these interactions will present challenges (see Chapter 5).
The problem of data-poor stocks potentially complicates the problem of mixed stocks. Less abundant stocks that exhibit lower productivity and limit the catch of more abundant stocks with a higher potential yield and greater value are often data-limited (e.g., ocean pout in New England). Although technical and biological interactions generally make the simultaneous achievement of MSY for all stocks in a fishery improbable, the presence of stocks under rebuilding plans is likely to exacerbate this constraint on fishing (see also Chapters 2, 5, and 6). These interactions can lead to a refocusing of priorities to stocks that have received less attention in the past and to ecosystem-based approaches to fisheries management. Thus, the benefits from investing in data collection and research on stocks of high economic value and high potential yield may be offset by uncertainty in the assessments of these less abundant stocks.
Case Studies
Canary Rockfish
Canary rockfish (Sebastes pinniger) has been exploited off the U.S. West Coast extensively since WW II because of increased demand for protein at that time. More recently,
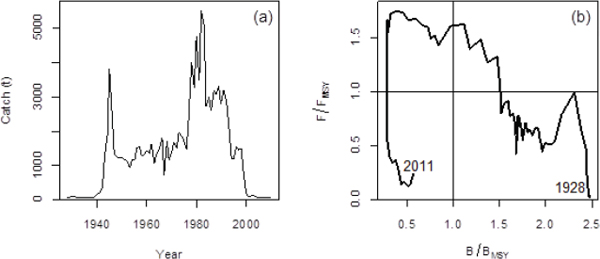
FIGURE 4.5 Annual catches of canary rockfish (a) and a phase plot representing changes in the status of the canary rockfish fishery with time with respect to realized fishing mortality and biomass (b).
canary rockfish has been caught in most commercial and recreational groundfish fisheries over the entire U.S. West Coast and is taken as bycatch of fisheries targeting other species. The proxy for BMSY for this stock was set to 40% of B0 as stipulated by the PFMC SSC. MSST, which is 25% of B0 for groundfish stocks, is hence 62.5% of BMSY. The stock was declared overfished by the National Marine Fisheries Service (NMFS) in January 2000 after stock assessments for the populations north and south of 40°10’N found that the spawning biomass was below MSST (Crone et al., 1999; Williams et al., 1999) (Figure 4.5a). A rebuilding plan for canary rockfish was adopted by the PFMC based on a rebuilding analysis that was parameterized using the results of the 2002 assessment, which treated the resource as a single coast-wide population (Methot and Piner, 2002). The PFMC chose a probability of recovery to the proxy for BMSY of 60% by TMAX=2076 and hence chose a harvest strategy with a fishing mortality rate of 0.022 yr-1, corresponding to 0.36 FMSY. This schedule resulted in a target year for rebuilding of 2074. The management measures selected to limit catches of canary rockfish included reducing landing limits on co-occurring species, establishing extensive time/area closures, and restricting the use of trawl nets equipped with large footropes (PFMC, 2011b). Bag limits and, if necessary closed areas, have been used to limit catches in recreational fisheries. Management measures implemented prior to the adoption of the rebuilding plan led to a large reduction in the catch of canary rockfish (from 899 tons in 1999 to 200 tons in 2000; Wallace and Cope, 2011; Figure 4.4b).
The assessments after 2002 have been based on essentially the same specifications. Nevertheless, changes and additions to the data have led to changes to the estimates of B0, BMSY, current biomass, and consequently rebuilding parameters (Table 4.3). For example, the estimate of B0 and hence the proxy for BMSY has changed over the past four assessments, ranging from 35,600 mt from the 2007 assessment to 26,000 mt from the 2009 assessment (Table 4.3). The phase-plot is relatively consistent over assessments (Figure 4.6), although there are noteworthy changes in how much below BMSY the stock was depleted. All four stock assessments exhibited an inverse relationship between F and B, even after the stock dropped below BMSY. The harvest strategy adopted by the PFMC in 2006 (Amendment 16-4 to the Groundfish Management Plan) had a TTARGET of 2063. Even though the target exploitation rate (SPRTARGET in Table 4.3) has not changed, the change to quantities such as B0 has led to a reduction in TMIN (from 2048 to 2027) and TTARGET (from 2063 to 2030) based on the most recent (2011) assessment.
New Zealand Rock Lobster
Spiny red rock lobster stocks off New Zealand are managed in 10 quota management areas (Figure 4.7). The management advice for four of these management areas (CRA3, CRA4, CRA7, and CRA8) is based on the application of management procedures, while management advice for two other stocks (CRA1 and CRA2) is based on the results of stock assessments and projections. A management procedure is currently under development for rock lobster in management area CRA5. The management procedure for rock lobster in CRA7 and CRA8 was developed when the stocks in these management areas were assessed to be depleted to below the target level. Starr et al. (1997) conducted the first comparison of alternative management procedures when the stocks in these management areas were assessed to be one-third of BMSY. The original management procedure adjusted the catch limit depending on how well catch rate compared to
TABLE 4.3 Changes Over Time in Rebuilding Parameters for Canary Rockfish
| Parameter | 2006 Amendment 16-4 | 2007 Rebuilding Analysis | 2009 Rebuilding Analysis | 2011 Rebuilding Analysis |
| B0 (mt) | 34,155 | 32,561 | 25,993 | 27,846 |
| Stock-recruitment steepnessa | 0.511 | 0.511 | 0.511 | |
| BMSY proxy | 13,662 | 13,024 | 10,397 | 11,138 |
| B2007 (mt) | 10,544 | |||
| B2009 (mt) | 6,170 | |||
| B2009 (mt) | 6,459 | |||
| TMIN | 2048 | 2019 | 2024 | 2027 |
| Mean generation time | 23 | 22 | 22 | 23 |
| TMAX | 2071 | 2041 | 2046 | 2050 |
| TTARGET | 2063 | 2021 | 2027 | 2030 |
| SPRTARGET | 88.7% | 88.7% | 88.7% | 88.7% |
a Fixed rather than estimated.
SOURCE: Stewart, 2009; Wallace, 2011.
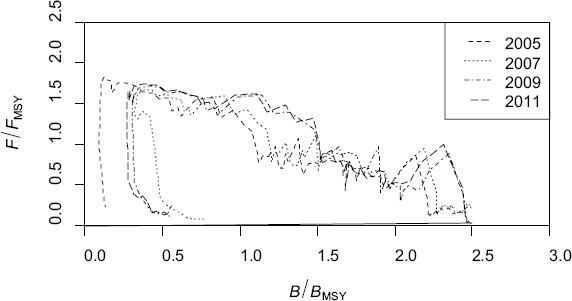
FIGURE 4.6 Changes in the phase plot for canary rockfish with new assessments over time.
that expected under a rebuilding strategy. This management procedure has been refined several times, most recently during 2007 (New Zealand Ministry of Fisheries, 2011a), when separate management procedures were developed for these two management areas (previously a single management procedure was applied to both areas). The management procedures for CRA7 and CRA8 involve determining the TAC for a year based on the catch rate for the previous year when the function relating the catch rate to the TAC is piecewise linear (New Zealand Ministry of Fisheries, 2011a).
The management procedures for rock lobster stocks off New Zealand do not explicitly include estimates of biomass or BMSY. Rather, they are based on catch rate relative to desired levels. This is most obviously the case for the current management procedure for CRA4, which sets the TAC proportional to the current catch rate divided by a target catch rate raised to the power 1.4, which was chosen to achieve a reasonable tradeoff between risk and catch. The management procedures are constructed with the intent to rebuild stocks that are below target levels, but there is no pre-specified rate of recovery or time to recovery. The management procedures include maximum allowable levels of change in the TAC as well as the minimum level of change in the TAC from the management procedure that will lead to a change in actual
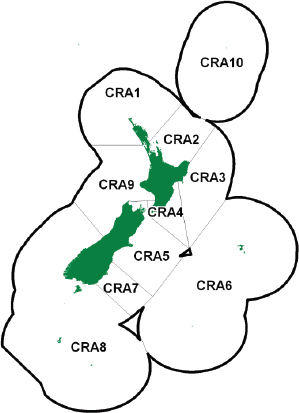
FIGURE 4.7 Management areas for spiny red rock lobster off New Zealand. SOURCE: Ministry for Primary Industries (2012). Fisheries Assessment Plenary, November 2012: stock assessments and yield estimates. Compiled by the Fisheries Science Group, Ministry for Primary Industries, Wellington, New Zealand. 531 p., available at http://fs.fish.govt.nz/.
TAC (i.e., a recommended change in TAC of 1% will be ignored). The constraints are imposed to increase stability and avoid disruption of the fishing industry. The management procedures implemented for CRA7 and CRA8 have been successful at allowing the stocks to recover (as indicated by trends in catch rate), but it is not clear whether the stocks are at BMSY.
Southern Bluefin Tuna
Management of southern bluefin tuna (SBT) epitomizes the challenges faced by regional organizations charged with regulation of international high-seas fisheries. SBT is a highly priced, large, long-lived and late-maturing temperate tuna species, distributed throughout the southern hemisphere mainly in waters between 30°S and 50°S, but only rarely in the eastern Pacific. The fishery for SBT expanded rapidly during the late 1950s, reaching 80,000 mt in the early 1960s. Heavy fishing led to a continued decline of the spawning stock biomass, now estimated to be at about 5% of its unfished level (Figure 4.8) (CCSBT, 2011). During the 1980s, Australia, Japan, and New Zealand—the main fishing nations at the time—voluntarily agreed to substantially reduce catches. This trilateral agreement was later formalized with the creation of the Commission for the Conservation of Southern Bluefin Tuna (CCSBT) in 1994. Korea, Taiwan, and Indonesia, the other principal fishing nations for SBT, became members in 2001, 2002, and 2008, respectively.
Although further stock declines were halted after the CCSBT was established, the spawning stock did not recover, and the CCSBT could not control the expansion of catches by non-members during the 1990s. Highly contentious assessments and widely diverging views among member countries about future prospects for the stock, and the need for further quota reductions, resulted in the lack of official adoption of TACs and “management paralysis.” The impasse culminated in international litigation in 1999 over a proposal for experimental fishing (Polacheck, 2002).
The scientific advisory process was restructured in 2000, and the CCSBT approved a multi-year plan to design a management procedure to rebuild the stock. During this process, member scientists proposed candidate rules for setting ACL that were then tested with the same simulation models and data according to pre-agreed testing rules. Design completion took 4 years, but allegations of substantial underreporting of historical catches in 2005 forced reconsideration of the models on which testing was based. The CCSBT agreed to reduce the TAC by almost 26%, and new measures were put in place to control catches. A second round of testing culminated in 2011 with the CCSBT’s adoption of the “Bali management procedure” to guide the setting of the global SBT TAC for 2012 and beyond. According to the assessment conducted in 2011, the outlook for the SBT stock is positive, given that fishing mortality has been reduced to below FMSY (CCSBT, 2011) and a management procedure designed to adjust TACs in response to future indicators of stock status has been adopted.
The decision to design a management procedure changed the nature of the scientific debate. It redirected scientists’ attention from irreconcilable arguments about what constituted the “best stock assessment” to discussion of testing protocols and hypotheses to include in stock projections. The approach involved the selection of a weighted set of operating models deemed to represent the most important uncertainties. In its most current version,6 this so-called “reference set” is composed of 320 models, which represent alternative hypotheses about (a) the population dynamics (e.g., productivity of the stock-recruitment relationship, natural mortality parameters), (b) interpretations of the fishery data (e.g., CPUE), and (c) the level of underreporting of historical catches and its impact on longline CPUE. A wide range of harvest control rules were evaluated using the reference set and a series of “robustness tests” representing hypothetical situations and worst-case scenarios (e.g., recruitment failure, regime shifts, etc.). Some candidate management procedures
_________________
6 Details of the models are provided in the Report of the Sixteenth Meeting of the Scientific Committee (CCSBT, 2011).
FIGURE 4.8 Distribution of historical and projected spawning stock biomass of southern bluefin tuna predicted with a reference set of population dynamics models with total allowable catches for 2012 and beyond set by the management procedure adopted by the CCSBT.
NOTE: Horizontal line shows the interim rebuilding target to be achieved by 2035 with a 70% probability.
were based on empirical rules that adjusted catch limits as a function of trends in longline CPUE and estimates from an aerial survey used to index recruitment; others involved population dynamics models fitted to the same data. The adopted Bali procedure uses a simple population model and was designed to respond to trends in estimated biomass and to how far biomass and recruitment are from selected respective thresholds (CCSBT, 2011).7
The management goals initially established by the CCSBT included restoration of the spawning stock biomass to the 1980 level by 2020, which proved to be unrealistic in the light of simulation results. Because of uncertainties about long-term future SBT dynamics, the CCSBT opted for an interim rebuilding target of 20% of the unfished spawning biomass (SSB0) to be achieved in the medium term. BMSY, which is estimated to occur at 0.24 SSB0 (95% confidence interval is 0.15-0.31 of SSB0) is still a long-term rebuilding target (CCSBT, 2009). Parameters of a selected subset of candidate management procedures were adjusted to meet the interim rebuilding target at a range of time frames and with different probabilities, as specified by the CCSBT. Also, the changes in TACs in each update were constrained so that they did not exceed certain values. Tradeoffs between several performance statistics related to trends in catches (expected catches and year-to-year variability) and risks to the stock were quantified, and the Bali procedure was recommended as “the winner.” Finally, the CCSBT selected 2035 as the target year for rebuilding to the interim biomass target with a 70% probability. This time frame is a bit less than the minimum time for rebuilding this stock with 50% probability (~10 years, according to zero-catch projections based on the reference set) plus the mean generation time, which is close to 17 years.
In addition to the Bali procedure, the CCSBT adopted a set of meta-rules to determine whether circumstances that fall out of the bounds considered in the testing scenarios have arisen, or whether new information has become available, that merit re-evaluation of performance. This is critically important because, despite efforts to incorporate a realistic range of uncertainties in the models, surprises often happen. The meta-rules allow management to continue to operate while alternative courses of action are evaluated.
Speckled Hind and Warsaw Grouper in the South Atlantic Region
The NMFS presently considers speckled hind (SH), Epinephelus drummondhayi, and Warsaw grouper (WG), Epinephelus nigritus, as undergoing overfishing, but their status with respect to biomass is unknown. They are listed by the National Oceanic and Atmospheric Administration (NOAA) as Species of Concern, by the American Fisheries Society as endangered, and by the International Union for
_________________
7 Technical specifications of the Bali procedure are available at http://www.ccsbt.org/userfiles/file/docs_english/general/MP_Specifications.pdf.
FIGURE 4.9 Distribution ranges for speckled hind (top right) and Warsaw grouper (bottom right) are centered within the jurisdiction of the SAFMC (left) but both species are shared by other RFMC jurisdictions.
SOURCE: Images are from FishBase, http://www.fishbase.org/home.htm, 2011; SAFMC, 2011b.
Conservation of Nature as critically endangered. These species range within, but extend beyond the jurisdiction of, the South Atlantic Fishery Management Council (SAFMC). SH falls under at least two RFMC jurisdictions, and WG falls under the Caribbean, Mid-Atlantic, Gulf of Mexico RFMC jurisdictions (Figure 4.9).
SH once supported important commercial and recreational fisheries in the Southeastern United States, but in spite of various regulatory measures its abundance has declined and overfishing continues (Ziskin et al., 2011). Commercial landings peaked in the South Atlantic in 1984 at 14.8 mt (NMFS data) but have dwindled to less than 1 mt since 1995.
The Snapper Grouper FMP (SAFMC, 1983) was the first ever FMP for the Southeast region. In this data-poor situation, the SAFMC took a holistic, ecosystem-based approach and considered the snapper grouper complex as a mixed-stock fishery for species that shared general habitat requirements and life history characteristics and that were largely harvested by the same fishermen using a limited set of gears.
An assessment of snapper and grouper stocks (Huntsman et al., 1991) revealed that overfishing was occurring for both species, which triggered a regulatory response and the development of rebuilding plans. Amendment 6 to the FMP prohibited sale of SH and WG and established commercial and recreational trip limits at one fish/vessel for these species (SAFMC, 1993). Amendment 10 established Essential Fishery Habitat and Habitats of Particular Concern (EFH and EFH-HAPC) for the snapper grouper complex in the South Atlantic region (SAFMC, 1998). Amendment 11 (SAFMC, 1999) established MSY proxies between 30% and 50% static SPR (Spawning Potential Ratio) for all species in the complex. Rebuilding time frames for all overfished groupers were set at <15 years (year 1=1991). SH and WG were assessed as being overfished with static SPR=8-13% and 6-14% for SH and WG, respectively.
Commercial sales of SH and WG were prohibited in 1994, and the snapper grouper fishery became limited entry in 1998, but stocks continued to decline reported below. In response to continuing concern regarding the overfishing status of SH and WG, and to promote rebuilding of other exploited deep-water snapper grouper stocks, SAFMC established a network of eight MPAs in Amendment 14 to the Snapper Grouper FMP (SAFMC, 2007) to aid “in the recovery of overfished stocks and to ensure the persistence of healthy fish stocks, fisheries, and associated habitats.” In addition, the SAFMC enacted Amendment 17B (SAFMC, 2010), which set the ACL for SH and WG to zero and prohibited fishing for certain snapper grouper stocks deeper than 73 m throughout the southeast region. The closure, dubbed the “240-foot closure,” had significant negative socioeconomic consequences and triggered a backlash from commercial
and recreational fishermen. The closure was based on a misunderstanding of the habitat for these two species. If the SAFMC has consulted with SH and WG fisherman, then it would have learned that the species were often encountered in waters shallower than 240 feet. The SAFMC, however, based its assessment on reports about other commercially important snapper grouper species, which are not considered overfished and commonly exist in waters deeper than 240 feet. In 2012, after intense pressure from the fishing community, the SAFMC enacted Regulatory Amendment 11 (SAFMC, 2012b), which repealed the 240-foot closure.
In parallel, the SAFMC also developed a Fishery Ecosystem Plan for the South Atlantic region (SAFMC, 2009), which was later amended to allow FMPs “to respond to ecosystem issues that may go across fisheries as opposed to single species management for these issues” (SAFMC, 2011b). Furthermore, the plan amended the SG FMP to designate new EFHs and HAPCs in the South Atlantic.
Most recently, the SAFMC brought together an MPA Expert Workgroup to evaluate the existing MPAs as well as to propose new reserves that were likely to provide protection for SH and WG. The participants included patriarch commercial fishermen as well as scientists with expertise on spawning aggregations. The group proposed some reconfigurations and several new reserves along the continental shelf edge, designed to protect spawning aggregation sites for WG, SH, and other associated grouper and snapper species (SAFMC, 2012a, 2013). Several of the new areas selected by fishermen were selected independently by scientists based on geomorphology, and the finding was reinforced by observations of high concentrations of fish found in spawning condition in these locations during MARMAP surveys (Ballenger et al., 2013).
The history of SH and WG management in the South Atlantic offers the following lessons:
- Decisions made in an inconsistent and ad hoc manner and not based on the best available data (e.g., closing the snapper grouper fishery below 240 feet) can have significant socioeconomic impacts.
- Alternative management paradigms, including spatially explicit, ecosystem-based regulations might be better suited for managing data-poor reef fisheries than control rules based on FMSY.
- Marine Protected Areas that protect reef fish spawning aggregations might contribute to the management of many reef species.
Caribbean Groupers
The Caribbean Fishery Management Council (CFMC) has jurisdiction over the federal waters of the U.S. Caribbean, including Puerto Rico and the U.S. Virgin Islands of St. Thomas, St. John, and St. Croix (Figure 4.10). Each island is physically isolated from the others and has unique cultural identity, as well as distinctive physical environments and associated biota. Commercial Caribbean reef fish fisheries are highly diverse, consisting of roughly 350 species, 180 of which are commonly harvested in Puerto Rico and the U.S. Virgin Islands. The initial FMP for the reef fish fisheries included 64 of these species, which make up the bulk of the commercial and recreational harvest (CFMC, 1985). These small-scale fisheries are managed by a wide diversity of small operators, in small boats, who target many different species opportunistically with various gear types (even within a single day of fishing) (CFMC, 1985) and land their catch at a number of sites on each of the three main islands (Carr and Heyman, 2012). These factors pose challenges to data collection, assessment, and management of Caribbean fisheries, which are compounded by low institutional and governance capacity relative to other fisheries.
The value of the reef fish fisheries in the U.S. Virgin Islands and Puerto Rico is low compared to the values of many of the industrial fisheries in other regions. Nonetheless, the reef-fish complex is extremely valuable for the local communities—providing employment, income in commercial and sport fisheries, protein, recreation, and support to social customs and cultural identity. Total reef-fish landings were estimated at 7.5 million lbs in 1982, with a total value of $8.7 million (CFMC, 1985), employing approximately 2,000 commercial fishermen and 12,000 recreational boats. According to the best available data, and corroborated by interviewed fishermen, landings began to decline by the early 1980s. CPUE for the trap fishery in Puerto Rico had also declined by 57%. Still, in this time period, groupers made up roughly 23% of the shallow-water reef-fish landings (CFMC, 1985). Fishing for high-trophic-level groupers and snappers continued into the 1990s, including intensive harvest on spawning aggregations. As groupers and snappers were fished down, fishermen targeted lower-trophic-level species, such as parrotfish and grunts, which now dominate landings.
The CFMC manages 179 fish stocks under four FMPs. Caribbean Grouper Unit 4 is managed under the Caribbean Reef Fish Fisheries Management Unit (FMU) and includes red grouper (Epinephelus morio), tiger (Mycteroperca tigris), yellowfin (M. venenosa), and black (M. bonaci) groupers. In 2005, the CFMC designated the complex as overfished and undergoing overfishing, commencing a 10-year rebuilding plan (CFMC, 2005). Overfished was defined as a biomass level below 20% of the spawning stock biomass-per-recruit that would occur in the absence of fishing. Yellowfin grouper was used as the indicator species for the unit, although attempts to assess it were unsuccessful (SEDAR 14, 2007). Amendment 5 to the FMP established reference points (MSY, OY), status determination criteria (MSST and MFMT), and ACLs and accountability measures (AMs) to prevent overfishing, but the development of acceptable quantitative assessments has been frustrated by the lack of reliable data (CFMC, 2009). Even landings data
FIGURE 4.10 Caribbean Fishery Management Council jurisdiction includes the tropical waters around Puerto Rico and the U.S. Virgin Islands.
are problematic because of underreporting, and approximate adjustment factors are estimated based on all available data and fishermen’s opinions (CFMC, 2011). Yet management of these data-poor stocks is held to the same standards as any other stock in the nation.
All of the species of Caribbean Grouper Unit 4 aggregate to spawn, and most have been documented in multi-species spawning aggregation sites. Spawning aggregations of groupers and snappers are predictable in space and time and are highly vulnerable to fishing pressure (Coleman et al., 1996, 2000). Following a precautionary management approach and recognizing severe limitations on data, enforcement, and monitoring capacity, the CFMC has proactively closed several areas containing spawning aggregations in the region in an effort to reduce fishing mortality. These closures include closure for red hind near St. Thomas (CFMC, 1996), seasonal closure (1993-3994) of a site known to harbor a mutton snapper spawning aggregation off the southwestern tip of St. Croix (Kojis et al., 2009), and seasonal and area closures at Grammanik Bank south of St. Thomas, Lang Bank east of St. Croix, and several others. Fishermen suggested the most recent closure, Bajo de Sico, Puerto Rico, for its importance as a multi-species spawning aggregation site for groupers (red hind, Nassau, and yellowfin) (CFMC, 2010).
Protection of a red hind spawning aggregation in the Virgin Islands led to a 400-fold increase in red hind biomass aggregating at the site in only 4 years (Beets and Friedlander 1999) and to the recovery of other species including yellow-
fin grouper and Nassau grouper (Kadison et al., 2009). Recovery has also been documented at Riley’s Hump, a multi-species spawning aggregation site in the Florida Keys National Marine Sanctuary (Burton et al., 2005). Nassau grouper have recovered after the protection of their spawning aggregations in the Cayman Islands (Heppel et al., 2012).
Although providing seasonal protection is valuable, data from other locations that are less impacted by fishing suggest that multi-species spawning sites have a predictable geomorphology (Heyman and Kobara, 2012; Kobara et al., 2013), are used for spawning throughout the year, and would benefit from year-round protection (Coleman et al., 1996, 2000; Claro and Lindemen, 2003; Whaylen et al., 2004; Heyman and Kjerfve, 2008; Heyman, 2011). Closures could be complemented by monitoring programs designed to evaluate the status of all of the stocks that use the spawning sites. Such programs could be implemented efficiently via collaborative programs with fishermen using both fishery-dependent and -independent data. Networks of MPAs that encompass multi-species spawning aggregation sites can serve as source sites for the recovery of grouper and snapper throughout their geographic range, while supporting marine ecotourism, a nonconsumptive use of the resource that would improve local socioeconomic conditions (Heyman et al., 2010).
FINDINGS
4.1: Fish stocks can be considered on a continuum of data and knowledge availability. Consequently, differences in data availability, standards, and practices across regions result in varying definitions for overfishing and being in an overfished state.
4.2: Discontinuity and a potentially large decrease in target fishing mortality result from the distinction made between fishery management plans for a stock that has not been declared overfished and plans for rebuilding the same stock to comply with the MSFCMA. Alternative harvest control rules that gradually reduce fishing mortality as estimated stock size falls below BMSYcould result in a lower likelihood of a stock becoming overfished, as well as provide for rebuilding if necessary.
4.3: Although rebuilding plans need to be reviewed every other year, these reviews do not always involve updating quantitative stock assessments. Furthermore, the frequency of assessments varies within and among regions, from stocks that have never been assessed to stocks that are assessed annually. More frequent assessments might lead to more frequent but less extreme changes in ACLs or other “course corrections” and closer adherence to fishing mortality targets.
4.4: Estimation of fishing mortality reference points seems to be more robust to uncertainty than is estimation of biomass reference points.
4.5: Technical interactions involving overfished and rebuilding stocks have led to loss in yield for healthy stocks, because the mixed-stock exception has not been invoked in part because of the narrow range of situations to which it applies under the MSFCMA. This loss in yield is expected because FMSYis a limit reference point but is exacerbated when unproductive stocks are placed under rebuilding plans. Technical interactions also make it more difficult to rebuild stocks that are caught as bycatch of fisheries targeting other species. The operational feasibility of the mixed-stock exception should be reconsidered subject to assurances that bycaught species are not driven to unacceptably low abundance or become threatened.
4.6: In the face of the high uncertainty involved in population projections, the emphasis placed on achieving a biomass rebuilding threshold in a defined time frame may call for severe reductions in target fishing mortality (well below FMSY) when a stock’s rebuilding is slower than expected.
4.7: When information is limited, alternative, scientifically sound strategies could lead to better management results than the BMSYtarget approach that is prescribed by the NS1G. In the case of data-poor stocks for which analytical assessments are not available, and catch limits are therefore difficult to establish, empirical rebuilding strategies that rely on input controls to reduce fishing mortality may be more effective and defensible than strategies based on annual catch limits and BMSY targets.
4.8: The use of fully specified harvesting strategies that have been tested across a range of plausible models provides one approach, which has proven useful for dealing with biological and implementation uncertainties.


