


Below is the uncorrected machine-read text of this chapter, intended to provide our own search engines and external engines with highly rich, chapter-representative searchable text of each book. Because it is UNCORRECTED material, please consider the following text as a useful but insufficient proxy for the authoritative book pages.
After release to the sea, following intentional introduction of liquid wastes or after rupture of a canister, the concentration of the waste will be continually diminished by dilution brought about by the natural turbulent mixing processes that occur in the sea, and the mix- ture of waste and sea water will be moved from the disposal site by ocean currents. An evaluation of the extent of dilution together with processes that might combine to return the wastes to man are discussed below. TRANSPORT AND DISPERSION The movement of a contaminant from the disposal area and its dilution with sea water will be controlled by circulation in and adjacent to the disposal site and the natural turbulent mixing processes in the sea. Obviously, the bottom water circulation in the immediate area of the disposal site will control the initial movements of the soluble and finely divided waste as it diffuses from the ruptured canister. Movement of Bottom Sediment The mechanisms and patterns of bottom sediment transportation on continental shelves are poorly understood. The general circulation of the near-bottom water does not wholly control the movements of bottom sediments since tides, waves, storm surges and tsunami impose controls which may in fact outweigh in importance the average circu- lation of near-bottom water. Important in such considerations is the recent conclusion independently proposed by several groups studying the sediment budget of North Sea beaches that up to half the sediments contributed to certain advancing beaches has been derived off shore from the floor of the North Sea. The possibility thus exists that detri- tal waste may reach adjacent beaches in undesirable quantities. The base of effective wave action has been variously estimated at 30 feet to 900 feet. The discovery of strong scour on seamounts and on the Mid-Atlantic Ridge to depths of 2000 fathoms has been interpreted as evidence that there is no effective wave base. On the other hand, most geologists believe that really intense wave action is limited to the upper 30 to 100 feet of the ocean. Because movement of bottom mate- rials can be quite independent of the average water circulation since it partly depends on wave action and not wholly on water transport, it must be considered separately. Before extensive inshore dumping is commenced, it would seem desirable to dump harmless trace material and observe from what distances appreciable material reaches the ad- jacent beaches. Near-bottom Water Circulation Sub-surface circulation has not been studied with sufficient detail to provide a basis for reliable prediction of the direction and speed of transport at all seasons of the year in any location that might be chosen for a disposal area. Evaluation of bottom circulation must be inferred from observations of salinity and temperature distributions, and 16
measurements of surface drift, the latter largely from drift bottle ex- periments. A few direct measurements of bottom currents have been made from lightships. Our knowledge of bottom water circulation along the Atlantic Coast may best be summarized by the following four items: a. There is an area extending from south of Nantucket Shoals westward to the offing of New York from about 30 fathoms to 50 fathoms which appears to be somewhat isolated from the general circu- lation pattern. Following the vernal development of the pycnocline this lens of water retains its winter characteristics, remains in the same geographic location and does not become modified until the autumn over- turn. There appears to be restricted interchange of some of the water seaward with slope water. In other words this portion of the continental shelf below the pycnocline tends to stagnate for about six months of the year. b. Observation posts on lightships reveal a mid-summer inshore movement of bottom water along the coast from Virginia to New Jersey and subsequent upwelling, presumably due to offshore movement of surface waters due to wind shear. How far inshore from the light- ships this intrusion occurs we do not know. The observations also suggest a downwelling during the coldest parts of the winter when waters next to the coast chill to low temperatures, and subsequent offshore movement when resulting densi- ties reach below those of the adjacent offshore waters. This mechanism appears to occur in areas farthest from river mouths where the salinity inshore is highest. This phenomenon has been observed at Nantucket Shoals -where the bottom offshore movement was deduced to reach 2 miles per day (4 cm/sec) and south of Long Island where chilled coastal water contributed to the offshore lens of cold water. c. The pycnocline develops only very weakly in the coastal areas south of Cape Hatteras, allowing greater vertical mixing here than to the north where the pyncnocline is better developed. d. Bottom flow in the areas seaward from the mouths of estuaries can be expected to be shoreward, with intensification of shore- ward movement during seasons in which the land drainage into the estu- ary is at a maximum. Surface circulation. The movement of surface waters, summarized below, will be im- portant to the distribution of contaminant after diffusion and transport from the bottom have brought the contaminant into the surface waters. a. At the seaward end of all coastal estuaries the surface flow can be expected to be seaward with a tendency toward southerly flow along the coast adjacent to the estuary. 17
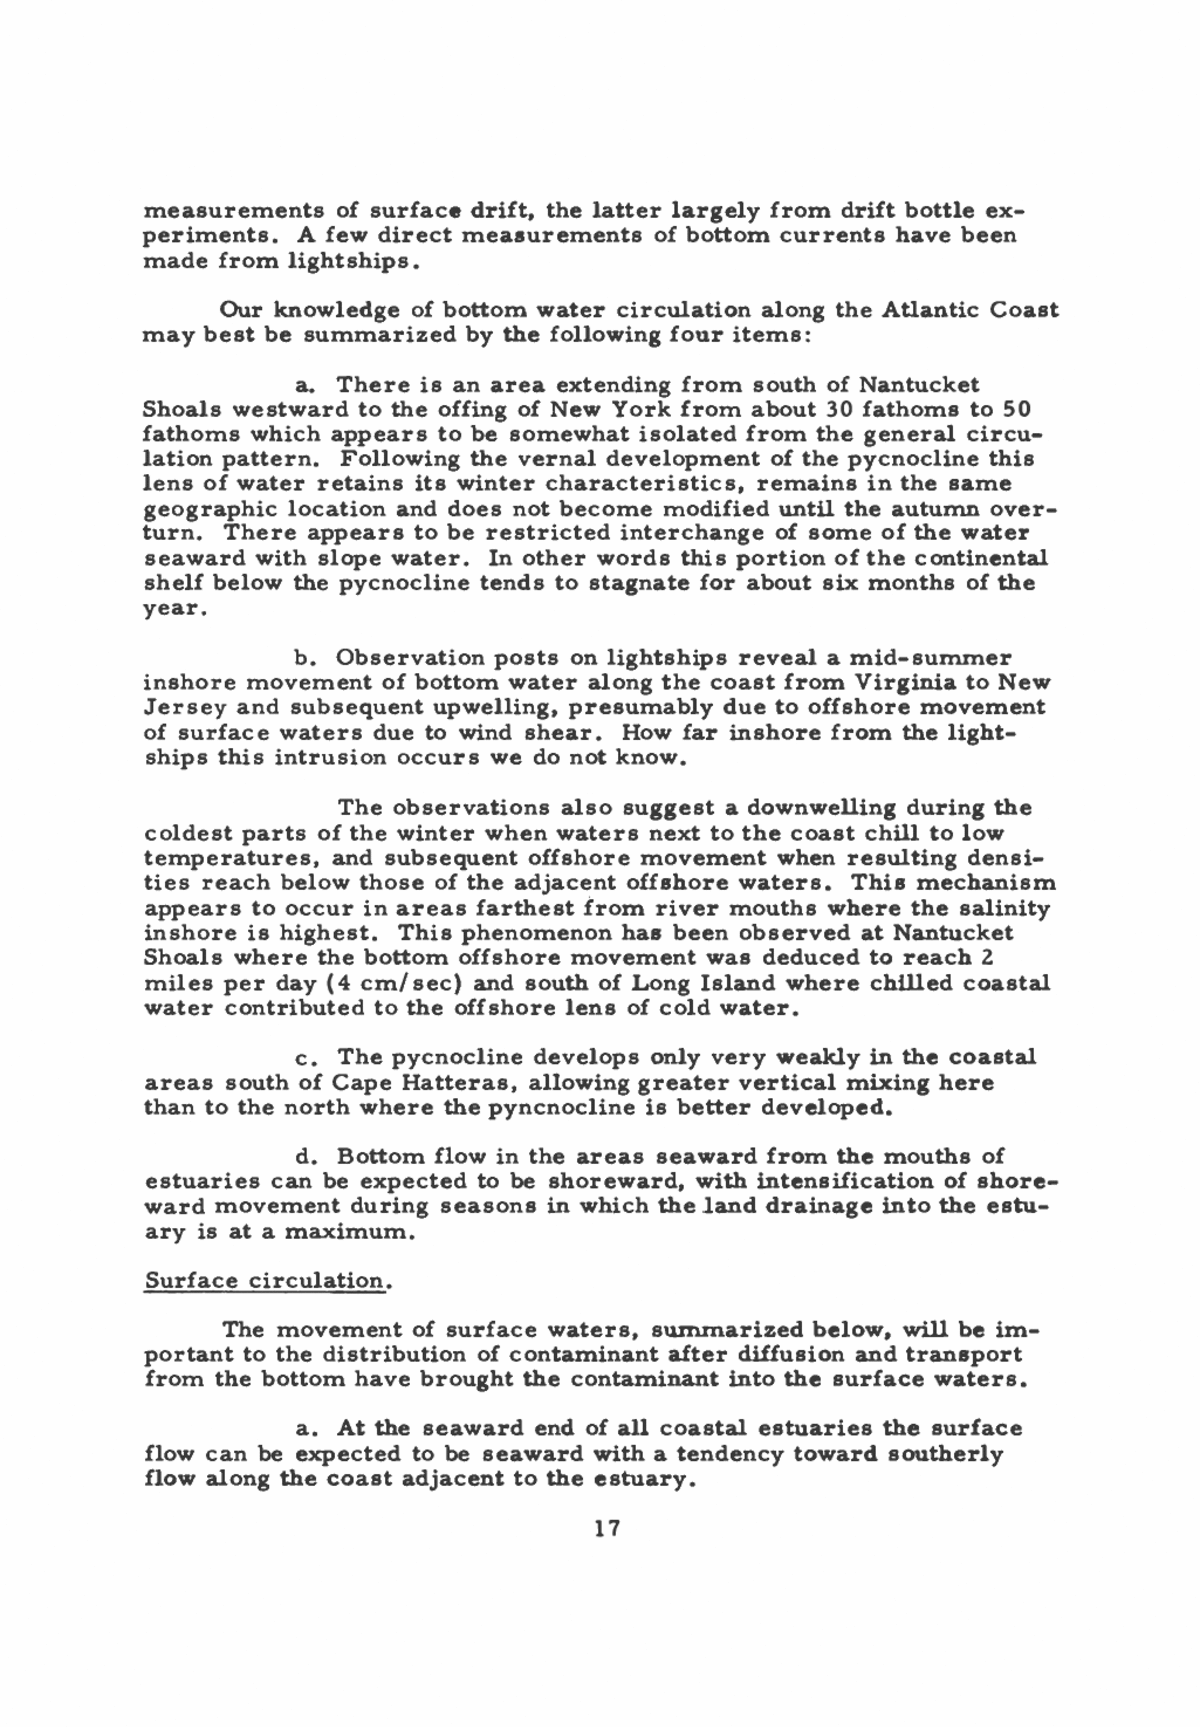
b. In general the circulation in the Gulf of Maine comprises a counterclockwise eddy. The drift along the Maine-Massachusetts coast is southerly, on the order of 2-6 miles per day (4-13 cm/sec). The southerly part of the circulation, in Massachusetts Bay, is com- prised of two drifts, one counterclockwise around Cape Cod Bay, and one across the mouth of Massachusetts Bay toward the outer coast of Cape Cod and thence southerly. The drift from Georges Bank is gener- ally west during the spring and summer but more offshore and perhaps even easterly during the autumn and winter. c. South of Massachusetts, Rhode Island, and New York the coastal drift tends to be westerly, 3-5 miles per day, (6-11 cm/sec) and from the offing of New Jersey southward to Cape Hatteras the set is southerly with speeds varying from 3-15 miles per day (6-32 cm/sec). d. From Cape Hatteras to Georgia the surface non-tidal drift tends northeasterly at speeds of 0.2 to 12 miles per day, (.4 to 26 cm/sec) with the highest concentrations of drift bottle strandings on the southern side of the Capes. From Georgia to Daytona Beach the set appears to be southerly and from Daytona Beach south the drift appears to be northerly (unpublished data). e. Redfield and Walford (11) noted that ". . wastes likely to be transported to beaches in the surface layers should be carried at least 10 miles to sea if contamination of beaches is to be avoided." The percentage frequency of strandings of drift bottles from areas off the U.S. coast, figure 2, indicates the variation in what may be construed as onshore or offshore areas of drift. The contours extend farthest off- shore in the Gulf of Maine and south of Nantucket. They bend in towards the mouths of the Hudson River, Delaware and Chesapeake Bays. On the other hand, on either side of the mouths of these estuaries the fre- quency of returns is high. Note also the high percentage of returns from bottles dropped from Georgia southward. Diffusion Processes In addition to the gross transportation of contaminants by perma- nent and semi-permanent ocean currents, the mechanism by which a contaminant will move from the bottom if current velocities are zero at the water-bottom interface is obviously important. This mechanism is diffusion controlled. Similarly, once the contaminant is contained in water its dispersion and subsequent dilution will also be controlled by turbulent diffusion processes. So far as can be discovered, there are no direct measurements of diffusion-controlled processes within the areas of interest that can be used to evaluate the relative importance of these mechanisms to the movement of the contaminants. It is possible, how- ever, to treat the problem theoretically, by imposing a number of sim- plifying assumptions which give a result that is not an accurate descrip- tion of the diffusion process, but does give limiting values of the concentration of contaminant in the sea. Reid (12) has examined several cases in which the following assumptions were made: 18
DRIFT BOTTLE RETURNS CONTOURS ARC PERCENTAGE OF BOTTLES RELEASED IN THE CONTOUR AREAS THAT ARE PICKED UP ON ADJACENT COASTS STIPPLED AREAS-OVER SO*/. RETURNS 19
a. The radioactivity in sea water is not depleted by adsorp- tion by the bottom solids, or by the uptake of marine organisms. b. Natural radioactive decay has been neglected. c. The diffusion process is considered to be Fickian. d. The ocean is considered to be of uniform depth. The assumption of Fickian diffusion implies that the dispersion of a contaminant at distances from the source is much slower than is known to occur. The assumptions of no adsorption by bottom solids and marine organisms, and no radioactive decay obviously lead to an overestimate of the concentration of contaminant. Several cases are considered, corresponding to possible conditions of release of the contaminant to the sea. These are summarized below. Sustained Gross Source. This case is analogous to the continued release of a contaminant, at a known rate, as from the end of a pipe, or the diffusion of contaminant from ruptured canisters, under a steady state condition of supply and rupturing of canisters. Considering a bottom disposal area of dimension L x L, over which the water depth is D, with a uniform current of speed U parallel to the coast, and a diffusivity coefficient K, the maximum concentration of contaminant Cm along the axis of the current at distance x from the source, (when x is large compared with L) for a rate of supply Q, is given by: (D n The maximum concentration at various distances as evaluated from equation (1) are listed in Table IV for the following conditions: Rate of supply Q = 100 curies per year (274 me/day) Depth of water D = 30 meters (90 feet) Diffusivity coefficient K= 1 cm2/sec Current velocity U - 10 cm/sec (approx. 5 n.mi/day) 20
TABLE IV MAXIMUM CONCENTRATION Cm, AT DISTANCES X FROM SUSTAINED GROSS SOURCE WITH RATE OF SUPPLY 100 CURIES PER YEAR x (Km) C (nc/ml) 1 2 x 10⁻⁷ 2 1.6 xlO-7 4 1 x 10⁻⁷ 10 7 x 10⁻⁸ 20 5 x 10"8 40 3 x 1<T8 100 2 x ID-8 It has been estimated that because of the assumptions under which equation (1)-was developed, the concentrations listed in Table IV are certainly high by at least a factor of 10, and probably by a factor of 100. Instantaneous Source. This case is analogous to the sudden rup- turing of a cubical canister on the bottom under the assumption that all of the contaminant is then free. Assuming no current to aid in dispersal, the reduction in concentration at the canister due to diffusion processes is given by: (2) C- 4 UKt)3/2 where, C = the concentration at time t C = initial concentration o V = volume of canister K = diffusivity coefficient The ratio of the interim concentration to initial concentration as a function of time for the specific case of K = 1 cm2/sec, V = 190 liters (volume approx. 50 gallons) is given in figure 3. It is seen that 0.01 curies contained initially in approximately 50 gallons, C0 = 54 iJC/kg, would be reduced to approximately 2 (j.c/kg in 1 hour and to 0.06 nc/kg in 10 hours. 21
(K=lcm2/sec, V* APPROX. 50GAL OR 190 LITERS) FIGURE 3 DIFFUSIVE DECAY OF CONCENTRATION AT SOURCE SOURCE ON BOTTOM 22
In addition to the time-concentration relationship, it is of interest to know the effect of distance from disposal site on the concentration for point sources. The maximum relative concentration (C/Co) as a function of distance from the site is shown for three cases in figure 4. Curve 1 assumes infinite depth of water, curve 2 assumes that the ratio of water depth to canister size is 100, and curve 3 assumes infinite depth and that all of the waste is not immediately available but diffuses from the ruptured canister at a uniform rate under the conditions that the diffusion coefficient through the ruptured canister is 10"" that of the diffusivity in the water. The latter case is discussed below. Continuous Source at Uniform Leaching Rate. This case treats the situation analogous to the diffusion of contaminant from the concrete that remains after the steel casing has corroded and affords no further containment. In the development of this case, it has been assumed that the amount of contaminant diffusing through the permeable concrete walls is directly proportional to the surface area of the container, di- rectly proportional to the difference in concentrations inside and imme- diately outside the container, and inversely proportional to the thickness RELATIVE OSTANCE \ 2 1 \ \ V (Quo, C/C, to, . . Instantontaa Boi Sourer on Bottom, D**> V \ \ \\ I,atmttnaa -Boi'Sarct a,auKm,.D/,,100 ^ \ / \ \/ \ \. Q)C/C0 for Coatiauom -Boi- 5 Sarct of inform itothing /fart, D-tD, k/K-tG* \ / \> \ : \^ !~ «⢠DISTANCES FOR V=49od \ \ N. FIGURE 4 RELATIVE CONCENTRATION VERSUS DISTANCE FROM SOURCE
of the walls. The effective diffusion coefficient through the walls is taken as the molecular diffusivity times the porosity of the walls, and in numerical computations is assumed to be 10"6 cm2/sec. The relative concentration-distance relationship is shown by curve 3 in figure 4. Reid further shows that under the condition of continual supply of canisters to a disposal area and given the assumptions noted above, the time required to reach a steady state between rate of disposal and leach- ing rate will be fourteen years. That is, only after fourteen years will the quantity of contaminant released to the water be equal to the rate at which contaminant is deposited on the bottom in canisters. If the life of the steel canister is ten years, as noted previously, the time to reach steady state would then be an additional ten years, or a total of twenty- four years. SORPTION AND EXCHANGE Coastal waters in general contain relatively large quantities of suspended solids. The solids are in part living organic materials, the plankton, and in part suspended, inanimate, organic and inorganic solids. A portion of the latter are materials being carried seaward by land drainage sources and will ultimately become bottom deposits. Another portion, that usually near the ocean bottom, is periodically brought into suspension by tidal action and storm-generated turbulence. All these materials including the "bottom" have a measurable-tendency to adsorb (remove from solution) and to hold substances dissolved in the water. The sorptive properties of these solids are extremely variable. Neglecting for the moment uptake by marine organisms, the quantity of material adsorbed by a given weight of suspended inorganic solids will depend upon the mineral composition of the solids, the composition of the solution in which the solids are suspended, and the past history of the solids. All of these factors are nearly impossible to evaluate quan- titatively for conditions likely to be found in nature. Although impossible to evaluate quantitatively, it seems certain that sorption processes will play a major role in controlling the dis- persal of radioactive wastes once they are free of the canister. This conclusion is based upon the results of a few laboratory studies, in ad- dition to qualitative field observations made during bomb tests and by the British at their disposal operation in the Irish Sea. The details are given in NAS-NRC publication 551, chapter 6 (5), and are summarized below: 1. Partial removal of mixed fission products from solution was achieved by centrifugal separation of naturally occurring solids from a contaminated solution. 2. The sorption of phosphate, iodide, iron III, strontium, sulphate, and copper II onto Chesapeake Bay sediments has been measured under a variety of environmental conditions. With the exception of iodide, ap- preciable removal from solution by the solids was observed under all conditions. 24
3. Sorption onto selected clay minerals has been studied and is recommended as a means of solution decontamination, under certain conditions. 4. The differences in composition between marine sediments and the solids carried to sea by rivers is attributed to exchange and sorp- tion reactions between the solids and dissolved substances during sedi- mentation. 5. The sediments in the area around the end of the discharge line from the British Atomic Energy Authority processing plant at Windscale on the shore of the Irish Sea, show a relatively large accumulation of radioactive substances. Although some of this information is quantitative it cannot be ap- plied directly to the dispersal problem we are considering. Neverthe- less, since radioactive waste components and naturally occurring sus- pended and deposited solids generally exhibit exchange and sorption reactions; and since the disposal canisters will be partially or perhaps completely buried in bottom deposits during the time the waste com- ponents are escaping from them, it seems inevitable that these reac- tions will have a major influence in controlling the rate of dispersal and ultimate distribution of the wastes. These sorption and exchange reactions appear to us to be a safety factor (an exception is noted below) in disposal problems. So far as uptake by permanent bottom deposits are concerned the effect is that of achieving additional containment time, thus providing for greater radio- active decay than would be achieved by containment only in the canister. There is at least one situation in which sorption onto bottom de- posits may represent the development of a possibly hazardous situation. This is the situation in which bottom areas adjacent to a disposal site are the source of marine food products such as oysters, clams, mus- sels, etc. In this case accumulation of wastes on the bottom would pro- vide for a greater level of contamination of the food product than would occur in the absence of sorption and exchange with the bottom. Our recommendation of a complete survey of a proposed inshore disposal area prior to the start of disposal operation will help preclude the de- velopment of such a hazard. Because we are unable to make a quantitative estimate of the magnitude of uptake on suspended and deposited solids, we have neg- lected this factor in our evaluation of the quantities of wastes likely to be found in the water and in marine food products for various rates of disposal of radioactive wastes. We believe that by neglecting this factor our recommendations concerning disposal rates include a safety factor of at least 10, and possibly more. 25
PERMISSIBLE CONCENTRATIONS OF RADIOISOTOPES IN SEA WATER AND UPTAKE BY MARINE ORGANISMS We have noted previously that we consider the return of radio- active wastes to man in the form of contaminated marine food products to be the most serious potential hazard that might be created by the use of near-shore areas as disposal sites. The ability of aquatic organisms to concentrate certain substances within themselves at higher levels than exists in their environment is well known. From earlier studies involving the concentration of the major nutrients, carbon, nitrogen, and phosphorus by phytoplankton and the aquatic plants, and the passage of these materials from plants to animals through successive prey - predator steps, we have a generalized picture of the nutrient cycles in which many kinds of aquatic organisms are in- volved. Following these early studies with the major nutrients, several of the trace metals that appear as minor but essential nutrients were studied, and recently the behavior of radioisotopes of several biologi- cally important elements has become known. This information was discussed in detail in NAS-NRC publication 551, chapters 7, 8, and 9 (5). Using this information, plus the results of studies completed since 1957, we can estimate the quantities of many radionuclides that will be contained within a variety of aquatic organisms when their environment contains stated concentration of the same nuclides. We have combined this information regarding the probable quan- tities of radionuclides in commercially landed fish with figures for max- imum permissible concentrations in drinking water, to obtain the quan- tity of radionuclides that will be returned to man in marine food pro- ducts, as follows: 1. The MPC values (3) are based upon acquiring a permissible body burden of a given radionuclide, below which no observable biolog- ical damage will occur, by drinking approximately 15,000 milliliters (15 liters) of water per week, at MPC levels, for 30 years. Thus, the MPC values permit the calculation of a permissible weekly intake for each of the nuclides listed. For example, the MPC value for Sr9° is 8 x 10"7 nc/ml. We calculate the permissible weekly intake of Sr90 to be 1.2 x 10"2 nc. 2. Using the permissible weekly intake as calculated above and figures for the quantity of fish eaten per person per week, it should be possible to compute the maximum permissible concentration of any nuclide in fish. In contrast to the drinking of water, man's seafood eating habits are extremely variable. According to Taylor (13) the average U.S. con- sumption of seafood is approximately 10 pounds per year. Comparable figures for other countries are France, 20; Great Britain, 48; Japan, 111 pounds per year. The average consumption of seafood, however, has little significance since large proportions of the population live far from the sea coast and eat little or no fish or other marine products. 26
A man would have to eat approximately four pounds of fish weekly in order to match the average U.S. protein consumption. It has seemed to us reasonable to take a value approaching this as the extreme case of an individual subsisting almost entirely on fish as the source of protein in his diet, and have used 1.5 kg (3.3 pounds) per week in further com- putations. For example, for Sr9°, using 1.2 x 10'2 \ic, computed above, as the maximum permissible weekly intake of nuclide and 1.5 kg as the weekly consumption of fish, we compute 8 x 10⁻³ ^tc/kg as the maximum permissible concentration of Sr9O in fish. 3. Next, having the maximum permissible concentration of a nuclide in fish and the concentration factor achieved by fish for the nuclide we compute the maximum permissible concentration for the nuclide in sea water. Again using Sr90 as an example, the maximum permissible concentration in fish of 8 x 10"3 nc/kg, combines with a concentration factor of 10, assuming the density of fish to be 1.0, to give a maximum permissible concentration in sea -water of 8 x 10⁻⁴ \ic/ liter or 8 x 10"7 nc/ml, which by coincidence is identical with the MPC value in drinking water. 4. These computations are summarized by the relationship: MPC x D = PSC x f x F where: MPC = maximum permissible concentration in drinking water (\ic/ml) D = volume of water drunk per week, taken as 15,000 ml PSC = permissible sea water concentration (nc/ml) £ = concentration factor by the organism F = weekly consumption of fish, taken to be 1.5 kg, and assuming a density of 1.0, to be equivalent to 1,500 ml. Computations, outlined above, have been made for a number of radionuclides, including the major isotopes shipped from ORNL, as well as several of the more hazardous fusion product elements. These com- putations are summarized in Table V. POSSIBLE CONFLICTS WITH OTHER INTERESTS Commercial Fisheries Many areas along the Atlantic and Gulf coasts of the United States have well developed, active fisheries. The disposal of radioactive wastes in these areas might be objectionable, not only because of the possibility 27
TABLE V SUMMARY OF PERMISSIBLE CONCENTRATION OF SELECTED RADIONUCLIDES IN DRINKING WATER; EDIBLE MARINE PRODUCTS; AND SEA WATER 1. 2. Maximum weekly MPC (uc/cc) dose (nc) 3. 4. Concentration factor 5. PFC (uc/gm) PSC (nc/ml) H3 0 3 3.000 2 -- -- C 14 3x 1o-3 45 3x 10⁻² -- - Na24 8x 10⁻³ 120 8x 10⁻² 0.5 1.6 xlO-1 P32 2x io-4 3 2x 10⁻³ 4x 1O4 5x 10⁻⁸ S35 5x 1o-3 75 5 x lO'2 5 1 x 10⁻² K42 1x lO"2 150 1x io-1 10 1x 10⁻² Ca45 5x io-4 7.5 5x 1O-3 10 5x io-4 Cr51 5x 1o-2 750 5x 10⁻¹ -- -- Fe59 4x 1o-3 60 4x 10⁻² 10* 4x io-6 Co 60 2 x 10⁻² 300 2x io-1 1O4* 2 x 10-5 Cu64 8x 1o-2 1200 8x 1o-' 5x 1O3 1.6 x 10⁻⁴ Zn65 6x lO-2 900 6 x io-1 SxlO3 1.2 X 10⁻⁴ Sr90 8x io-7 0.012 8x 10⁻⁶ 10 8x io-7 1 131 3 x io-s 0.45 3x io-4 100 3x 10⁻⁶ Cs 137 1.5 xlO-3 22.5 1.5 x lO-2 50** 3x io-4 Ir 192 9x io-4 13.5 9x 10⁻³ - - 1. Handbook 52 values (3). 2. From MPC and weekly ingestion rate of 15 liters of water. 3. Permissible fish concentration. From maximum weekly dose, and weekly ingestion rate of 1.5 kg of fish. 4. The concentration factors for the soft tissues of vertebrates or invertebrates, whichever is higher, from Revel le and Schoeffer (5). In all cases, except P 32, figures are for inverte- brates; vertebrates are lower by a factor of one half to one tenth. â¢Maximum factor for plankton species. Ketchum and Bowen (in press). "Data for soft tissues of oysters. Chipman (unpublished). 28
of contamination of the fish, with the development of a potential hazard to consumers, but also because the accumulation of disposal containers on the bottom might create a hazard to fishing equipment, especially to trawl gear that would become damaged or possibly lost if dragged over heavy concrete disposal containers. Furthermore, if radioactive dis- posal areas are to be closed to fishing, as they undoubtedly should be, it is in the interest of the best uses of our marine resources that dis- posal areas be placed where little or no fishing now occurs. In some areas the fishing intensity is well defined. This is the case in the coastal area northward from Long Island and including the Gulf of Maine. Most coastal estuaries have well developed fisheries. Thus, such areas as Delaware Bay, Chesapeake Bay, Albemarle Sound and Pamlico Sound are undesirable locations for disposal sites not only because of the shoreward transport in the bays and the restricted circu- lation in the sounds, but also because of possible conflict with the fish- eries. The region east and slightly south of Long Island between the 30 and 50 fathom contours, in which fishing vessels are unlikely to be found, coincides with the region noted previously to be characterized by "sum- mer stagnation". The lack of fishing effort in this area suggests it as a possible location for disposal sites. However, the restricted circulation through the region for about six months of the year suggests that during the times of "stagnation" an accumulation of wastes might occur in the area to such an extent that adjoining areas might be adversely affected once circulation is restored following the fall turn-over. At best, re- gions of this kind should be used as disposal sites only after a careful study of the year round exchange of water with adjoining areas. Unfortunately, detailed studies have not been made over the en- tire Atlantic and Gulf coasts. However, it seems likely that appropriate information can be obtained, for any proposed site, from state and local fisheries groups. In general the trend is toward the development of fisheries in deeper and deeper water. At present very little fishing is done beyond 100 fathoms. However, experimental fishing has been carried on out to 1000 fathoms, and indications are that with an increased demand for fish and with the development of the proper fishing gear, these relatively deep areas can support a considerable fishing effort. Submarine Cables. The disposal of packaged radioactive wastes in areas through which submarine cables pass will be objectionable from two points of view. First, there is a possibility of damage to the cable should a dis- posal container fall directly on it during disposal operations. Second, during cable maintenance and repair it is common practice to drag grappling equipment across the ocean bottom to locate the cable and to bring it to the surface. An accumulation of disposal containers on the bottom in such a location not only could interfere with the grappling 29
operation but might result in the premature rupture of a disposal con- tainer with possible exposure of personnel to measurable radiation. The location of submarine cables along the east coast of the United States is shown in figures 5 and 6. Proposed disposal sites have been chosen in areas not crossed by cables. MAXIMUM RATE OF DISPOSAL The maximum rate of disposal should be such that permissible sea water concentrations are not continuously exceeded. Several problems arise when this criterion is applied to practical disposal oper- ations. Firstly, disposal is a discontinuous process and even though activity will probably leach slowly from disposal containers for quite some time following rupture of the canister, it is highly unlikely that the rate of supply of activity to the water will be constant. How then should we average such a process? Secondly, the flux of contaminant from a disposal container will decrease as the amount of contaminant in the container decreases, producing an effect similar to that noted above. Thirdly, only a small fraction of the total volume of coastal waters will actually pass directly over a disposal area, although a much larger fraction of the total volume will be available for dilution. Most of these problems involve the averaging of concentrations that will be above and below permissible sea water concentrations for un- known lengths of time. We have solved this problem by using the boundaries of the dis- posal area as the spatial limit beyond which the concentration of con- taminant should never exceed the permissible sea water concentration. Using the relationship shown in equation 1, (p. 20) and assuming that a disposal canister will not contain more than 2 curies (approximately the limit set by ICC regulations), we find that for a disposal area 2 miles in diameter (the size of several suggested disposal areas), a dis- posal rate of between 200 and 300 curies of strontium 90 per year will keep the concentration below the permissible sea water concentration at the disposal area boundary. We have chosen 250 curies of strontium 90 or its equivalent. PRE-USE SURVEY AND MONITORING A precise evaluation of the quantity of radioactive substances that will be returned to man as the result of a stated rate of disposal into any one of the selected areas cannot be given. The recommended maximum rate of disposal (250 curies of Sr 90, or its equivalent) will, even under the most unfavorable combination of circumstances, result in concentrations of contaminant outside the disposal areas below per- missible levels. In order to obtain essential information not now available that will permit full utilization of the disposal areas without limiting other uses of coastal waters, the committee recommends, (1) a survey of any area prior to disposal operations, and (2) the monitoring of an area subsequent to the beginning of disposal operations. 30
SUBMARINE CABLES ATLANTIC AND EASTERN GULF OF MEXICO COASTS CAPE HATTERAS TO CUBA FIG. 5 30° 31
4S⢠40* 3V 75' SUBMARINE CABLES ATLANTIC COAST CAPE HATTERA4 TO NOVA SCOTIA FIG. 6 70* The pre-use survey should be designed to provide the following information: (1) Detailed circulation, including seasonal variations, in and adjacent to the disposal area, conducted so as to permit an evaluation of the dilution afforded by turbulent mixing within the area and transport from the area by ocean currents. (2) Measurement of the seasonal variations in the kind and quan- tities of aquatic organisms within and adjacent to a disposal area, es- pecially organisms attached to or living in the bottom. These may con- centrate or move components, of the wastes and so act first as a con- tainment element and second as a convenient indicator, during subsequent monitoring operations, of the spread of activity throughout the disposal area and of possible "leaking" out of the disposal area. 32
(3) Analysis of bottom sediments for mineral types, especially for components known to have high absorptive capacities, e.g. the clays. (4) Analysis of bottom organisms and bottom deposits for exist- ing radioactivity. This will be low prior to disposal, being primarily from natural activities and fall-out. The analysis should be conducted so as to distinguish between naturally occurring K40 and C14 and man- made isotopes, especially Sr90. (5) The existence of commercial and sports fishing activities within and adjacent to the selected area, determined by reference to U. S. Fish and Wildlife records and state and local authorities. Monitoring of a disposal area at intervals following the start of disposal operations will be essential to the safe and efficient use of an area. Monitoring procedures should include the collection of both bottom living organisms and bottom sediments, and analysis of each for radioactivity. The frequency of sampling and the methods of analysis should be such that estimates of the following can be made: (1) the containment provided by disposal canisters; (2) the distribution of waste components in the biota and the bottom sediments; (3) the existence of a steady state involving disposal rate and dis- tribution within the disposal area. DISPOSAL AREAS Suggested disposal areas are shown in figure 7, and their exact location listed in Table VI. Inasmuch as there are a number of disposal areas presently available, designated as "explosives dumping area" or "dumping ground (by permit only)", some of which have been used heretofore for the dis- posal of low level radioactive wastes as well as for certain toxic chem- ical wastes, we have included these areas in the list of suggested sites. We have numbered the sites 1 to 12. Alternative sites have been marked with the subscript a. or _b indicating that they might be used as secondary disposal areas but are more inconvenient to reach than the primary dis- posal area. Most of the dumping areas are large: 10 x 10 miles, 10 miles in diameter, or the like. We have indicated the centers of these areas, with one exception. Additional sites listed might be two miles in diam- eter centered on the positions given. Sites presently listed in "A special report on disposal of radioactivity into Atlantic Ocean watersâpast, present, and predicted", U.S.A.E.G. Division of Reactor Development, November 1957, are marked with an *. 33
34
TABLE VI LOCATION OF SUGGESTED DISPOSAL AREAS To serve Boston, Mossachusetts: 1* 42°25.5'N 70°35'W 312 ft. 2 miles in diameter, marked °Foul Area, Explosives" presently used by Crossroads Marine Disposal Company, 22 miles from Boston, Chart 1207. la* 41°33'N 65°30'W 6000ft. "Explosives Dumping Area" 10 x 10 miles square, Chart 71. To serve Providence, Rhode Island: Just subsequent to the first printing of this report locations 2 and 2a (41°19.7'N 71°63'W and 41°14'N 71°25'W respectively) were replaced by 2c and 2d (41°13'N 70°49'W, 62 ft.. Southern half of prohibited area around "No manâ¢s land,* south of Marthaâ¢s Vineyard, Mass. Chart 1210; and 42°13'N 69°48'W, 780 ft., 10 x 10 miles square, 16 miles northeast of Cape Cod Light, Mass., Chart 71) 2b 40°45'N 70°52'W 202 ft. "Explosives Dumping Area, Disused". 10 x 10 miles square, 45 miles from Sakonnet Point, Rhode Island, Chart 71,1108. To serve New York - Delaware Boy: 3 39°26.7'N 73°56.6'W 80 ft. "Danger Area" 2 miles in diameter 22.5 miles from Atlantic City, Chart 1217. 3a* 38°30'N 72°06'W 7200-9000 ft. "Explosives Dumping Area" 10 x 10 miles square, 118 miles 098°T from Five Fathom Bank Lightship, Chart 1000. 3b 38°05'N 73°24'W 5580-6360 ft. "Explosives Dumping Area" 10 x 10 miles square, 70 miles 127°T from Five Fathom Bank Lightship, Chart 1109. To serve Norfolk, Virginia: 4 36°49'N 75°27'W Wreck 9-1/4 in 66 ft. 37 miles from Little Creek, Chart 1109. 4a 37°19'N 74°15'W 3000-4800 ft. "Explosives Dumping Area" 10 x 10 miles square, 73 miles 074°T from Chesapeake Lightship, Chart 1109. 4b* 36°30'N 74°18'W 6000-7500 ft. "Explosives Dumping Area" 10 x 10 miles square, 74 miles 113°T from Chesapeake Lightship, Chart 1109. To serve Moreheod City â Beaufort, North Carolina: 5 34°26'N 76°54'W 77-81 ft. A "tear up" area according to "Report of North Carolina Shrimp Survey", Institute of Fisheries Research University North Carolina, January 1951. 22 miles from Morehead City, Chart 1234. To serve Savannah area: 6 32°20'N 79°55'W 60ft. "Dumping Ground (by permit only)" 8.5 miles diameter, 20 miles 136°T from mouth of North Edisto R., Chart 1111. *See last paragraph on page 33. 35
TABLE Vl-Continued 6a 32°00'N 80°30'W 60ft. A poor bottom for fishing. 18 miles from Ft. Screven, Chart 1240. 6b 32°15'N 78°40'W 120ft. "Explosives Dumping Area", 10 miles diameter, 70 miles from Charleston, South Carolina, Chart 1111. To serve Jacksonville, Florida: 7 30°33'N 81°09.2'W 67-70 ft. "Wreck, 42' Reported", 18 miles from Mayport, Chart 1243. 7a 30°37'N 79°53'W 1800ft. "Explosives Dumping Area, Disused", 83 miles from Mayport, Chart 1111. To serve the Florida peninsula: 8 26°05.5 'N 80°02.5 'W 3600 ft. 2 miles east of Port Everglades Sea Buoy, Chart 1248. To serve Pensocola â Mobile Bay: 9 29°48'N 87°33'W 138ft. "Dumping Ground" 35 miles from Pensacola, Chart 1115. 9a 29°48'N 87°10'W 600ft. Rough ground not suitable for trawling, 34 miles from Pensacola, Chart 1115. 9b 29°22'N 87°15'W 1800ft. "Explosives Dumping Area, Disused", 10 x 10 miles square, Chart 1115. To serve New Orleans, Louisiana: 10 28°40 'N 89°51 'W 600 ft. Rough ground, not suitable for trawling, 26 miles from Southwest Pass, Chart 1116. lOa 28°30'N 89°10'W 1800ft. "Explosives Dumping Area, Disused", 10 x 10 miles square, 30 miles from South Pass, Chart 1115. lOb 28°25'N 88°55'W 3600ft. "Explosives Dumping Area", 10 x 10 miles square, 36 miles from South Pass, Chart 1115. To serve Golveston, Texas: 11 29°00'N 94°35'W 54ft. Southernmost corner of a 5.5 x 11 mile rectangle. 'Dumping Ground (by permit only)" 21 miles from Galveston Entrance, Chart 1116. lla 29°22'N 93°40'W 42 ft. Rectangular 4x9 miles "Dumping Ground (by permit only)" 19 miles from Sabine Pass, Chart 1116. lib 27°40'N 93°30'W 1500ft. "Explosives Dumping Area, Disused" 10 x 10 miles square, 100 miles 175°T from Galveston Entrance, Chart 1116. To serve Corpus Christi, Texas: 12a 27°15'N 96°00'W 1500ft. "Explosives Dumping Area, Disused", 10 x 10 miles square, 65 miles 122°T from Aransas Pass, Chart 1117. 36
REFERENCES 1. A special Report on Disposal of Radioactivity Into Atlantic Ocean Waters: Past, Present, and Predicted. Division of Reactor Development, U.S. Atomic Energy Commission, Washington 25, D.C. November 1957 2. Packaging of Contaminated (Radioactive) Scrap for Disposal. U.S. Atomic En- ergy Commission. New York Operations Office, Health and Safety Laboratory, 70 Columbus Ave., New York 23, N.Y. (not dated) 3. Maximum Permissible Amounts of Radioisotopes in the Human Body and Maxi- mum Permissible Concentrations in Air and Water. Handbook 52. U.S. Depart- ment of Commerce, National Bureau of Standards (1953) 4. Radioactive Waste Disposal in the Ocean. Handbook 58. U.S. Department of Commerce, National Bureau of Standards (1954) 5. The Effects of Atomic Radiation on Oceanography and Fisheries. National Academy of Sciences - National Research Council. Publication 551 (1957) 6. Report of a Meeting of United Kingdom and United States Scientists on Biologi- cal Effects of Radiation in Oceanography and Fisheries. National Academy of Sciences - National Research Council, (mimeograph) Oct. 31, 1956 7. Pathological Effects of Atomic Radiations. National Academy of Sciences - National Research Council. Publication 452 (1956) 8. The Biological Effects of Atomic Radiation. Summary Reports. National Acad- emy of Sciences - National Research Council (1956) 9. Looney, Wm. B. Effects of Radium in Man. Science, 127 No. 3299, p. 630 (1958) 10. Uhlig, H. H., Corrosion Handbook. John Wiley and Sons, pp. 383-390 (1948) 11. Redfield, A. C. and L. A. Walford, A Study of the Disposal of Chemical Waste at Sea. Report of the Committee for Investigation of Waste Disposal. National Academy of Sciences - National Research Council. Publication 201 (1951) 12. Reid, R. O. An Analysis of Dispersion of Radioactivity from Local Sources on the Sea Bed. (Unpublished) 13. Taylor, Harden F. A Survey of Marine Fisheries of North Carolina. Univer- sity of North Carolian Press. Chapel Hill, North Carolina 555 pp. (1951) 37
NATIONAL ACADEMY OF SCIENCES- NATIONAL RESEARCH COUNCIL The National Academy of Sciences-National Research Council is a private, nonprofit organization of scientists, dedicated to the furtherance of science and to its use for the general welfare. The Academy itself was established in 1863 under a Con- gressional charter signed by President Lincoln. Empowered to provide for all activities appropriate to academies of science, it was also required by its charter to act as an adviser to the Federal Government in scientific matters. This provision accounts for the close ties that have always existed between the Academy and the Government, although the Academy is not a governmental agency. The National Research Council was established by the Academy in 1916, at the request of President Wilson, to enable scientists generally to associate their efforts with those of the limited membership of the Academy in service to the nation, to society, and to science at home and abroad. Members of the National Research Council receive their appointments from the President of the Academy. They include representatives nominated by the major scientific and technical societies, representatives of the Federal Gov- ernment, and a number of members-at-large. In addition, several thousand scientists and engineers take part in the activities of the Research Council through membership on its various boards and committees. Receiving funds from both public and private sources, by contributions, grant, or contract, the Academy and its Re- search Council thus work to stimulate research and its applications, to survey the broad possibilities of science, to promote effective utilization of the scientific and technical resources of the country, to serve the Government, and to further the general interests of science.
