
The Role of Individuals and Families
Important Points Made by the Speakers
• A relatively small portion of the population ages 65 and older spends down to become eligible for Medicaid, and those who do tend to have relatively little income or wealth. (Johnson)
• About 30 percent of households in the United States provide unpaid care to family members with disabilities. (Hunt)
• The costs to families and businesses incurred by the provision of long-term services and supports range into the trillions of dollars. (Hunt)
The role of individuals and families in financing long-term services and supports was the subject of the second session at the workshop. Richard Johnson, senior fellow and director of the program on retirement policy in the Income and Benefits Policy Center of the Urban Institute, looked at the prospects for financing from personal savings. Gail Hunt, president and chief operating officer of the National Alliance for Caregiving, considered family members and others who provide unpaid long-term services and supports. While both these sources of care are essential, neither can fully meet the needs of adults with disabilities.
FINANCING LONG-TERM SERVICES AND SUPPORTS FROM PERSONAL SAVINGS
Richard Johnson Urban Institute
As was emphasized in the workshop’s first session, many older adults face great difficulties in paying for long-term services and supports. Among adults 65 and older those with disabilities have less income and wealth on average than those without disabilities, and those with more disabilities tend to have lower income and wealth than those were fewer disabilities (see Figures 3-1 and 3-2). For people with limitations in three or more activities of daily living (ADLs), only 11 percent have incomes above four times the poverty level, and about 25 percent are below the poverty line (see Figure 3-1). Similarly, people with limitations in three or more ADLs have, on average, only about $8,000 of financial wealth that they can use to pay for long-term services and supports (see Figure 3-2).
Recent research has found that about 12 percent of the population ages 65 and older spends down to the Medicaid eligibility level during a 10-year period (Wiener et al., 2013). The people who spend down to this level tend to have relatively little income. These individuals also are likely to have had lower cumulative earnings during their lifetimes than people who do not
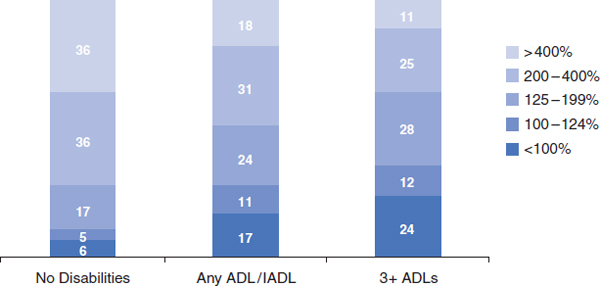
FIGURE 3-1 Household income of the noninstitutionalized older population relative to the poverty level by disability status, 2001.
NOTE: Data are for average, 45th to 55th percentile (similar to median). ADL = activity of daily living; IADL = instrumental activity of daily living.
SOURCE: Johnson and Wiener, 2006.
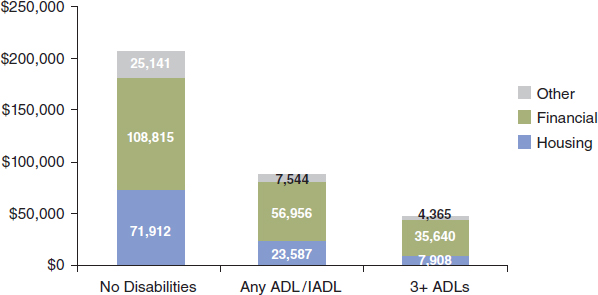
FIGURE 3-2 Average household wealth of the noninstitutionalized older population by disability status, 2002 (in dollars).
NOTE: Data are for average, 45th to 55th percentile (similar to median). ADL = activity of daily living; IADL = instrumental activity of daily living.
SOURCE: Johnson and Wiener, 2006.
spend down, Johnson said. Although some households in the top quintile of earnings eventually receive nursing home care paid for by Medicaid, more than 60 percent of those who receive such care are in the bottom two quintiles of lifetime household earnings (Johnson and Mermin, 2008).
People who become disabled in their 70s are more likely to spend down their wealth than are people in their 70s who do not become disabled, Johnson said (Johnson and Wiener, 2006). Furthermore, people who became disabled during their 70s had less wealth and income at the beginning of that period than people who did not become disabled, suggesting that the onset of disability was linked with factors, such as education or race, that also influenced wealth and income.
Projections for the Future1
Johnson also discussed how these numbers are likely to change in the future. A dynamic micro-simulation model developed at the Urban Institute (DYNASIM3), which simulates demographic events, economic trends, income, benefits, wealth, disability, and the use of long-term services and
_______________
1 The data in this section result from the DYNASIM3 model developed by the Urban Institute. A description of the model can be found at http://www.urban.org/UploadedPDF/410961_Dynasim3Primer.pdf (accessed October 17, 2013).
supports at older ages indicates that two-thirds of women born in the 1970s who survive to age 65 will live past age 85 and one in five will live past age 95—numbers that are significantly higher than for previous cohorts. Similarly, almost three-fifths of men born in the 1970s who survive to age 65 will live past age 85, and 15 percent will live past age 95.
The model also indicates that fewer older women will be widowed in coming decades, though more will be divorced, Johnson said. Men are living longer, but husbands and wives are divorcing more frequently than in the past. However, about one-third of women born in the 1960s and 1970s will be widowed for more than 10 years (compared with 49 percent and 44 percent of women born in the 1920s and 1930s, respectively), and the time spent unmarried among older women will not change much because of the increase in divorce, with about 60 percent of women spending more than 10 years alone after age 65. Fewer older men will be married in coming decades, which will affect their prospects for receiving care from their wives, Johnson said. As a result, later cohorts of older men will spend more time unmarried than in previous generations, with about 40 percent of those born in the 1960s and 1970s spending more than 10 years unmarried, up from 27 percent and 29 percent of those born in the 1920s and 1930s, respectively.
By 2040 about one-third of the population ages 65 and above will have a 4-year or higher college degree, compared with only about 16 percent today. The older population in the United States also will become more racially and ethnically diverse.
More recent cohorts of women have been working and earning more, which will improve their financial well-being in older age. As a result, women born in the later part of the baby boom (from 1956 to 1965) will receive about 50 percent more Social Security income than women born before the baby boom, although they still will receive less than men. Meanwhile, median earnings for men have stagnated in recent decades. In addition, a reduction in pension wealth will cause people born late in the baby boom to have less pension wealth in retirement than people born early in the baby boom, although defined contributions have compensated for this reduction.
Early baby boomers will have more housing equity on average than those born 10 years later or 10 years earlier. Taking everything into account, Johnson said, members of the baby boom generation will receive somewhat higher retirement incomes than their predecessors and their successors.
The results of these modeling efforts depend on critical assumptions regarding such issues as wage growth, further increases in longevity, and the returns on savings. In particular, Johnson said, the model may be overly
optimistic in projecting wage growth. Also, reducing the annuity value of assets reduces retirement incomes by about 15 percent.
Major questions that remain unanswered are how savings will grow and whether people will leave that money untouched until it is needed for long-term services and supports. Also, as Johnson observed, only about 10 percent of people are contributing the maximum to their 401(k) retirement plans. One of the most hopeful recent developments in pensions is auto enrollment, in which employees are automatically enrolled in 401(k) plans unless they specify otherwise. In firms with auto enrollment, contributions have risen dramatically—to 70 to 80 percent of the workforce. But while such programs have become common among large employers, they are less common at small companies. Also, people tend not to contribute the maximum amount they can, which limits the amounts they are saving for retirement. Can these individuals be persuaded to put money into a narrower savings vehicle, such as long-term care insurance? (This question is examined in more detail in Chapter 4.)
In response to a question, workshop participant Joshua Wiener, who did the research referenced by Johnson, said that people who spend down have much lower income and assets on average than those who do not spend down. This research also found that those people who spent down transferred their assets to their children at about half the rate of people who did not spend down. Wiener pointed out that the large amount of intergenerational transfer of money that goes on in the overall society is not fully appreciated. Wiener noted that the spend-down population may not transfer money as often as the non-spend-down population because they have a lot fewer assets to transfer. In addition, various studies have found that fairly small amounts of money are transferred, which are not enough to change the cost curve for long-term care.
Gail Hunt National Alliance for Caregiving
The National Alliance for Caregiving, which is a nonprofit coalition of more than 40 national organizations focused on family caregiving issues, has done a series of studies on caregiving in the United States, the most recent of which showed that about 66 million people provide family care; these 66 million people represent 29 percent of the U.S. population and 31 percent of households (National Alliance for Caregiving and AARP, 2009). Seventy-two percent of those are caring for somebody of age 50 or above, 14 percent are caring for a person with disabilities who is between the age
of 18 and 49, and an additional 14 percent are caring for children with disabilities who are under 18.
Caregivers have been in their role for an average of 4.6 years, with three in ten having given care for five years or more. About two-thirds are women. More than half of them help their care recipient with at least one ADL, including bathing, dressing, feeding, toileting, and transferring. These can be intense, personal, and stressful responsibilities, Hunt emphasized.
The Costs to Businesses and Families
Caregiving costs U.S. employers between $17 billion and $34 billion a year in lost productivity (MetLife Mature Market Institute and National Alliance for Caregiving, 2006). The top three costs to employers are replacing employees, workday interruptions such as coming in late or leaving early, and absenteeism. Workers also take leaves of absence, reduce their work hours, take less demanding jobs, give up working entirely, turn down promotions, lose job benefits, or choose early retirement.
Caregiving employees have health care costs that are 8 percent higher than those of employees who are not providing care, which costs employers an estimated $13.4 billion per year (MetLife Mature Market Institute, 2010). Younger caregivers (18 to 39) cost employers 11 percent more for health care than non-caregivers, and male caregivers cost employers 18 percent more for health care than female caregivers. Providing care also may be associated with high-risk behaviors such as smoking and alcohol consumption, Hunt said, and these behaviors may lead to disability-related absences. For example, people who were giving care had a higher rate of diabetes, depression, hypertension, and heart disease than people who were not giving care. About one-quarter of the males providing care reported that they had moderate or severe symptoms of depression, compared with 8 percent of males who were not caregivers. In addition, employed caregivers were less likely to manage their own health or to take part in preventive screenings offered by their employers.
In one study the average annual out-of-pocket expense for caregiving families was found to be about $5,500, which represented more than 10 percent of the median household income (Evercare and National Alliance for Caregiving, 2007). Long-distance care tended to be more costly because caregivers were paying for services to be performed. Items being purchased included medical expenses, food, meals, household goods, travel costs, additional services that were needed, and nursing homes or assisted living. Strategies for managing these expenses included cutting back on vacations, reducing leisure activities, and deferring major purchases.
The total estimated aggregate lost wages, pensions, and Social Security benefits of people ages 50 and older providing parental caregiving is nearly
$3 trillion (MetLife Mature Market Institute, 2011). For women leaving the workforce early for caregiving responsibilities, the total individual amount of lost wages equals $142,693 on average, with a somewhat lower number for men. In addition, adult children 50 and older who work and provide care to a parent are more likely to have just fair or poor health than those who do not provide care to their parents.
Experiences in Other Countries
Hunt briefly compared experiences in the United States with those in other countries. Australia provides non-means-tested payments to caregivers of $115 every 2 weeks, plus an annual payment of $600 per year. Australia’s Carer Recognition Act of 20102 formalized a statement to recognize and encourage support for caregivers, and the country has a national respite-for-caregivers program (Australian Government, Department of Health and Ageing, 2013).
The United Kingdom offers replacement care, respite care, and breaks for caregivers through an assessment of need. A program launched in 2009 advocates for caregivers by helping companies retain employees who are providing care for a family member. Informally, a program in the United Kingdom helps people resume their careers when they stop providing care, although no legislation guarantees getting a job back.
Germany’s long-term care program provides support for caregivers, while Japan has a public long-term care program that offers support to adult caregivers, almost all of whom are daughters.
The Limits to Family Care
During the discussion period, one workshop participant cautioned against labeling long-term services and supports a “social responsibility” because that term tends to be interpreted as “family responsibility.” Families are interested in taking care of their members, he said, but they may not be able to serve as safety nets in the future. With people living into their 90s, their own children are elderly and have needs of their own. Furthermore, with the high rate of divorce in recent decades, families are more diffuse and voluntary, and family responsibilities may be less clear cut than is the case with more traditional family structures.
_______________
2 See http://www.comlaw.gov.au/Details/C2010A00123 (accessed January 15, 2014).


