
3
Quantifying Synergies and Trade-Offs: Moving Forward from Conceptual Links to Empirical Data
Developing evidence-based food policy within an environmental sustainability context requires more than identifying the synergies and trade-offs between health and the environment associated with food production, consumption, and waste. It also requires quantifying those synergies and trade-offs. This chapter describes the workshop presentations and discussion that revolved around quantitative data and methodologies. A major focus of the presentations and discussion was how various hypothetical changes in the typical U.S. diet, such as an increase in the amount of fruits and vegetables consumed or a decrease in the amount of meat consumed, would impact the environmental consequences associated with the nation’s food system. Another overarching theme was whether and how quantitative synergy and trade-off data could be used to develop future U.S. dietary guidelines.
Emily Cassidy from the University of Minnesota quantified the environmental impacts of different diet preferences using three metrics: land use, water use, and greenhouse gas (GHG) emissions. Specifically, she quantified the land, water, and GHG emissions of the typical U.S. diet, which includes far more meat than is nutritionally recommended, and the projected land, water, and GHG emissions if Americans were to reduce their meat consumption by 75 percent. She also considered how environmental impacts would change if meat consumption decreased by 75 percent and beef was completely eliminated from the diet and if meat consumption remained the same but beef was completely eliminated from the diet.
Christian Peters from Tufts University described several ways to pre-
dict changes in land use with various hypothetical shifts in diet, including work by the U.S. Department of Agriculture (USDA) Economic Research Service (ERS) and his own work. Peters cautioned that assumptions made about what constitutes healthy eating with respect to meat are important in terms of trying to understand what the impacts will be on land use. He also discussed how actual land use changes can be tracked and evaluated and suggested that it is appropriate to begin considering environmental impacts when developing U.S. dietary guidelines but to do so within the bounds of available evidence.
Finally, Martin Heller from the University of Michigan considered how life-cycle assessment (LCA) has been used to study food and agricultural systems. He emphasized that LCA is “just a tool” and that its end results are relative measures, not absolute answers. To advance food-related LCA work, Heller encouraged an interdisciplinary dialogue to establish an appropriate functional unit (basis for relative assessment) for use in food LCAs and made a case for more data and improved ways to weight different environmental impact categories.
The three presentations prompted several questions from the audience about ways that analyses of environmental impacts can be expanded to include the full range of U.S. diets, including plant-only diets, processed foods, functional foods, and different types of animal production systems. Audience members also expressed concern about the quality of the data be-
Key Themes of This Chaptera
• Several data sources and methodologies are available to quantify the environmental impacts of diet and to predict how those impacts would likely change with shifts in diet. (Cassidy, Heller, Peters)
• Regardless of methodology used, results generated thus far generally indicate that a reduction in the animal protein content in the U.S. diet would reduce greenhouse gas emissions, land use, and other environmental impacts. (Cassidy, Heller, Peters)
• Classifying situations, or choices, as either “ethical synergies” or “ethical dilemmas” is a helpful way to frame the weighing of health versus environmental benefits. Eating more legumes is an example of an ethical synergy: it would improve health and reduce land use by reducing the reliance on meat as a protein source. Increasing fish consumption is an example of an ethical dilemma: it would improve health but have a negative effect on fish stocks. (Heller)
_________
a Key themes identified during discussions, presenter(s) attributed to statement indicated by parenthesis “( ).”
ing used in the various analyses described by the speakers and the confusing use of “sustainability” and some other words. These questions and concerns and the panelists’ responses are summarized at the end of this chapter.
QUANTIFYING ENVIRONMENTAL IMPACTS OF DIETS1
Efforts by Cassidy and colleagues in Jonathan Foley’s laboratory at the Institute on the Environment, University of Minnesota, to quantify the environmental impacts of diet rely on a combination of census and satellite data to determine the yields and distributions of more than 170 crops worldwide (Monfreda et al., 2008). Cassidy described some of the results of her lab’s efforts, emphasizing the predicted changes in environmental impact that would occur with shifts in the animal protein content of the typical U.S. diet. She pointed workshop participants to www.earthstat.org, where all of the crop yield and distribution data she discussed are freely available. Although agricultural productivity is usually measured in terms of tons per hectare, members of the Foley lab have been investigating ways to translate agricultural productivity into terms that describe actual food delivery to humans, specifically food types, calories, and protein.
In a study on global crop allocations, Cassidy et al. (2013) found that only about 59 percent of calories produced globally end up actually being delivered to people as food (see Figure 3-1). The 41 percent of calories lost are lost mostly to animal conversions to meat and dairy, but also increasingly to biofuels. Globally, 36 percent of calories produced by cropland are used for animal feed, as opposed to food production (see Figure 3-2). The average conversion efficiency of grain to livestock is about 10 percent, which means that only about 10 percent of all calories fed to livestock are actually delivered to humans in the form of either meat or dairy. Conversion efficiencies vary among different types of livestock: efficiencies are about 40 percent for dairy, 22 percent for eggs, 12 percent for chickens, 10 percent for pigs, and 3 percent for beef (Cassidy et al., 2013). The low conversion efficiency of beef cattle is due, in part, to the fact that only about 60 percent of the total live weight of beef cattle is edible (FAO, 1972).
In the United States, about 67 percent of calories produced are used for animal feed on average. Most of those feed calories are being consumed domestically but about 10 to 20 percent are exported (as feed). So, of all calories produced in the United States, only about 34 percent actually become food for humans (Cassidy et al., 2013). In Cassidy’s opinion, the 34 percent figure (compared to the 59 percent globally) is not very surprising given higher per capita meat consumption in the United States compared to
_____________
1 This section summarizes information presented by Emily Cassidy, B.S., Institute on the Environment, University of Minnesota.
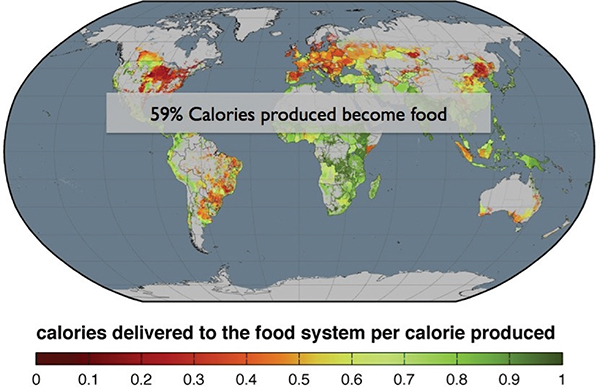
FIGURE 3-1 Proportion of total cropland calories produced that actually end up being delivered to people as food. Green areas on the map are areas where a high proportion of calories produced are directly delivered to people as food. Red areas of the map, like the U.S. Midwest, are areas where only a small proportion of calories produced are directly delivered to humans as food.
SOURCE: Cassidy et al., 2013.
most other countries. Americans consume, on average, about 123 kilograms of meat per capita per year (FAO, 2013).
According to the 2006 Institute of Medicine report Dietary Reference Intakes: The Essential Guide to Nutrient Requirements (IOM, 2006), about 0.6 grams of protein per day are recommended per kilogram of body weight. So for a 200-pound, or about 90-kilogram, person, that equates to about 54 grams of protein per day or 20 kilograms per year. Many developed countries consume more meat than is nutritionally recommended.
Environmental Impacts of Typical U.S. Diet
Cassidy used land, water, and GHG emission metrics to explore the likely environmental impacts if the typical U.S. diet were to shift toward less protein. According to FAOSTAT, in 2008 the typical U.S. diet (in terms of weight) included about 30 percent dairy, 15 percent meat (including beef, poultry, and pork), 14 percent fruits and vegetables, and smaller pro-
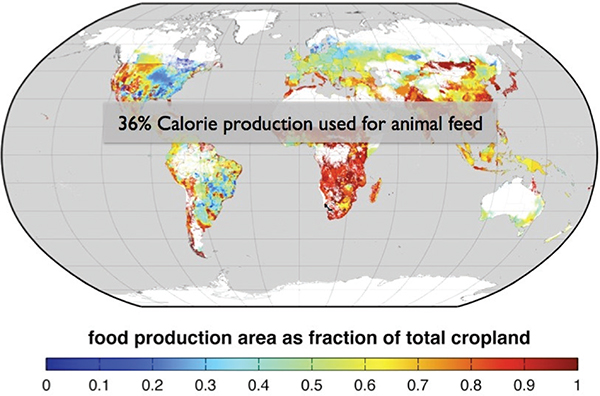
FIGURE 3-2 Proportion of total cropland calories used for animal feed, with areas in blue producing the greatest proportions of animal feed.
SOURCE: Foley et al., 2011.
portions of various other food groups (FAO, 2013). She emphasized that measuring these metrics is different for vegetable products versus animal products, with the latter requiring taking into account not only what the animals are eating but also how what they are eating is converted into meat or dairy (Bouwman et al., 2005).
To measure land requirements for different diets, Cassidy used both census and satellite data to determine the yields and distributions of major crops grown globally and in the United States. She assessed land requirements for 100 grams each of various food products, categorizing her findings using the same groups Food and Agricultural Organization uses (beef, pig, chicken, egg, dairy, oil crops, vegetable, fruit, cereals, sugars, tree nuts, starchy roots, pulses). Her recent measurements indicated that although meat comprises only 15 percent of the typical U.S. diet, it accounts for 44 percent of U.S. land being used for food production. Although beef comprises only 5 percent of the typical U.S. diet, it accounts for 26 percent of U.S. land being used for food production. Beef requires much more land than any other food group (see Figure 3-3).
For water metrics, Cassidy referred to Mekonnen and Hoedkstra
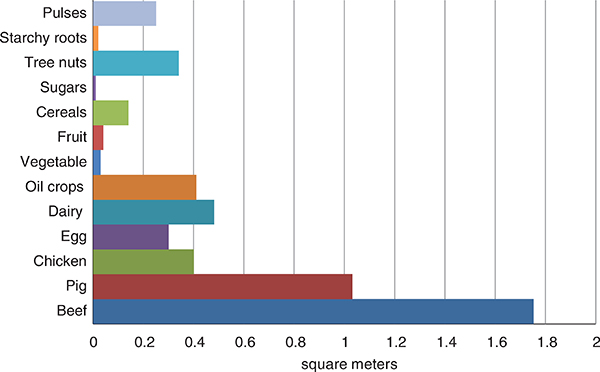
FIGURE 3-3 Land requirements (square meters per 100 grams produced) for various food groups, based on Food and Agriculture Organization food categories.
SOURCE: Unpublished results from Cassidy.
(2012), which she described as an “amazing” database of water footprints for crops and animal products, including U.S.-specific footprints. The water story is similar to the land story, with meat accounting for almost half of the water footprint of the typical U.S. diet and beef accounting for a disproportionately large portion of that.
Measuring GHG emission footprints is “tricky,” Cassidy said, as data for different types of products come from different sources. She cited Vermeulen et al. (2012), who estimated that agriculture accounts for roughly 19 to 29 percent of global anthropogenic GHG emissions, with about 80 to 86 percent of agricultural emissions occurring during the production stage and associated with fertilization (nitrous oxide emissions) or enteric fermentation (methane emissions). Thus, Cassidy calculated GHG emission footprints based on nitrous oxide and methane emissions. Her calculations did not include GHG emissions associated with land use change (e.g., deforestation). Specifically, she used data from Mueller et al. (2012) on the amount of nitrogen applied per ton of crop to estimate nitrous oxide emissions of various crops per ton or per kilogram of production. Based on the European Union Integrated Pollution Prevention and Control’s assessment that 1 percent of nitrogen applied is emitted as nitrous oxide (with nitrous oxide having about 310 times more global warming potential than
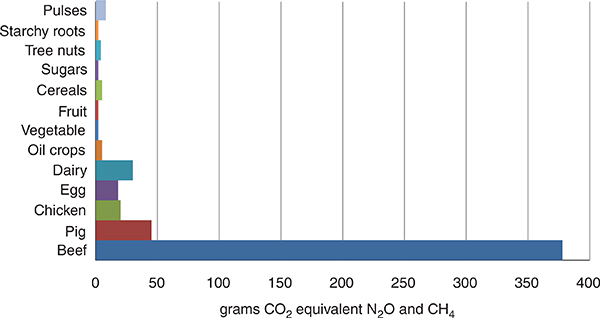
FIGURE 3-4 Greenhouse gas (GHG) emission footprints (grams GHG per 100 grams produced) for various food groups, based on nitrous oxide (fertilizer) and methane (enteric fermentation) data. Emissions associated with land use change (deforestation) are not included.
SOURCE: Unpublished results from Cassidy.
carbon dioxide), and also taking into account enteric fermentation (with methane having about 21 times more global warming potential than carbon dioxide), Cassidy reported that beef has a much larger footprint than any other food group, accounting for 56 percent of GHG emissions associated with the typical U.S. diet (see Figure 3-4). An estimated 85 percent of beef GHG emissions are enteric methane emissions, and the remaining 15 percent are from feed production for the beef cattle. Overall, meat accounts for 64 percent of the typical U.S. diet’s GHG emissions.
How Can New Guidelines Impact Environmental Footprints?
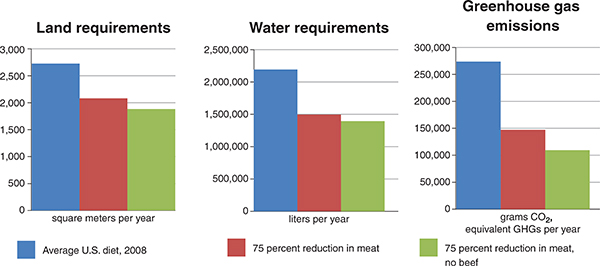
Americans consume a lot of meat, more than 110 kilograms per person per year,2 even though the nutritionally recommended amount is only about 23 kilograms per person per year (FAO, 2013). If meat consumption were to be reduced by 75 percent, to 30 kilograms per person per year, with the lost weight being compensated by fruits and vegetables, cereals, and other foods, what would happen to the environmental footprint of the U.S. diet? Cassidy’s calculations suggest that such a reduction would significantly
_____________
2 This statistic does not include losses due to household waste.
change the environmental impacts associated with the U.S. food system (see Figure 3-5). Specifically, a 75 percent reduction in meat consumption would result in a 27 percent reduction in land use, a 31 percent reduction in water use, and a 46 percent reduction in GHG emissions.
If beef consumption were eliminated entirely, a 75 percent reduction in overall meat consumption would result in similar land and water use reductions but even a greater GHG emission reduction (59 percent). If overall meat consumption were to remain the same but beef consumption were eliminated entirely, land use would be reduced by 15 percent, water use would be reduced by 19 percent, and GHG emissions would be reduced by 52 percent. So, consuming the same amount of meat (123 kilograms per person per year)—but with no beef in the diet—would still result in significant reductions in GHG emissions (unpublished data from Cassidy).
Although a meat reduction shift in diet would have a significant environmental impact, what is happening in reality? What efforts are under way to promote healthy eating, and what will be the environmental impacts of those efforts? Cassidy mentioned the South African Healthy Food Benefit effort to subsidize healthy food purchases (Sturm et al., 2013). The program covers more than 300,000 participants. Cassidy is collaborating with Derek Yach and Darren Segal of Discovery Vitality to assess changes in food purchased by enrollees in the program. Based on 2009-2012 data, they found that subsidizing fruits and vegetable purchases led enrollees to increase their purchases of fruits and vegetables by 5.7-8.5 percent and to decrease their purchases of processed sugary and fatty foods by 5.6-7.2 percent (Sturm et al., 2013).
Additionally, preliminary purchase weight data show a decrease in beef and pork purchases (by weight) and an increase in fruit and vegetable purchases (again, by weight). Based on an analysis similar to the one she performed for the U.S. food diet, Cassidy estimated the environmental impact of the observed shift in purchases by weight. Preliminary results show an 8-13 percent decrease in land requirements, a 7-12 percent decrease in the water footprint, and an 8-10 percent decrease in greenhouse gas emissions. Cassidy suggested that these results show promise for healthy food benefit programs in the United States, such as the Supplemental Nutrition Assistance Program.
LAND USE EFFECTS OF VARIOUS DIET PATTERNS3
The USDA ERS has been translating food supply data into consumption data since 1999, with the most recent update in 2008 (USDA, 1999; Wells and Buzby, 2008). The data allow for a comparison between consumption and the U.S. dietary guidelines (e.g., MyPyramid recommendations). The Wells and Buzby (2008) assessment showed that consumption of refined grains and meat/eggs/nuts is above the recommended amount, while consumption of vegetables, dairy, and fruit is below the recommended amount. The data also provide a baseline for how the U.S. diet would need to shift if the U.S. population were to instantaneously start following the dietary guidelines. The ERS has made two attempts to estimate what the land use impact would be if the U.S. population was to make that dietary shift.
First, Buzby et al. (2006) reported adjustments that would need to occur in harvested acreage in order to supply 100 percent of the population with enough food to meet the guidelines, assuming even distribution, during the period 1999-2003. Their results were not particularly surprising, in Peters’s opinion, given the disparity between consumption and the dietary guidelines for most food groups. A large increase in acreage, about a doubling, would be expected for fruit, and large but variable increases would be expected for vegetables, depending on the vegetable. Dark green and orange vegetables, as well as legumes, would require large increases in acreage, whereas starchy vegetables, like potatoes, would actually result in decreases. For whole grains, Buzby et al. (2006) analyzed only wheat, projecting a decrease in acreage. They did not examine the land use impacts of meeting the dairy recommendations. Overall, they predicted an increase of about 7.4 million acres. In terms of total land, 7.4 million acres is very small, Peters remarked. For certain food groups, such as for fruit, the change in acreage is substantial. But, overall, it is a small amount, given that harvested acreage in the United States totals about 300 million acres.
In a second study, Young and Kantor (1999) predicted the land use impacts of consumption shifts in other food groups, including sweeteners, meat, and added fat. Aligning sweetener consumption with the U.S. dietary recommendations would require a decrease translating to about a 67 percent reduction in land area for sugar cane, sugar beet, and corn sweetener crops. For meats and added fats, the land use implications of changing the American diet are more complex. The dietary guidelines recommend more lean meat, which would eventually require breeding leaner animals. But, in the short term, a shift to a leaner-meat diet would require more animals because the fattier cuts of meat would be discarded, with land
_____________
3 This section summarizes information presented by Christian J. Peters, Ph.D., Gerald J. and Dorothy R. Friedman School of Nutrition Science and Policy at Tufts University in Boston, Massachusetts.
use implications for both feed grains and oil seeds. The primary oil seed crop in the United States, soybean, is used both as a major livestock feed component and for vegetable oils and salad oils. So, if the demand for lean meat requires more animals, the demand for soybean meal as a livestock feed component would increase. But if the demand for added fat decreases (to meet the recommended dietary fat intake), the demand for soybean oil as a vegetable and salad oil would decrease. The expectation is that trade would resolve the mismatch between the demand for lean meat and less oil, that is, the excess soybean product would be exported, and the changes in soybean use would not necessarily translate into changes in U.S. land use.
The ERS story is not complete, in Peters’s opinion. Another way to predict land use change is to examine land use requirements of a complete diet, such as what Peters et al. (2007) did with their two-step process for estimating dietary land requirements for the New York state population. The first step is to estimate agricultural commodity needs (e.g., bushels of wheat, pounds of carcass) for the diet in question, based on the amount of edible food that would be needed to supply the intake, and accounting for losses that occur along the food supply chain. The second step is to estimate land needs, including crops needed for livestock and land required to meet those crop needs. Peters et al. (2007) examined 42 complete 2,300-calorie diets with varying meat and fat content. Meat content ranged from a vegetarian diet to a 381-gram meat diet (the equivalent of 12 cooked ounces of meat), and fat content ranged from 20 percent to 45 percent of total calories. The researchers estimated land requirements per person per year for each diet and concluded that land requirements increase as meat content in the diet increases, but the change in land requirements differs for cultivated crops (e.g., annual crops) versus perennial crops (e.g., hay and pasture) (see Figure 3-6).
According to 2009 food supply data, current consumption of meat (4.67), eggs (0.52), fish (0.46), nuts (0.81), and beans (0.10) totals 6.56 (in meat equivalent ounces4), which lies about in the middle of the graph in Figure 3-6. The change in land required per year from where the United States is today with its average diet, that is, mid-way along the x-axis, and a vegetarian diet is more than a twofold difference. Thus, Peters opined, “the assumptions made about what constitutes healthy eating with respect to meat are incredibly important in terms of trying to understand what the impacts will be on land use.”
_____________
4 One meat equivalent ounce = 1 ounce of fish; 0.25 cup cooked dry beans, 1 egg, or 0.5 ounce of nuts or seeds.
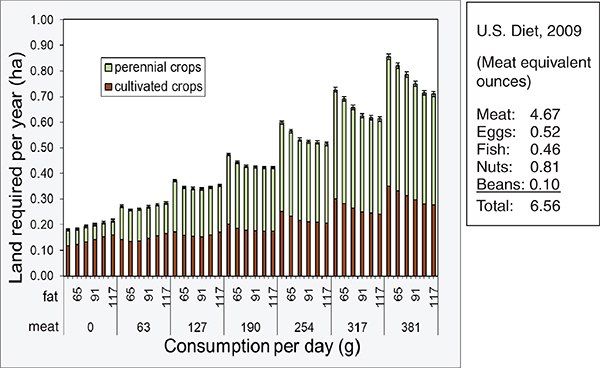
FIGURE 3-6 Land requirements for 42 different diets, all complete 2,300-calories diets but varying in meat and fat content. SOURCE: Peters et al., 2007.
Other Ways to Project Land Use Impacts
Peters identified three other methods to estimate change in land use, all of which are in use today and all of which are evolving to address not just land use but environmental impacts generally. One is economic modeling, with the goal of modeling demand and the potential supply given that demand (Rosegrant and IMPACT Development Team, 2012). An example of this method is the impact model by the International Food Policy Research Institute. A second method is LCA (deVries and deBoer, 2009), with the goal of apportioning the impact, in this case the land use impact, of different dietary patterns based on what has been observed. The third method is biophysical modeling5 (Wirsenius et al., 2010). Rather than focusing on economic drivers, biophysical modeling focuses on biological and physical factors that constrain and shape what the land requirements of a diet would be. Each method provides a unique perspective. Together, they provide a complete picture.
_____________
5 Biophysical modeling uses methods and theories from physics to study biological systems.
How Is Land Use Tracked?
Given that it is possible to gain a better understanding of how diet shifts would likely impact land use, how does one actually track the change? In Peters’s opinion, there are many good data sources for tracking land use. Temporal trends can be tracked using annual crop production survey data collected by the USDA National Agricultural Statistics Service or 5-year USDA Census of Agriculture data. Spatial patterns can be tracked using the National Land Cover Dataset (from the Multi-Resolution Land Characteristics Consortium6), which breaks land use into major categories like forest and agriculture and wetlands, and the Cropland Data Layer data released annually by USDA. Land use change can be tracked using National Resources Inventory data from the USDA Natural Resources Conservation Service,7 which measures, for example, how much land over time remains cropland as opposed to being converted into some other type of land. All of these various types of data—temporal, spatial, and land use change—can help researchers to understand sustainability impacts.
How Are Land Use Impacts Evaluated?
Given that it is possible to track land use and how land use is changing at a given point in space and time, how are those changes evaluated? Evaluating land use impacts is a complex task. According to Peters, there is debate in the literature about how to do it, with two contrasting hypotheses: the land-sparing hypothesis (e.g., Ausubel et al., 2013) versus the land-sharing hypothesis (e.g., Perfecto and Vandermeer, 2010). The land sparing hypothesis holds that increased yields spare land from conversion to agriculture, resulting in more undisturbed habitat, presumably greater biodiversity and, in some cases, other ecosystem services such as protection of soil or water recharge. For advocates of the land-sparing hypothesis, reducing land use in agriculture is generally seen as an environmental good. The land-sharing hypothesis, much of which comes from the conservation biology literature, holds that agriculture systems have the potential to both accommodate harvest for food and provide benefits and habitat for wildlife. The focus of land sharing advocates is on the negative social and ecological consequences of intensification. For land-sharing advocates, reducing land use in agriculture may not be an environmental good. In Peters’s opinion, the land-sparing hypothesis provides a useful rubric for evaluating land use impacts.
Peters mentioned that a couple of papers in the last few years have
_____________
6 See http://www.mrlc.gov (accessed December 9, 2013).
7 See http://www.nrcs.usda.gov/wps/portal/nrcs/main/national/technical/nra/nri (accessed December 9, 2013).
made the contention that agriculture should be limited to the current footprint (e.g., Foley et al., 2011; Godfray et al., 2010). He suggested indicators that could be used to help assess whether there is enough land for food security and whether there is room for error if the population were to grow, including land in reserve (e.g., land that is in reserve as part of the conservation reserve program) and the yield gap (i.e., difference between potential and actual yield).
Peters identified several helpful indicators for understanding the environmental impact of land use change, none of which by itself is sufficient for understanding the environmental impact of land use change: GHG emissions (carbon dioxide, methane, nitrous oxide), carbon storage, erosion, losses to air and water (sediment), and biological diversity. As just one example of how land use impacts have been evaluated in the literature, Fargione et al. (2008) predicted the number of years it takes to “pay back” the carbon released when land is changed from one type of ecosystem to another. Fargione et al. concluded that the answer varies a great deal depending on the nature of the change. Starting with marginal cropland or abandoned cropland and changing that land into a cellulosic ethanol system, which is very efficient, creates a payback period of about 1 year. But converting a rainforest into a biodiesel system creates a payback period of 100 or maybe even hundreds of years.
Balancing Health and Environment
Assuming that enough data exist to understand the context of the environmental impact of land use change, how can environmental benefits versus health benefits be weighed? Peters identified two types of situations: ethical synergy versus ethical dilemma. Ethical synergy occurs when a dietary shift is positive for both health and the environment. For example, eating more legumes would improve health and reduce land use by reducing the reliance on meat as a protein source. As another example, reducing sugar intake would improve health and reduce land use by eliminating excess energy intake. An ethical dilemma occurs when a dietary shift is positive for human health but negative for the environment, or vice versa. For example, increasing fish consumption would have human health benefit but a negative effect on wild stocks. As another example, increasing lean meats would presumably have a health benefit but would also increase land requirements. Ethical dilemmas force a comparison between two competing sets of value systems. With respect to the U.S. dietary guidelines, in Peters’s opinion, ethical synergy versus ethical dilemma is an easy way to classify choices.
Should Availability Influence Dietary Guidelines?
If there is a potential impact of consumption on food availability, should that impact be considered in the dietary guidelines? Peters remarked that it is appropriate to begin to consider it. He referred to an argument made in the late 1990s to think more broadly about agriculture (Welch and Graham, 1999). Welch and Graham (1999) identified three types of agricultural thinking: the production paradigm (with a focus on increasing output and economic efficiency), the sustainability paradigm (with a focus on ecological impact), and the food systems paradigm (with a focus on human health). They advocated for a broader paradigm, one that encompassed production, sustainability, and health. Peters noted that the same argument has been made elsewhere, in different ways. “I think that’s an appropriate way to begin looking at the guidelines.”
Summary
Peters summarized his presentation with four concluding points. First, “The jury is still out on the land use impact of diet.” Data from ERS suggest that diet changes have a modest impact overall, unless meat consumption changes. Second, researchers have the tools needed to begin both projecting the impacts of dietary change and tracking changes in land use. Third, the evaluation of impacts is complex and requires multiple indicators, although the idea of land sparing provides a useful starting point for thinking about the issue. Fourth, dietary guidelines should consider sustainability, but within the bounds of available evidence and with a key focus on identifying synergies and trade-offs.
LIFE-CYCLE ASSESSMENT OF DIETARY PATTERNS8
“Life-cycle assessment” is a term that has been “thrown around a lot,” Martin Heller said. But what exactly is it? In essence, LCA is a methodological framework for tracking the environmental impacts of producing a product, not just during manufacturing but also during the upstream extraction of raw materials, transportation throughout the life-cycle of the product, utilization (e.g., for a car, this would include tailpipe emissions), and disposal at the end of life. In the simplest terms, Heller thinks of it as an environmental accounting tool, one that tags all of these “cradle to grave” impacts together and provides an end result.
The international standards that have been developed to characterize
_____________
8 This section summarizes information presented by Martin Heller, Ph.D., University of Michigan, Ann Arbor, Michigan.
LCA define it as the “compilation and evaluation of the inputs and outputs and the potential environmental impacts of a product system throughout its life cycle” (International Organization for Standardization, 2006, p. 2). The inputs include raw materials (e.g., metals, minerals, water, land) and energy. Outputs include what people normally think of when they think about environmental pollutants: emissions to air, emissions to water, and waste products. When conducting LCA, one also has to consider co-products from systems and their impacts. For example, the production of milk also produces meat as a co-product; thus, the upstream burdens associated with producing those two products need to be allocated between them.
Importantly, LCA is a relative assessment method, which means the end result is relative to some measure, ideally a measure of the function of the system. How that measure, or functional unit, is chosen has significant implications for the end result. The choice of a functional unit is especially important when comparing different systems that provide the same function. Another important feature of LCA to keep in mind, in Hellers’s opinion, is that while International Organization for Standardization’s standards for LCA have helped to make LCA more consistent from one study to the next, there is still no single method for conducting a LCA. Many of the methodological decisions made in LCA studies depend on the goal of the study and can impact results, meaning comparisons between studies must be done with caution. Also important to keep in mind is that gathering, interconnecting, and managing all of the inputs and outputs can be data-intensive and time-consuming.
The ultimate aim of LCA is to connect all of the inputs and outputs and quantify their environmental significance using impact assessment models. Typical LCAs consider impacts on energy use, global warming potential, eutrophication, acidification, tropospheric ozone, and human toxicity. Other impact categories important to food and agriculture that have been less stressed in typical LCAs include land and water use, biodiversity, and eco-toxicity. According to Heller, developing relevant and meaningful impact assessment models for some of these less-often-used categories is a cutting edge area of current LCA research.
LCA has many uses: identifying hot spots (i.e., places in a system where attention should be re-focused); identifying and evaluating unintended consequences (e.g., production of aluminum to reduce the weight of an automobile and reduce fuel consumption carries a significant environmental burden); identifying and avoiding burden shifting to other life-cycle stages, other environmental impacts, or other geographic regions; comparing alternative products that provide the same service or alternative scenarios within a particular production system; communicating impacts to consumers through standardized product footprints and quantifying Environmental Product Declarations; and informing public policy. LCA has become a large
component of sustainable consumption policy in Europe, according to Heller. In the United States, the Environmental Protection Agency is using LCA to evaluate GHG emissions from renewable fuels under the Energy Independence and Security Act of 2007.
Regardless of its use, Heller reiterated the importance of keeping in mind that LCA is, ultimately, “just a tool.” It needs to be considered within its larger context.
The Use of LCA to Study Food and Agricultural Systems
An examination of the distribution of GHG emissions associated with U.S. milk production serves as a good example of the type of results LCA provides. As shown in Figure 3-7, although it may be possible to squeeze out some efficiency gains during processing, transport/distribution, or at the retail end of the life-cycle, the bulk of GHG emissions from farm milk
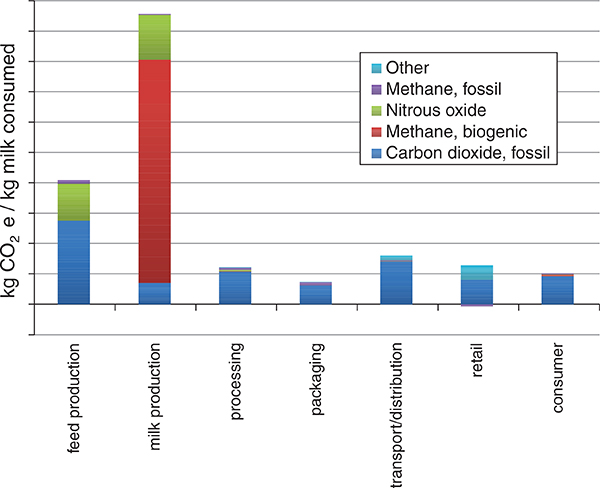
FIGURE 3-7 An example of life-cycle assessment results: Greenhouse gas emissions associated with U.S. milk production.
SOURCE: Data drawn from personal communication with study author (Thoma et al., 2013).
production in the United States come from enteric fermentation and manure management and, to a lesser extent, feed production (Thoma et al., 2013). The results provide helpful information regarding where to focus greenhouse gas emission reduction efforts.
Heller noted that the data illustrated in Figure 3-7 are per kilograms of milk consumed. That is, GHG emissions are being measured relative to the end user and include losses from retail and consumption, which can be significant, on the order of 30 percent for the U.S. food system in general (Buzby and Hyman, 2012). Because of losses in the milk example, more milk has to be produced for every 1 kilogram of milk actually consumed. Even though the losses occur during the retail and consumption phases of the life-cycle, the impacts of those losses occur throughout the life-cycle. Figure 3-8 reports the same data as Figure 3-7, but with losses shown at the level they are induced. Because those losses—and their impacts—are induced by the consumer and at the retail stage, efforts to reduce impacts associated with loss should target the consumer and retail stages. Food losses are often overlooked as a potential opportunity for reducing environmental
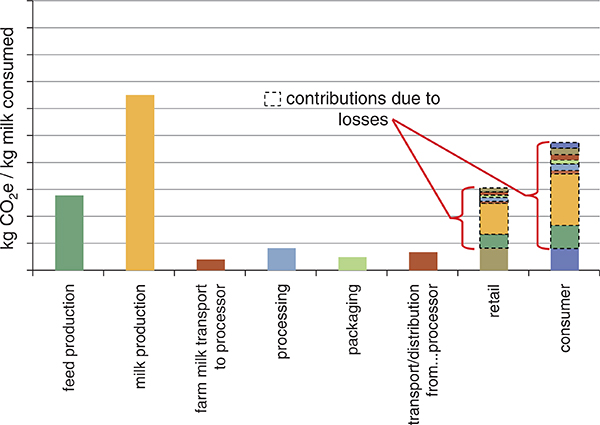
FIGURE 3-8 An example of life-cycle assessment results: Greenhouse gas emission contributions of food losses during the retail and consumer stages of the milk life-cycle.
SOURCE: Data drawn from personal communication with study author (Thoma et al., 2013).
impacts. A life-cycle perspective can help to highlight the importance of those losses.
Although food and agricultural systems have always been of interest and a challenge to the LCA community, interest has accelerated in recent years, and a body of results has accumulated that allows for comparisons among different types of food (see Table 3-1) (González et al., 2011). Heller reiterated that the results he was sharing were intended to serve as examples only. He cautioned, “Please don’t take these numbers home and use them as the end-all answer.” Nonetheless, a pattern is beginning to emerge, with animal-based foods at the high end with respect to GHG emissions and plant-based foods at the low end. Notable exceptions include out-of-season vegetable production in heated greenhouses, which have a large impact.
If LCA is going to be used to compare the environmental impacts of different foods, it is pertinent to begin to think about foods in terms of
TABLE 3-1 A Comparison of Life-Cycle Assessment Results for Greenhouse Gas Emissions Associated with Different Foods
| Per as-sold weight(kg CO2e/kg) | Per gram of protein (kg CO2e/gram of protein) | Per kcal food energy (kg CO2e/kcal food energy) | |
| Ground beef | 29.29 | 0.120 | 0.0127 |
| Ground lamb | 25.67 | 0.105 | 0.0091 |
| Cheese | 8.60 | 0.035 | 0.0021 |
| Ground pork | 8.20 | 0.032 | 0.0028 |
| Ground chicken | 4.75 | 0.018 | 0.0020 |
| Salmon | 3.27 | 0.015 | 0.0022 |
| Egg | 3.00 | 0.024 | 0.0021 |
| Tuna | 2.60 | 0.010 | 0.0022 |
| Brown rice | 1.20 | 0.014 | 0.003 |
| Skim milk | 1.10 | 0.032 | 0.0032 |
| Whole milk | 1.10 | 0.035 | 0.0018 |
| Dry beans | 1.00 | 0.004 | 0.0003 |
| Strawberries | 0.38 | 0.057 | 0.0012 |
| Broccoli | 0.37 | 0.013 | 0.0011 |
| Orange | 0.33 | 0.035 | 0.0007 |
| Tomatoes, field production | 0.33 | 0.037 | 0.0018 |
| Tomatoes, hothouse production | 5.30 | 0.604 | 0.0296 |
| Apple | 0.28 | 0.109 | 0.0005 |
| Potato | 0.20 | 0.008 | 0.0002 |
| Lettuce | 0.20 | 0.022 | 0.0014 |
| Winter squash | 0.09 | 0.010 | 0.0002 |
| Cucumber, field production | 0.08 | 0.014 | 0.0007 |
| Cucumber, hothouse production | 1.68 | 0.909 | 0.0454 |
SOURCE: González et al., 2011.
some sort of nutritional measure. But how should that nutritional measure be defined? Heller considered some options. As shown in Table 3-1, if milk and dry beans, for example, are compared on the basis of weight, their impact is similar. But if they are compared on the basis of grams of protein delivered, the impact of milk is nearly nine times that of dry beans. Ideally, LCA researchers would like to come up with a functional unit that serves as a measure of comprehensive nutritional quality.
Diet-Level LCAs
Because people consume foods in combination, with a diversity of foods meeting their dietary needs, Heller suggested that comparing foods, one to another as was done in González et al. (2011), may not be as useful as considering whole dietary patterns. He identified 32 studies to date that have used an LCA approach to evaluate food consumption patterns in terms of either meals or diets (e.g., Macdiarmid et al., 2012; Meier and Christen, 2013; Vieux et al., 2013). The studies vary with respect to scope and goal. Nonetheless, some trends are beginning to emerge. Most diet-level LCA studies (80 percent) are based on process LCAs of individual food items, which are then aggregated into consumption patterns. The remainder is economic input/output LCAs that link data on economic exchanges between sectors with data on sector emissions. Economic input-output LCAs simplify data collection but can be very difficult to interpret because of the sector-level aggregations.
Almost half of the diet-level LCA studies to date have examined only GHG emissions. Researchers recognize the importance of other environmental parameters, but their analyses have been limited by time and data availability. Interestingly, in Heller’s opinion, only 40 percent of diet-level LCA studies to date include the consumption phase (e.g., refrigeration, cooking, transportation from retail setting to home). It is known from other LCA estimates that components of that phase can be significant; household storage and preparation contributes 20 to 30 percent of total energy use across the whole food system (Heller and Keoleian, 2003). So, should those components be included in these diet-level LCAs? A shift in diet is probably not going to prompt many consumers to replace their current refrigerators with smaller ones. But when considering long-term policy strategies, one may want to think about broader infrastructure changes that have implications at the consumption stage.
Most diet-level LCA studies are coming out of the European Union. Heller is aware of only one that was conducted in a U.S. context. And only half have attempted to equalize diets on a nutritional basis. Otherwise, comparisons are based only on daily or annual intakes.
Heller observed some broad trends emerging from the diet-level LCAs.
First, typically, the environmental impacts of food life-cycles are dominated by agricultural production. Second, animal-based foods generally have greater impact than plant-based foods across almost all categories (with the exception of hothouse-produced or air-shipped fruits and vegetables). Third, based on the few studies that have examined current average diets versus dietary recommendations in Europe,9 a shift toward dietary recommendations can decrease GHG emissions by up to 10 percent.
Challenges and Future Work
Heller identified four major challenges for future food-related LCA work. First, from a life-cycle assessment perspective, finding the link between nutrition and the environment requires establishing an appropriate nutritional basis for a functional unit. Options include diet quality indexes (e.g., the Healthy Eating Index) and nutrient profiling schemes. Heller encouraged an interdisciplinary dialogue to help establish that functional unit.
Second, Heller made a call for more data, with respect to both availability and quality. The USDA census provides good agricultural production data, with the USDA LCA Digital Commons10 beginning to roll those data into a format that is more useful for LCA, but researchers need more region-specific data. With respect to environmental impact data, environmental impact categories need to be expanded beyond GHG emissions. Also needed is a consistent dataset of food LCA results.
Third, Heller urged consideration of the geospatial specificity of water use impact, land use impact, eutrophication, and other environmental impacts.
Finally, he called for improved ways to weight different environmental impact categories. Making a decision about environmental impact synergies and trade-offs ultimately becomes a value question: which environmental impact is more important? Improving valuation and weighting methods will be very helpful for interpreting future LCA work.
PANEL DISCUSSION WITH THE AUDIENCE
In the panel discussion with the audience following Heller’s presentation, workshop participants asked questions or commented on a range of topics: analyzing the environmental impacts of the full range of U.S. diets, including plant-only diets, processed foods, and functional foods; analyz-
_____________
9The European Food Safety Authority has provided scientific advice on the establishment of dietary recommendations (see http://www.efsa.europa.eu/en/topics/topic/drv.htm, accessed December 9, 2013).
10 See http://www.lcacommons.gov (accessed December 9, 2013).
ing the environmental impacts of different animal production systems; variation in land productivity; reliability of data; and the confusing and sometimes incorrect use of certain terms and language.
Analyzing Environmental Impacts of the Full Range of U.S. Diets, Including Plant-Only Diets, Processed Foods, and Functional Foods
An audience member commented on the fact that most speakers identified plant production as the most sustainable type of food production. She asked the panelists to comment on how they might expand their analyses to include the full range of diets, including plant-only diets. Cassidy replied that, for her, the interesting and important question is: How much meat consumption is sustainable? In Cassidy’s opinion, going 100 percent plant-based might be environmentally optimal. However, she commented on the “arduous” task of figuring out which foods to eat, for example, which cereals to mix with which legumes, in order to acquire sufficient amino acids. Heller responded that LCA experts are close to having the methodology and data framework necessary for examining those differences in diet, and there are several examples in the literature of diet-level LCA studies, but quantifying the nutritional quality of different diets remains a challenge. For example, if one were to examine diets with varying levels of meat consumption, how would the nutritional value of those varying levels be quantified? Peters agreed with the audience member that incorporating a wide range of diets into these analyses is desirable, but cautioned that the analyses are limited by methodology.
Another audience member was curious about whether any of the analyses consider processed foods, given that processing can be very energy-intensive. For example, do industry and home-processed foods have different environmental impacts? Heller replied that studying processed foods can be difficult because so much processed food information is privately held. He recalled some examples of LCA studies comparing home and commercially processed foods, such as baking bread in a community artisan bakery versus in a commercial factory (Andersson and Ohlsson, 1999). The differences are far less significant than one might expect.
There was another question about functional foods11 and whether any of the analyses on environmental impacts consider functional foods. The commenter noted the yogurt industry in upstate New York and the debate on production versus sustainability. Peters responded that his analyses are
_____________
11 The term “functional foods” is defined as whole foods along with fortified, enriched, or enhanced foods that have a potentially beneficial effect on health when consumed as part of a varied diet on a regular basis at effective levels based on significant standards of evidence (Academy of Nutrition and Dietetics, 2013).
focused on the entire diet, not specific foods. That said, he sees functional foods fitting into his analyses and weighing heavily in decisions about sustainability guidelines only if those foods provide something that cannot be provided elsewhere.
Environmental Impacts of Different Animal Production Systems
Several speakers addressed the environmental impacts of different quantities of meat in the diet or different types of meat in the diet. An audience member questioned whether there have been any analyses of different animal production systems, for example, grass-based animal production versus intensified production systems. Heller did not recall any noteworthy studies12 on grass-based versus conventional production, but he observed that there has been a wealth of studies on conventional versus organic milk production worldwide. He reiterated what Frank Mitloehner had discussed in a previous session about the direct relationship between production and environmental efficiency.
Peters mentioned a meta-analysis published in 2012 comparing LCAs of different production systems in Europe (Tuomisto et al., 2012). He also commented on the challenge of finding data for alternative production systems. “That’s the real stopping point,” he said, “because then you get into primary data collection.”
Variation in Land Productivity
An audience member raised a question about variation in land productivity and how analyses of environmental impact account for that variation. For example, land used for meat production is typically unsuitable for crop production. Peters responded that, yes, his second analysis (in which he estimated how many people could be fed off a given land base) accounted for differences in land capacity by classifying land into three categories (land suitable for pasturing, land suitable for perennial production or pasturing, and land suitable for any purpose). He agreed that accounting for land capacity has a big impact on estimating how many people can be fed on a given land base or how many complete diets can be produced from a given land base.
_____________
12 Since the workshop, a study by Lupo et al. (2013) provides a good example of this type of comparison.
Reliability of Data
A question was raised about the reliability of the datasets being tapped. The commenter mentioned a recent report that data from the USDA database on food wastage was inaccurate. Peters remarked that much of the land use data he uses in his analyses is collected annually. He assumes that data collected from the same locations year after year are relatively good and accurate. He is less certain of the accuracy of data collected from marginal locations, for example, data on specialty crops in areas that are not major production centers and where data are not collected frequently or where less data are available. He added that there is a difference between inaccuracy of data and differences in measurement. A classic example of identifying differences in measurements in land use is in hay crop production. Satellite image data and agricultural census data are very different.
Heller agreed that large datasets can contain significant uncertainty. Estimating that uncertainty is an important part of conducting an LCA. He added that uncertainty in LCAs stems not just from data measurement but also from impact assessment methods, especially the more complex impact assessment methods (e.g., those associated with human health and eco-toxicity). Sometimes, the uncertainty is so great that unless differences are order-of-magnitude differences, they cannot be considered significant.
Confusing and Sometimes Incorrect Use of Certain Terms and Language
An audience member commented on the sometimes interchangeable use of “organic,” “natural,” and “grass-fed.” In fact, they are very different from each other, in her opinion. Another audience member commented on inconsistent use of the word “sustainability,” noting that its inconsistent use is not surprising given that it is a difficult term to define. He referred workshop participants to the National Research Council’s 2010 report on agricultural sustainability, Toward Sustainable Agricultural Systems in the 21st Century (NRC, 2010), in which sustainability is defined on the basis of four social broad goals in areas of production, protection of natural resources, economic incentive, and community support. The commenter observed that most workshop participants seem to be using the term “sustainable” to refer to only one of those components, but not all four. “It’s either sustainable or it’s not,” he said, “and it’s got to have all of those components adequately supported to be sustainable.”
Academy of Nutrition and Dietetics. 2013. Position of the Academy of Nutrition and Dietetics: Functional foods. Journal of the Academy of Nutrition and Dietetics 113:1096-1103.
Andersson, K., and T. Ohlsson. 1999. Life cycle assessment of bread produced on different scales. International Journal of Life Cycle Assessment 4(1):25-40.
Ausubel, J. H., I. K. Wernick, and P. E. Waggoner. 2013. Peak farmland and the prospect for land sparing. Population and Development Review 38(Suppl):221-242.
Bouwman, A. F., K. W. Van der Hoek, B. Eickhout, and I. Soenario. 2005. Exploring changes in the world ruminant production systems. Agricultural Systems 84(2):121-153.
Buzby, J. C., and J. Hyman. 2012. Total and per capita value of food loss in the United States. Food Policy 37(5):561-570.
Buzby, J. C., H. F. Wells, and G. Vocke. 2006. Possible implications for U.S. agriculture from adoption of select dietary guidelines. Economic Research Report No. 31. Economic Research Service, U.S. Department of Agriculture.
Cassidy, E. S., J. S. Gerber, P. C. West, and J. A. Foley. 2013. Redefining agricultural yields: From tonnes to people nourished per hectare. Environmental Research Letters 8:034015.
deVries, M., and I. J. M. deBoer. 2009. Comparing environmental impacts for livestock producers: A review of life cycle assessments. Livestock Science 128(1):1-11.
FAO (Food and Agriculture Organization). 1972. Technical conversion factors for agricultural commodities. Rome: Food and Agriculture Organization.
FAO. 2013. Food balance sheets (FBS) FAOSTAT. http://faostat.fao.org/site/368/default.aspx#ancor (accessed October 15, 2013).
Fargione, J., J. Hill, D. Tilman, S. Polasky, and P. Hawthorne. 2008. Land clearing and the biofuel carbon debt. Science 319(5867):1235-1237.
Foley, J. A., N. Ramankutty, K. A. Brauman, E. S. Cassidy, J. S. Gerber, M. Johnston, N. D. Mueller, C. O’Connell, D. K. Ray, P. C. West, C. Balzer, E. M. Bennett, S. R. Carpenter, J. Hill, C. Monfreda, S. Polasky, J. Rockström, J. Sheehan, S. Siebert, D. Tilman, and D. P. M. Zaks. 2011. Solutions for a cultivated planet. Nature 478(7369):337-342.
Godfray, H. C., J. R. Beddington, I. R. Crute, L. Haddad, D. Lawrence, J. F. Muir, J. Pretty, S. Robinson, S. M. Thomas, and C. Toulmin. 2010. Food security: The challenge of feeding 9 billion people. Science 327(5967):812-818.
González, A. D., B. Frostell, and A. Carlsson-Kanyama. 2011. Protein efficiency per unit energy and per unit greenhouse gas emissions: Potential contribution of diet choices to climate change. Food Policy 36(5):562-570.
Heller, M. C., and G. A. Keoleian. 2003. Assessing the sustainability of the US food system: A life cycle perspective. Agricultural Systems 76(3):1007-1041.
International Organization for Standardization. 2006. Environmental management–life cycle assessment—principles and framework. ISO 14040(E). Geneva: International Organization for Standardization.
IOM (Institute of Medicine). 2006. Dietary reference intakes: The essential guide to nutrient requirements. Washington, DC: The National Academies Press.
Lupo, C. D., D. E. Clay, J. L. Benning, and J. J. Stone. 2013. Life-cycle assessment of the beef cattle production system for the northern great plains, USA. Journal of Environmental Quality 42(5)1386-1394.
Macdiarmid, J., J. Kyle, G. W. Horgan, J. Loe, C. Fyfe, A. Johnstone, and G. McNeill. 2012. Sustainable diets for the future: Can we contribute to reducing greenhouse gas emissions by eating a healthy diet? American Journal of Clinical Nutrition 96(3):632-639.
Meier, T., and O. Christen. 2013. Environmental impacts of dietary recommendations and dietary styles: Germany as an example. Environmental Science and Technology 47(2): 877-888.
Mekonnen, M. M., and A. Y. Hoekstra. 2012. A global assessment of the water footprint of farm animal products. Ecosystems 15:401-415.
Monfreda C., N. Ramankutty, and J. A. Foley. 2008. Farming the planet: 2. Geographic distribution of crop areas, yields, physiological types, and net primary production in the year 2000. Global Biogeochemical Cycles 22(1):1-19.
Mueller, N. D., J. S. Gerber, M. Johnston, D. K. Ray, N. Ramankutty, and J. A. Foley. 2012. Closing yield gaps through nutrient and water management. Nature 490:254-257.
NRC (National Research Council). 2010. Toward sustainable agricultural systems in the 21st century. Washington, DC: The National Academies Press.
Perfecto, I., and J. Vandermeer. 2010. The agroecological matrix as an alternative to the land-sparing/agriculture intensification model. Proceedings of the National Academy of Sciences of the United States of America 107(13):5786-5781.
Peters, C. J., J. L. Wilkins, and G. W. Fick. 2007. Testing a complete-diet model for estimating the land resource requirements of food consumption and agricultural carrying capacity: The New York state example. Renewable Agriculture and Food Systems 22(2):145-153.
Rosegrant, M. W., and IMPACT Development Team. 2012. International model for policy analysis of agricultural commodities and trade (IMPACT): Model description. Washington, DC: International Food Policy Research Institute.
Sturm, R., R. An, D. Segal, and D. Patel. 2013. A cash-back rebate program for healthy food purchases in South Africa. Results from scanner data. American Journal of Preventive Medicine 44(6):567-572.
Thoma, G., J. Popp, D. Nutter, D. Shonnard, R. Ulrich, M. Matlock, D. S. Kim, Z. Neiderman, N. Kemper, C. East, and F. Adom. 2013. Greenhouse gas emissions from milk production and consumption in the United States: A cradle-to-grave life cycle assessment circa 2008. International Dairy Journal 31(Suppl 1):S3-S14.
Tuomisto, H. L., I. D. Hodge, P. Riordan, and D. W. Macdonald. 2012. Does organic farming reduce environmental impacts?—a meta-analysis of European research. Journal of Environmental Management 112:309-320.
USDA (U.S. Department of Agriculture). 1999. America’s eating habits: Changes and consequences. Agriculture Information Bulletin No. AIB-750. http://www.ers.usda.gov/publications/aib-agricultural-information-bulletin/aib750.aspx#.UggmURaBJz8 (accessed August 14, 2013).
Vermeulen, S. J., B. M. Campbell, and J. S. I. Ingram. 2012. Climate change and food systems. Annual Review of Environment and Resources 37:195-222.
Vieux, F., L.-G. Soler, D. Touazi, and N. Darmon. 2013. High nutritional quality is not associated with low greenhouse gas emissions in self-selected diets of French adults. American Journal of Clinical Nutrition 97:569-583.
Welch, R. M., and R. D. Graham. 1999. A new paradigm for world agriculture: Meeting human needs. Field Crops Research 60(1-2):1-10.
Wells, H. F., and J. C. Buzby. 2008. Dietary assessment of major trends in U.S. food consumption, 1970-2005. EIB-33. Washington, DC: U.S. Department of Agriculture, Economic Research Service.
Wirsenius, S., C. Azar, and G. Berndes. 2010. How much land is needed for global food production under scenarios of dietary changes and livestock productivity increases in 2030? Agricultural Systems 10(3):621-638.
Young, C. D., and L. S. Kantor. 1999. Moving toward the food guide pyramid: Implications for U.S. agriculture. In America’s eating habits: Changes and consequences, edited by E. Frazao. AIIB-750. Washington, DC: U.S. Department of Agriculture, Economic Research Service. Pp. 403-413.


