
INTRODUCTION
The Bureau of Safety and Environmental Enforcement (BSEE) enforces compliance with oil spill response requirements for facilities located seaward of the coastline. It commissioned Genwest Systems, Inc., to assess the existing planning standard for response to offshore oil spills with mechanical oil skimming systems, known as the Effective Daly Recovery Capacity (EDRC), and to consider improvements to that standard. BSEE then requested that the National Research Council form an ad hoc study committee to review the completed report, EDRC Project Final Report (Genwest, 2012).
In its report, Genwest proposed an Estimated Recovery System Potential (ERSP) calculation as an alternative to EDRC. BSEE specifically asked the National Research Council committee to consider three aspects of the ERSP approach in the Genwest report: the proposed methodology of ERSP, its applicability, and the computer model behind ERSP. BSEE provided 10 specific questions within those three aspects of the committee’s statement of task (Appendix B). This letter report is organized by these three aspects and concludes with responses to each of the 10 questions in Box 1 at the end of the report. The committee understood the Genwest report to be final and that BSEE was seeking advice on its content and how BSEE might proceed.
Under the methodology section, BSEE provided two questions in regard to the committee’s views on the suitability of this report for “decision making” and for “rule-making.” To address these two topics in a useful way, the committee has first provided an overall context for the use of mechanical skimming systems in response planning and has offered some general recommendations in that regard as well.
CONTEXT FOR USE OF MECHANICAL SKIMMING SYSTEMS IN OIL SPILL RESPONSE PLANNING
It is important to note clearly that the EDRC approach currently used for planning purposes by BSEE and the alternative ERSP approach proposed by Genwest are designed to estimate recovery capabilities for planning purposes, not for actual performance or skimmer design improvements, per se. The committee understood the difference to be that a planning tool does not need to reflect as much detail or accuracy as a tool or model that attempts to design or forecast actual system performance in a specific spill scenario. Several other software packages can be used to conduct such a performance-based estimation and account for a variety of environmental and operational factors. Considering the large variability of possible spill scenarios and environmental conditions that could be encountered by the response plan holders,1 there is a need—for planning purposes—to have a tool that can be easy to use and to audit and that considers the most important factors affecting the level of preparedness required for the response to a worst-case discharge, as called for in the Code of Federal Regulations (30 CFR Part 254).
The Code of Federal Regulations (30 CFR § 254.26) states that a plan holder must demonstrate strategies for response to the worst-case discharge scenario in adverse weather conditions, which could be interpreted as “high seas, high wind, low visibility” conditions under which mechanical recovery would be considered ineffective and perhaps unsafe and impractical. If other response options (e.g., use of dispersants or in-situ burning) are considered alongside
______________________
1A plan holder, as defined by 30 CFR § 254.1, includes “the owner or operator of an oil handling, storage, or transportation facility” that is “located seaward of the coast line.”
mechanical recovery to address a particular scenario, the response plan would better demonstrate that it indeed covers a variety of possible environmental conditions and response options (Figure 1). Approaches that minimize overall environmental impact include countering an oil spill as close to the spill source as quickly as possible to prevent it from entering environmentally sensitive areas. Further, the response should be tailored to the oil type, spill scenario, and environmental conditions. Limiting the response to a single technique or “tool” could reduce overall response effectiveness, especially when operational or environmental conditions prevent its optimal use.
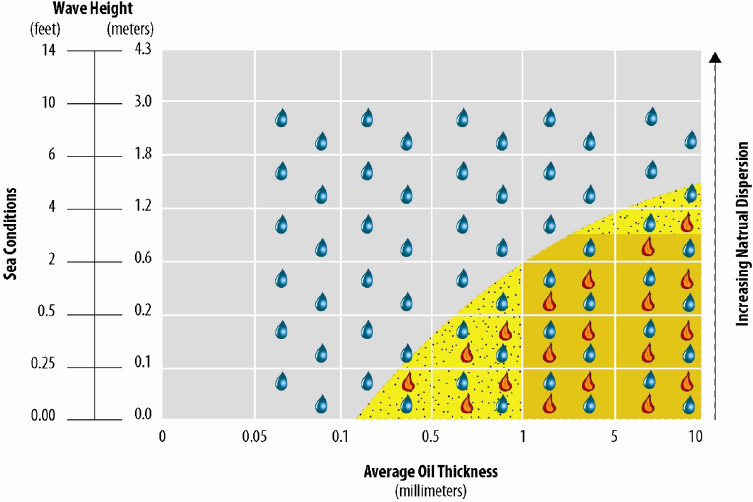
FIGURE 1 Mechanical, in-situ burning, and dispersant efficiencies: Typical windows of opportunity for spill response options.
NOTE: Flame on mustard background represents optimal in-situ burning and mechanical recovery efficiency. Flame on yellow background represents decreasing in-situ burning and mechanical recovery efficiency. Raindrop represents dispersant application window. For mechanical and in-situ burning, variable wave conditions (including short wavelengths) decrease efficiency more rapidly, and the containment boom is essential when average oil thicknesses are less than 2 mm (0.08 inch).
SOURCE: After Allen (1988).
The Genwest report states that contingency planning for a spill event would benefit from an integrated approach to response options wherein techniques are viewed as a part of a larger and adaptable “toolbox.” The committee agrees with this integrated approach. Regulations should clearly encourage best practices both in preparation for and in response to an oil spill. Second only to ensuring the safety of the public and of responders, the primary objective of all spill response efforts is to protect sensitive resources and facilitate rapid recovery of the affected ecosystem. Several techniques—monitoring, mechanical recovery, in-situ burning, use of
dispersants, and shoreline protection and cleanup—are available to oil spill responders. Each of these techniques has its own benefits and drawbacks as well as criteria for optimal use. Together they form an operational oil spill response toolbox or “system of systems.” Access to all of the response techniques and an ability to adapt the response to a rapidly changing environment in a variety of scenarios significantly improves overall response effectiveness and maximizes environmental protection. When selecting the best set of response techniques in each individual case, the committee recommends that the decision be reached through the broadly cited Net Environmental Benefit Analysis, which identifies techniques that would minimize environmental impacts on the ecosystem as a whole (cf. Lunel and Baker, 1999; IPIECA, 2000).
This integrated, or toolbox, approach is especially relevant to BSEE responsibilities, which include a variety of facilities in significantly different operating environments. Calculation approaches for planning purposes similar to the one proposed by Genwest for mechanical recovery of oil could be developed for the use of dispersants and in-situ burning in response strategies for oil spill events and could be brought together under a system-of-systems approach.2
Optimal application of response tools can be achieved via appropriate remote-sensing techniques to direct the recovery equipment to the thickest patches of the floating oil in order to increase overall response effectiveness. Because of considerable thickness differences within and between oil patches that govern oil encounter rates for a skimming system, it is critically important that the best available remote-sensing strategies be implemented so that recovery equipment is used to its maximum potential (Svejkovsky et al., 2012; Anderson et al., 2013). These remote-sensing capabilities can be viewed as yet another “tool” in the response toolbox and perhaps should also be included formally at the response planning stage.
The contexts for the committee’s evaluation of the proposed ERSP approach are nearshore and open ocean scenarios, rather than shorelines or estuarine or inland waterways.3
EFFECTIVE DAILY RECOVERY CAPACITY
As stated above, Genwest was commissioned by BSEE to assess the existing EDRC planning standard and to consider improvements to that standard. Before evaluating the ERSP approach proposed by Genwest, the committee first briefly summarizes the two main limitations of the EDRC method currently used by BSEE and the reasons why BSEE is considering a new planning standard. The Genwest report gives a complete description of the current EDRC methods.
The existing EDRC approach uses an oil handling capacity (i.e., nameplate recovery capacity, a volume rate for the skimmer pump) that is “derated” by 80% to (very roughly) address factors otherwise not considered such as oil encounter rate, operational downtime due to darkness, weather and sea conditions, viscosity, oil/water separation, and the presence of debris.
______________________
2For example, in-situ burning must collect oil in booms in a fashion similar to that of ocean skimmers. Consequently, elements of the ERSP tool are relevant to providing methods to estimate and plan the effectiveness of in-situ burning.
3Though the statement of task refers to “conditions expected to be encountered on the U.S. Outer Continental Shelf,” the committee clarified in discussions with BSEE that the area of BSEE authority extends seaward of the coastline.
Another assumption of the current EDRC approach is that a skimmer’s efficiency remains at the same daily rate over time after a spill. In reality the oil would spread, reducing the oil encounter rate on subsequent days after release.
These two assumptions have the drawback that a plan holder can meet the EDRC planning standard by maintaining a skimmer or fleet of skimmers with an oil handling capacity (nameplate recovery capacity) that, even when derated by 80%, still exceeds any amount of oil for which the plan holder may be responsible in the event of a spill. Possessing skimmers with that amount of oil handling capacity is sufficient to meet the standard; whether the skimmers can effectively recover oil in a given situation and whether the plan holder has adequate storage capacity for the collected oil are not requirements of the standard. Therefore, a plan holder could meet the EDRC planning standard by maintaining skimmers with sufficient oil handling capacity and at the same time not have an effective oil spill response strategy.
Moreover, EDRC was developed following the Exxon Valdez spill of 1989 as a way to quantify the amount of oil that could be recovered by mechanical skimmers, but the Deepwater Horizon spill in the spring and summer of 2010 brought into question the accuracy of EDRC’s assumptions. BSEE established a contract with Genwest to investigate those questions.4
EVALUATION OF THE GENWEST REPORT
In its report, Genwest thoroughly identified the weaknesses of the EDRC approach discussed above and developed the ERSP calculator to address those weaknesses. This section examines the methodology, applicability, and computer model for Genwest’s new ERSP approach for estimating the recovery potential of oil skimmers.
Methodology of the Estimated Recovery System Potential Calculator:
Improvements over Effective Daily Recovery Capacity
The proposed ERSP calculator (Genwest, 2012) addresses many of the concerns expressed with EDRC and reflects the full recovery cycle associated with on-water oil spill skimming systems:
• It estimates an oil encounter rate proportional to a representative oil thickness, swath width of the booms used by the skimming vessel to collect oil, and the advancing speed of the skimming system while working.
• The oil thickness assumed encountered is that of thick (opaque black or true color) oil, which is targeted by skimming operations.
• The oil thickness encountered decreases over time, which is intended to account for spreading of the oil.
• The examples in the Genwest report use the daylight operating period of 12 hours, but users can enter other operating periods.
• The amount of water emulsified in the encountered oil and the water picked up by the skimmer while working are considered as part of the volume of fluids processed by the skimmer system.
______________________
4See the explanation of the EDRC Project on BSEE’s website, available online at http://www.bsee.gov/Research-and-Training/Technology-Assessment-and-Research/Project-673.aspx. Accessed October 24, 2013.
• The calculations account for time to decant collected water.
• ERSP considers the capacity of onboard storage, the number and duration of transits and offload cycles, and the time to derig and rerig prior to and after offloading.
• Two efficiencies are defined to better describe the skimming system’s potential performance:
![]() Throughput Efficiency (TE): percentage of oil/emulsion taken onboard from the volume encountered.
Throughput Efficiency (TE): percentage of oil/emulsion taken onboard from the volume encountered.
![]() Recovery Efficiency (RE): percentage of oil/emulsion in total fluid recovered aboard the skimmer.
Recovery Efficiency (RE): percentage of oil/emulsion in total fluid recovered aboard the skimmer.
• The calculations appropriately do not allow oil recovery based on swath width to exceed the system’s capacity to handle and process the fluids. The Maximum Effective Swath (MES)5 for a given recovery system is achieved when its Total Fluid Recovery Rate (TFRR) (including oil/emulsion and free water) matches its full nameplate recovery potential, i.e., the swath of a response system that results in the collection of oil/emulsion and free water that matches the system’s ability to handle that volume of recovered fluids.
Overall, the strengths of ERSP are that it considers the skimming system (as opposed to a single part of it, the skimmer) and the mechanisms that control the volume rate of removal of oil from the water surface. The user can assess how individual inputs to the calculations of recovery capacity affect and limit the volumes of oil that can be effectively removed from the water surface under ideal operating conditions for a variety of scenarios. This information can be used to improve the planning standard for use of skimmer systems, with the benefit that a regulation based on ERSP would encourage improved response capabilities because it would include more complete and realistic input parameters. It should be noted that the ERSP approach assumes optimal oil recovery for the given input parameters, which will likely lead to a plan with optimistic recovery potential as compared with the realities of an actual spill. An alternative approach would be to build a planning tool upon the results of previous spill recoveries; however, the committee understood that such data are scarce and not reliable.
ERSP assumes thick oil is encountered over the entire swath width and during all times where skimming is operational. The oil encounter rate in ERSP is proportional to what Genwest describes as the nominal average oil thickness, that is, the representative oil thickness or the mean thickness in areas where skimming would occur after spreading for 12 hours (referred to as “Day 1” in the Genwest report), 36 hours (“Day 2”), and 60 hours (“Day 3”).6 The rate is also
______________________
5MES is measured in feet and is computed as
MES = RR × RE/(63.13 × S × OT × TE),
where RR is the nameplate recovery rate (U.S. gallons per minute), RE is the recovery efficiency (unitless number between 0 and 1), S is speed (knots), OT is oil thickness (inch), and TE is the throughput efficiency (unitless number between 0 and 1). The factor 63.13 converts the right-hand side of the equation to feet. However, if the system’s swath is greater than the MES, then the swath that is used for the calculations is set equal to the MES. For the example System A in the Genwest report (p. 60), the nominal swath is 250 feet. On “Day 1,” right after a spill has occurred, MES is 238 feet—less than 250 feet—so the actual swath used for “Day 1” is 238 feet. For “Day 2” and “Day 3” after a spill has occurred, MES is greater than 250 feet, and the swath that is used for calculations is the 250-foot nominal swath.
6See the section “Use of the Unit ‘Day’ for ‘Nominal’ or Representative Thicknesses” for more discussion of this term in the Genwest report.
proportional to the swath width of the collecting booms and the speed of the skimmer. The swath width and vessel speed could be affected by debris, weather, and sea conditions, but these operating assumptions are and can be clearly noted in regulatory documents and user manuals. The oil encounter rate decreases over time in proportion to the representative oil thickness, which is intended to account for spreading of the oil. Thus, the representative oil thicknesses at 12 hours, 36 hours, and 60 hours after oil is released are important inputs to the calculations of ERSP, and the results are sensitive to these input assumptions. Genwest (2012) recommends that the values of 2.5 mm (0.1 inch), 1.3 mm (0.05 inch), and 0.6 mm (0.025 inch) be used as the representative oil thicknesses for these three time intervals, respectively. The thickness at 12 hours, that is 2.5mm, can be used to plan for a continuous or blowout spill.7
Estimation of Representative Oil Thickness
The goal of the analysis of oil thickness for use in ERSP was to determine a “nominal average” or representative thickness, i.e., to represent the total volume of oil contained in an area a skimmer would encounter during an operational period. The Genwest report authors recognize that slicks have a range of thicknesses spanning several orders of magnitude and that oil is patchy in distribution. Computer models, such as the Response Options Calculator (ROC; Dale, 2011; Galt, 2011; Galt and Overstreet, 2011; Genwest, no date) that calculates hourly thickness values based on defined oil and environmental conditions, were considered overly specific for the purpose of a planning tool. However, portions of the ROC model were used to estimate the ranges of oil thicknesses from which a representative value could be chosen for use in the planning tool. The ROC spreading equations were used with a broad range of oil types and environmental conditions to identify representative oil thicknesses for each of three days—that is, “Day 1,” “Day 2,” and “Day 3” in the Genwest report—following a significant spill (typically hundreds to thousands of barrels).
A value for the thickness of encountered oil is key to estimating how much oil may be recovered by a skimming system. However, an exact measurement of the thickness of an oil spill is impossible in most cases, at the very least because the thickness is constantly changing with the passage of time. The committee examined the approach developed by Genwest for estimating oil thickness over time to determine if the model results and ERSP representative thickness assumptions are reasonable for planning purposes. It compared Genwest’s recommended thicknesses to field observations and explored how ERSP addresses the issue of patchiness in estimating skimmer efficiency.
Field Observations. Several authors have evaluated field observational data from spills to estimate initial spreading and the thickness of oil on water under a fairly broad range of conditions and spill sizes. Lehr et al. (1984) reported that 50 bbl of light Arabian crude spread to 0.2-0.3 mm (0.008-0.012 inch) within an hour of the spill and to around 0.1 mm (0.004 inch) after 5 hours. McAuliffe (1987) reported that 10- to 20-bbl experimental releases of crude oils (with oil densities ranging from 0.83 to 0.91 kg/L) on the water surface spread to 0.1-0.2 mm (0.004-0.008 inch) in 15-30 minutes and then spread farther in the next 30 minutes. Allen and Dale (1997) reported that early on the first day after oil was released from the Exxon Valdez onto a very calm sea, the thickness of the spreading Alaskan crude oil averaged 2.5 mm (0.1 inch).
______________________
7A continuous or blowout spill refers to an oil spill that has a continuous source. It is distinct from a “batch” spill, in which a fixed amount of oil is spilled in one discrete spill event.
They summarized spreading as follows. Relatively fresh crudes in temperate or warm waters spread to equilibrium (stable) thickness of about 0.025-0.1 mm (about 0.001-0.004 inch) in minutes. Crude oils on near-freezing water spread quickly to equilibrium thickness of about 2.5-5.0 mm (about 0.1-0.2 inch). Crudes that form emulsions (mousse) do so in a day or two. Most crude oil emulsions on open water have average thicknesses ranging from a few tenths of a millimeter to approximately 10 mm (0.001-0.4 inch).
McAuliffe (1987) asserted that floating oil thicknesses resulting from blowouts would be less than that from surface releases because the oil from a blowout surfaces over a broader area than an initial area covered by a spill onto the water surface. He reported that during the release period (April 1977) of the Bravo Platform blowout in the Ekofisk oil field in the North Sea, a continuous slick 100-200 m wide and 1 km long was estimated to be 1 mm (0.04 inch) thick. During the initial flow of the Ixtoc blowout in the Gulf of Mexico, oil thickness was estimated to be 0.07 mm (0.003 inch) on average. The spilled oil from the Bravo blowout spread on cold water, whereas the oil from the Ixtoc spread on very warm water. According to a report by Audunson et al. (1984), as summarized by McAuliffe (1987), the Statfjord crude oil subsurface experimental release in the North Sea, which simulated a blowout but where an oil and gas buoyant plume did not reach the surface, resulted in the thick part of the slick averaging 0.06 mm (0.002 inch) after 8 hours and decreased to a steady-state thickness (lasting at least 5 days) of 0.013 mm (0.0005 inch). Thus, for blowouts and surface spills, oil thickness has been observed to be initially (during the release and the first day) about 0.1 mm (0.004 inch) thick over warm water, about 1.0 mm (0.04 inch) thick over cool water, and about 2.5 mm (0.1 inch) thick on cold water.
According to Allen and Dale (1997) and the Bonn Agreement (2009), continuous opaque black (or true color) oil exceeds 0.2 mm (0.008 inch) in thickness. The Bonn Agreement is based on extensive review of field observations of the appearance of oil at various thicknesses. Figure III.C-1 in the Genwest report (2012) shows similar thickness ranges for oil appearances. Ocean Imaging Corporation (OI, Solana Beach, CA) has developed an oil-thickness classification scheme for its remote-sensing system deployed on aerial overflights of floating oil, where opaque black/brown oil is greater than 0.09 mm (0.0035 inch). The OI classification system and oil thickness assignments have been verified using large tank studies and field data (Svejkovsky and Muskat, 2009). Emulsions and fresh crude collected in convergences could be up to 10 mm (0.4 inch) thick (Allen and Dale, 1997).
The ROC Model: Are ROC Spreading Results Reasonable? The ROC model runs used in the Genwest report to develop ranges for selecting representative oil thicknesses also included consideration of oil spreading, which Genwest (2012) states is as described in the report by Galt and Overstreet (2011). In Galt and Overstreet (2011), the spreading algorithms provide estimates of differential thickness in contiguous slicks associated with “oil droplet” formation and transport due to wave action and “Langmuir” cells. Operationally within ROC, these thickness correction factors are applied to the weathering model (Galt, 2011) results. However, after committee discussions with the Genwest report authors, it was confirmed that only oil droplet formation due to wave action is included in the runs used for the representative oil thickness estimation. Consideration of Langmuir cells was not included because the scale of that effect was considered smaller than the scale of the swath width of a skimmer. Further discussion of the ROC spreading algorithms is provided in Appendix A.
The ROC model results are not consistent with the field observations described above because the ROC results focused only on thick oil. Although the spreading model used does not include thickness corrections for Langmuir circulation, it does account for the accumulation of oil on the leading edge of the slick due to wind and wave action. The Genwest report selects three “nominal average,” or representative, oil thickness of 2.5 mm (0.1 inch), 1.3 mm (0.05 inch), and 0.6 mm (0.025 inch). These thicknesses are much larger than what was observed for the average thickness of black oil as reported in Genwest (2012, on pp. 27-28):
When spreading oil reaches a relatively stable condition where additional spreading is reduced considerably (sometimes referred to as “equilibrium” condition), average oil thicknesses may range from a few hundredths of a millimeter to a few tenths of a millimeter. . . . Emulsions, viscous oils, and even light-to-medium-weight crude oils spilled into very cold waters will often achieve a thicker stable “equilibrium” condition that may be nearly one to several millimeters in average thickness. These so-called “stable” thicknesses may not last long depending on the wind and sea conditions and on the oil’s tendency to spread, emulsify, evaporate, and degrade. The important point is that crude oils, especially dark crude oils, will typically appear dark (or “true” in color) at these stable thicknesses and thicker.
Despite the inconsistency, the committee found the ROC results to be representative estimates for the thickness of the thickest oil at the leading (downwind) edge of slicks because the estimates agree with potential thicknesses for oil patches in the field under some useful conditions. On the other hand, the potential extent and patchiness of the thickest oil are not addressed in the ERSP calculator.
Discontinuous Thick Oil Distributions: Patchiness. As acknowledged by the Genwest report authors, the oil thicknesses based on ROC model results do not reflect the wide variability of oil thicknesses and discontinuous oil distributions possible in an ocean environment (e.g., patches, streamers, and windrows). However, the report states that they do “represent reasonable ‘nominal’ average thickness values for use in developing ‘planning standards’” (Genwest, 2012, p. 3). The implicit assumption in the ROC model runs that the thickest oil would be the focus of and be available to skimming operations for an order of 12 hours per day (presumably for all of the skimming systems deployed) depends on an assumption that surveillance and spotting capability would be available within hours of spill notification and at a frequency through the operational period sufficient to inform the vessels of the locations of thick oil. In addition, the skimming vessels are assumed to be able to find the thick oil at all times during operational periods. Finally, the approach implicitly assumes that thick oil is concentrated or contiguous in space, such that skimmers can continually encounter oil during their operational periods.
As noted by Genwest (2012), for a given skimming configuration, the total area that could be swept in a 12-hour workday is on the order of a square mile (2.6 km2) for most large skimmer systems.8 Expecting that onboard storage could handle the oil and water volume collected (perhaps after modification to optimize the system), this suggests that continuous thick
______________________
8A skimmer system with a “Maximum Achievable Swath” of approximately 1,000 feet would sweep about 2 square miles (5 km2) in 12 hours, collecting 81,000 bbl of oil if the oil is assumed to be 2.5 mm (0.1 inch) thick (i.e., “Day 1”). Small skimmers (100-foot swath width, speed 0.75 knots) would sweep about 0.2 square mile (0.5 km2) in 12 hours (collecting 8,000 bbl of oil if the oil is 2.5 mm thick).
oil would be available for skimming in areas of these scales. The thick-oil area could be in large patches or long windrows with a width similar to the swath width, but patchiness within the scale of 0.2-1 square mile (0.5-2.6 km2) is not accounted for in the ERSP calculator and, as a result, the oil thickness used is an overestimate for such patchy oil.9 For a very large batch release, contiguous oil areas could be quite large on “Day 1,” but by “Day 2” or “Day 3,” the oil would be quite patchy in distribution, requiring transits between patches during an operational period.10 This would effectively lower the average oil thickness encountered.
For example, the Deepwater Horizon blowout in the spring and summer of 2010 in the Gulf of Mexico provided field evidence of the patchiness characteristics of an oil spill, with large areas of thick oil and emulsions being observed. Svejkovsky et al. (2012) reported that they used multispectral aerial imagery (Svejkovsky and Muskat, 2009) taken during overflights to classify and map observed floating oil into three thickness categories and to identify and map emulsions. They classified thick oil as greater than 0.09 mm (0.0035 inch), discontinuous or thinner oil as 0.016-0.08 mm (0.0006-0.0031 inch), and sheen as 0.008-0.015 mm (0.0003-0.0006 inch). One example map product for oil imaged near the source on May 6, 2010 (Svejkovsky et al., 2012, Plate 1b) was gridded by the committee using a cell size equivalent to a mid-range estimate of 1.6 km2 (0.6 mi2) swept by a skimmer in 12 hours. The maximum area of thick oil (greater than 0.09 mm [0.0035 inch]) in any single grid cell was 41% of the cell; with neighboring cells containing somewhat less oil coverage (30-39% in the closest four cells). The 20 grid cells with the highest areas of thick fresh oil (which were not contiguous) ranged in coverage from 5% to 41% of the 1.6-km2 (0.6-mi2) area. These observations were of oil near the spill site and within hours of release. For apparent emulsions, the results were similar: 30-44% of the six grid cells with the highest emulsion areas were covered by this oil type. Although the six grid cells with the highest coverage were not contiguous, 56 grid cells contained at least 5% coverage of emulsions. Emulsions were observed close to the source, so, although weathered, they could have been hours old or possibly up to a few days old if the oil was not transported far from the well. Based on the analysis of the Svejkovsky et al. (2012) image of May 6, 2010, thick oil patches might cover about 5-20% of the water surface in areas of concentrated oil away from the release point (i.e., in areas of “Day 2” or “Day 3” oil).
The ROC model results were compared with those from other oil spill models, as summarized by Genwest (2012, Figure III.C-6). However, the comparisons are most likely not based on similar evaluations of oil thickness. The problem is in the differences in scale over which the oil thickness was averaged and whether patchiness was included. For ROC, as noted above, the thickness was taken as the maximum thickness in the leading edge of a contiguous oil slick. For SIMAP,11 the model predictions of the oil distribution, including patchiness, at each time after an instantaneous spill were gridded, and the oil volume (not including water in emulsions) falling in a grid cell was divided by the cell area to generate an average thickness. These runs were made by W. Konkel of ExxonMobil (Genwest, 2012) using the default gridding scheme where grid sizes increase in time as the oil spreads (N. Mulanaphy, Applied Science Associates, personal communication): each time step, the total area covered by oil is divided into
______________________
9At a larger scale, patchiness can be identified by spotters, planes, or satellite.
10“Day 2” and “Day 3” oil would be farther from the spill site, depending on wind and currents. Assuming wind transport of 3% of wind speed, winds of 5-20 knots, and negligible current speed, oil would be transported about 6-16 km (2.5-10 mi) in 24 hours. Considering currents, “Day 2” and “Day 3” oil would likely be greater than 16 km (10 mi) from the release site and thick oil patches would be sparser than near the source.
11A more appropriate citation for the SIMAP model than the one used by Genwest (2012) is French-McCay (2004), which contains descriptions of the model’s algorithms.
50 by 50 rectangular cells of equal size, and the mean in each cell is calculated. Those grid cells range in size from a few to many square kilometers, thus at a scale appropriate to the skimmer’s expected swept area in a 12-hour operational period. The SIMAP results are lower by about a factor of 10 than those from the ROC runs, which would be expected given these differences in the calculations and that emulsion water was not included in evaluating thickness. Details of the OSCAR12 and SLROSM13 model runs in the Genwest report were not available, and so the differences in these model results from ROC and SIMAP results could not be evaluated.
Improvements to Estimates of Representative Oil Thickness in the ERSP Calculator. The proposed representative oil thicknesses in the Genwest report fall within the range of observations for opaque black oil and emulsions after spills, as summarized above and considered in the Bonn Agreement (2009). The Genwest (2012) report contains a good summary figure of oil thickness and appearances (Figure III.C-1) consistent with the Bonn Agreement (2009) and field observations.
However, the weakness of the ERSP application as described is the sensitivity of the results to these assumed thickness values, given the wide variability of estimates (orders of magnitude) from models of unclear details and assumptions. The Genwest (2012) analysis did not consider the scale of the thick oil areas and patchiness, so it probably overestimates the oil encounter rate for “Day 2” and “Day 3” of the response to a batch spill (and a response away from the source for a continuous release). The Genwest approach is more appropriate for “Day 1” response to a batch spill or a near-source response to a continuous spill where large areas of contiguous oil are available for skimming operations.
Depending on the oil release volume (worst-case discharge) on a single day (considered as a batch spill during one instant), the contiguous oil slick could be considerably smaller than the square mile (2.6 km2) expected to be swept by most large skimmer systems. In addition, the thick leading edge would be a small fraction of the contiguous oil slick (see Figure III.C-3 in Genwest, 2012). Thus, the expected patchiness and extent of the thick oil should be considered in evaluating oil encounter rate.
As noted above, observational data after many spills indicate that, on “Day 1,” the equilibrium thickness of 0.1-2.5 mm (0.003-0.1 inch) is reached in minutes to hours. The proposed “Day 1” thickness of 2.5 mm (0.1 inch) seems too thick for warm waters but appropriate on cold waters. Thus, the committee notes that the “Day 1” thickness could vary by (typical) water temperature of the location of interest and be based on observations: 0.1 mm (0.004 inch) thick over warm water, 1.0 mm (0.04 inch) thick over cool water, and 2.5 mm (0.1 inch) thick on cold water.
Patchiness could be accounted for in ERSP using either one of the following two approaches:
1. The thickness of the targeted thick oil would be assumed constant day-to-day after being released, and the percentage of patchiness expected on each subsequent day (i.e., for days 1, 2, and 3 after release) would be entered as an input. Within the
______________________
12OSCAR Model Description. Available online at http://www.sintef.no/Materialer-og-kjemi/Marin-miljoteknologi/Miljomodellering/Modellverktoy/OSCAR-Oil-Spill-Contingency-And-Response/Model-Description/. Accessed August 27, 2013. See also Reed et al. (1995).
13The SL Ross Oil Spill Fate and Behavior Model: SLROSM. Available online at http://www.slross.com/publications/SLR/Description_of_SLROSM.pdf. Accessed August 27, 2013.
model calculator, the average encounter thickness is then calculated as the thick-oil thickness multiplied by the fraction of the swath that is actually oil (i.e., the patchiness factor for the day after the release).
2. The mean thickness encountered in the skimmer’s swath width could be reduced each subsequent day by factors accounting for increasing patchiness on days 1, 2, and 3 after release. This is similar to the Genwest report’s approach, except that the decline in thickness would account for patchiness.
As to what might be reasonable estimates for the degree of patchiness, the committee’s preliminary calculations using imagery collected by OI on May 6, 2010, provide an example. Estimates for oil greater than 0.1 mm (0.004 inch) thick indicate a maximum of about 40% thick oil, so using approach 2 (given above) a reduction of average thickness on day 1 after release to 0.4 times the thick-oil thickness might be reasonable. Using approach 1, the thick-oil thickness would remain constant and the patchiness on day 1 after release would be entered as 40%. The degree of patchiness within areas containing thick oil on days 2 and 3 after release would be more substantial and control the actual average thickness encountered, while the thick-oil patches could still be similar to those on day 1 after release. The 50% reduction of the mean thickness by “Day 2,” and another 50% reduction from “Day 2” to “Day 3” suggested by the Genwest results seem too modest a decline. Following approach 2, using the percent cover in the OI data farthest from the source, a factor of 20% (i.e., 0.2 times the thick-oil thickness) on day 2 after release and 5% (i.e., 0.05 times the thick-oil thickness) on day 3 after release seem appropriate. Following approach 1, the degree of patchiness would be 0.4 on day 1 after release, 0.2 on day 2 after release, and 0.05 on day 3 after release. The various thickness values given above and the means to estimate them are illustrative of the variability in spills over time and in patches. Because of the expected variability in appropriate inputs for varying conditions and oil types, the committee suggests that the users of an ERSP calculator be able to enter the required data as appropriate to the planning scenario(s) for the conditions of spill volumes, oil types, and environmental conditions covered by the response being planned. Further, the committee believes that BSEE should provide scenario-based guidance for developing patchiness values and/or selection of representative oil thickness values for use in response planning. These scenario-based values—not too many choices for the user but more representative of the conditions expected—could be provided in the user manual discussed later in this letter report and would provide an auditable result for plan holders.
Applicability of the Estimated Recovery System Potential Calculator
In this section, the committee focuses on the applicability of the units, variables, and terminology used in the Genwest report, as requested by BSEE.
Use of the Unit “Day” for “Nominal” or Representative Thicknesses
The Genwest definitions and use of the terminology “Day” are consistent throughout the report on ERSP. The Genwest motivation for using “Day” as a proxy for unit of oil thickness seems to reflect the practical consequences of deploying mechanical skimmers in a staged manner during the first few days of a spill response to emphasize the diminishing returns from an individual skimmer system as a slick continues to spread. However, this terminology, while
referring to an important physical process, does not lend itself to general public comprehension, particularly for a continuous spill event. The committee suggests using the terms “Day-1 Thickness,” “Day-2 Thickness,” and “Day-3 Thickness” to provide more clarity and consistency. The rationale for using only “Day-1 Thickness” for a continuous spill is that fresh oil is available continuously near the source, and response vessels are likely to target fresh oil for daily recovery. For such a scenario, “Day-2 Thickness” and “Day-3 Thickness” can refer to oil that has drifted away from the source and is correspondingly 2 or 3 days old (spread out), although these values are not likely to be used in calculations for a continuous release for the reason stated above. The committee believes that greater clarity can be achieved by always referring to the “thickness” of the oil in connection with “Day” and allowing a user to input actual values or ranges of “representative oil thickness” specific to the operational environment for a specified scenario.
Possible Improvements to Estimating Skimmer System Capacity in ERSP
In evaluating the proposed ERSP approach, the committee agreed that Genwest designed a tool that could be used on most of the response scenarios that are of interest to BSEE. Genwest incorporated data for several types of crude oils, factored in possible release volumes and weathering processes, and created a model that could be used for both instantaneous (“batch”) and continuous releases. However, there are many input parameters in the model that could be improved and several components of the process of recovery that ERSP does not address.
With regard to the input parameters in the ERSP calculation, some can be objectively verified but several rely on professional judgment, which may not be easily predicted or verified prior to the response or even during the actual response. BSEE should consider removing the most uncertain parameters from the ERSP calculation or should provide defaults to and specific instructions on how those parameters could be selected within certain planning scenarios. For example:
• Nameplate recovery capacity: A significant improvement in estimation of an optimum skimmer performance for selection of equipment and response planning purposes could be made by replacing the derated nameplate recovery capacity parameter with a value based on ASTM F2709-08, Standard Test Method for Determining Nameplate Recovery Rate of Stationary Oil Skimmer Systems. This test method establishes test conditions that result in actual measured nameplate recovery rate of a skimming system floating on water and recovering oil under standard conditions. This test also provides an indication of the combination of test parameters (oil type, viscosity, operating speed) that result in the highest average performance for the tested skimmer system and includes the option for determining recovery efficiency (a ratio of oil volume recovered to the total volume of recovered fluid). Though this value is only for a controlled setting (e.g., no waves, wind, or currents), it provides a better standard baseline14 across all skimmer designs and a more realistic indication of skimmer performance than does the current practice of derating nameplate recovery capacity by 80% in the EDRC approach.
______________________
14An analogous example could be mileage ratings for vehicles. Because of a number of input parameters— for example, driving speed, road conditions, operator habits—every vehicle rated for 25 miles per gallon does not always have that exact fuel economy. However, the input parameters are complete and realistic enough to ensure that vehicles rated for 25 miles per gallon have a better fuel economy that vehicles rated for 20 miles per gallon.
• Emulsion proportion: Defined as the percentage of water in the emulsion being encountered, this parameter is set to 0 as a default. Although users of the ERSP calculator can modify it, this value changes with time as oil weathers and is difficult to predict even during an actual spill. Water content in a crude oil emulsion can range between 0 and 90% depending on the initial oil properties, weathering degree, and environmental conditions. Usually the amount of free water collected by a skimmer exceeds the amount of water in the emulsion. For simpler planning purposes, BSEE could consider eliminating this parameter (defaulting it to 0 in all calculations) or, for more utility, could specify discrete values that should be entered for a small set of planning scenarios as a function of an oil type and weathering duration to ensure consistency between response plans and audits. Alternatively, BSEE could let a plan holder use data from weathering and emulsification studies for the actual oil, if those are available and verifiable.
• Recovery efficiency: The Genwest report offers two charts in its Appendix C for the estimation of skimmer recovery efficiency as a function of oil viscosity and sea conditions that were developed on the basis of the authors’ professional experience. The recovery efficiency derived from the charts could be used as an input to the ERSP calculator. However, because neither oil viscosity nor sea condition is currently taken into account in the ERSP calculations, it is not clear how users would select other values or how BSEE would verify these numbers. One possible solution to simplify and standardize this calculation for planning purposes could be to set it at a specific value of 100% for all skimmers or to specify several discrete numbers that would correspond to a specific skimmer configuration and planning scenario. Alternatively, BSEE could let a plan holder use the data from the actual skimmer tests if those are available. Tests based on ASTM F2709-08, Standard Test Method for Determining Nameplate Recovery Rate of Stationary Oil Skimmer Systems, or ASTM F631-99 (2008), Standard Guide for Collecting Skimmer Performance Data in Controlled Environments, could help to determine this parameter.
• Throughput efficiency: This input is the percentage of oil/emulsion taken onboard from the volume encountered by the skimming system. Some oil collected in the boom indeed could be lost, for example, as a result of wave action or faster-than-recommended towing speeds. It is not clear how users would select this parameter especially because, for planning purposes, wave height is not a consideration in this calculator. Excessive towing speed could be avoided by specifying a speed that should not be exceeded. For simplicity, BSEE could consider fixing this parameter at 100%, assuming that all oil that entered the boom will eventually be recovered by the skimmer, or suggest some other discrete values by planning scenarios described in a user manual discussed later in this report that could be easily understood by users and verified by BSEE.
The proposed ERSP approach can be used when no site-specific information is available. BSEE could consider allowing the user to modify the calculation if the user is willing and able to offer reliable, verifiable, and scenario-specific information that could increase estimation accuracy. A user manual by BSEE could describe a small number of different scenarios for use in planning that have values of key parameters in the calculator for each case. The committee makes this same point for other reasons in the following section on the ERSP computer model.
Both the EDRC and the ERSP approaches assume that skimming systems are operated by skilled personnel capable of adjusting system settings to reflect recovery conditions.15 They also assume that recovery vessels can quickly maneuver between oil patches and remain in the thickest oil for most of the active recovery. Although the latter is a reasonable assumption for worst-case discharge response scenarios, it may be less applicable to the recovery of smaller spills.
Safety is a primary consideration in the response, so outcomes of the proposed ERSP calculations need to be evaluated for operational feasibility. For example, if the ERSP calculator were to indicate that many small recovery vessels could accomplish the desired recovery rates, logistics and safety considerations could limit their applicability in remote offshore areas.
As discussed earlier, using a representative oil thickness could simplify the calculation, but at the same time it would not take into account the release volume and scenario, oil type, and environmental conditions and could result in modeling outcomes considerably different from the situation expected in the field. Some notable examples are:
• Effect of release scenario. Oil spreading from a point source at the water surface (when an initially thick, concentrated oil slick is spreading and thinning with time) can be significantly different from the spreading of oil from a subsea blowout (especially in deep water), when a rise of oil droplets is affected by the subsea currents and turbulence, resulting in a relatively thin slick with a larger footprint forming at the surface even before surface spreading processes begin to affect it. A subsea blowout with medium to heavy crude oil in relatively shallow waters could behave similar to a point-source surface spill, when a continuous stream of oil available for mechanical recovery in the vicinity of the source could have higher slick thickness and a narrower initial footprint and hence offer an opportunity for more effective recovery than would be predicted by a representative thickness taking into account oil spreading.
• Effect of oil type and temperature. In the case of a spill of a relatively light oil, a significant portion of it would disperse and evaporate naturally. The remaining slick may be so thin that mechanical recovery would not be effective. Other response options would need to be considered in this case. In general, a spill of a very light product in a warm climate will undergo faster spreading and weathering and potentially form a thinner slick than a heavier oil released in an Arctic environment. As described in the methodology section, the difference in slick thickness for these two scenarios could be several orders of magnitude, and hence skimmer encounter rates would vary considerably.
• Effect of sea state. The sea state plays an important role in the oil state and its spatial distribution. Wind and waves accelerate the spreading of oil on the water surface, and waves cause the entrainment of oil into the water column. Wave breakage is the major mechanism for oil droplet formation.16 An expedient means to assess the sea state is
______________________
15A scenario in which the assumption of skilled personnel may not be appropriate is the case of using vessels of opportunity to recover oil. Response plans that rely on vessels of opportunity may have “start-up challenges” for a spill response, resulting in an initial recovery reduction factor for skimming systems that will diminish as experience is gained. This initial reduction in recovery may not occur with vessels of opportunity that have documented annual exercises with dedicated Oil Spill Response Organizations.
16Plunging breakers (when the wave crest curls over the water surface and enters it forward of the wave, typically accompanied by white caps) are capable of tearing thick oil and some emulsions into small oil droplets. However, spilling breakers (when the water surface forms a ridge followed by a forward collapse of the crest; no
through use of the Beaufort Wind Scale,17 which correlates the wind speed with the wave height and visual appearance of the sea surface. More involved assessments rely on the wave spectrum and the wave “age” (Hasselman et al., 1973; Phillips, 1977; Glazman, 1994). However, the effects of waves on oil droplet formation and entrainment are not fully understood.18
The committee believes that a relatively small number of scenarios can be adopted that capture these variations well enough for planning purposes. Together with guidance provided by BSEE on the selection of appropriate scenarios for a particular response plan and values of key calculator parameters provided in the chosen scenario(s) of a user manual, better response plans can be achieved.
Implementation of the Estimated Recovery System Potential Calculator Computer Model
The committee was asked to assess whether the assumptions used by Genwest in its computer model were correct and adequate for the purpose of developing a planning standard. The committee also examined whether an error entered into the computer model would be compounded by the model’s structure and how the model addressed uncertainty related to input values.
Model Calculator
The ERSP model is implemented using facilities of the jQuery library for JavaScript. The calculation of the values of the 20 quantities listed in the examples of output (e.g., in Figure App. B-1 of the EDRC report) is defined by 20 equations.
The committee has implemented the equations independently of the original using facilities of the R environment for statistical computing and graphics.19 It attempted and was able to reproduce the output of the ERSP calculator for System A, System A-MES, System A-MES-Decant, and System C listed in various figures of the report, which the committee took as sufficient evidence that the calculator works as represented in the Genwest report.
There are occasional mismatches between the way the equations are specified in the Genwest report and in the JavaScript source code. For example, on p. 127 in the calculation of “Time for 1 Full Cycle,” the closing parenthesis is misplaced because “Transit Time” is
__________________________________________________________________
white caps are formed) are more frequent, and they can generate oil droplets of various sizes. In addition, the orbital motion of waves accompanied by turbulent diffusion has the potential to entrain oil droplets into the water column (Boufadel et al., 2006). Approaches to account for the breakup and entrainment of oil droplets into the water column have been presented by Mackay et al. (1982) and Delvigne and Sweeney (1988). Mackay et al. (1982) assumed that dispersed oil results from the sum of two dispersion rates, one due to breaking waves and another due to nonbreaking waves. Delvigne and Sweeney (1988) developed a formula based on wave tank studies and predicted that breaking waves are the major mechanism causing oil dispersion (i.e., formation of small droplets) and entrainment in the water column. Li et al. (2009) presented wave tank results correlating the droplet size distribution of oil to the mixing intensity due to waves.
17Beaufort Wind Scale. Available online at http://www.spc.noaa.gov/faq/tornado/beaufort.html. Accessed September 3, 2013.
18For example, small choppy waves generate more droplets than large waves propagating smoothly (i.e., swell). However, the latter could entrain the oil deeper into the water column. This explains why the formulations provided Mackay et al. (1982) and Delvigne and Sweeney (1988) persist.
19The R Project for Statistical Computing. Available online at www.r-project.org. Accessed August 27, 2013.
expressed in minutes, not in hours; in the calculation of the “Area Covered in Op Period,” one should multiply, instead of divide, by 60; and in the calculation of “Total Volume of Oil/Emulsion Recovered/Operating Period,” the factor 1.43 is missing that should multiply “Water Retained Rate.” However, the Genwest report does not explain the meaning of the factor, “1.43.”
The committee recommends that the equations of ERSP be typeset unambiguously, accompanied by a clear definition of variables and their units of measurement and also by a succinct explanation of the rationale for the modeling assumptions and choices that are made. The equations should then be exposed to the community of remediation experts for public examination and suggestions for improvement. The committee believes that such exposure will improve the model in the long term and also promote its acceptance and use by the target community.
Uncertainty and Compounding of Errors
BSEE asked the committee to evaluate whether errors entered into the ERSP calculator were compounded by the model. The committee interpreted this question as follows: How do uncertainties about the inputs propagate to the output?
To answer this question, the committee used the aforementioned independent implementation of the ERSP calculator that it developed with a very simple Monte Carlo method that is widely used for uncertainty analysis (described, for example, by Morgan and Henrion, 1999). It is very easy to augment the ERSP calculator so that it propagates user-specified uncertainties associated with the input quantities. This augmentation may just as easily accommodate uncertainty associated with the thickness of the oil—an uncertainty that conceivably may originate for multiple reasons as described earlier.
The idea is to apply perturbations to the inputs that are commensurate with the associated uncertainties and to compute the corresponding value of the output. Repeating this process a large number of times, a user can obtain a sample probability distribution that characterizes the uncertainty associated with the output, which may then be summarized (in the form of either a standard deviation or a confidence interval). This may be accomplished in the calculator itself without requiring specialized knowledge by the user.
Consider System C, for example, as defined in the Genwest report (Figure III-E5, p. 70). Suppose that the uncertainties associated with the following inputs amount to 10% of their nominal values: Emulsion Proportion, Speed, Decant (proportion of free water taken on board that is decanted), Decant Pump Rate, Discharge Pump Rate, Transit Time, Rig/Derig Time, Throughput Efficiency, and Recovery Efficiency. Suppose further that the corresponding “perturbations,” or “errors,” that are added to the nominal values are modeled as Gaussian random variables with means 0 and standard deviations equal to those 10% of the nominal values (with the additional constraints that proportions shall be truncated to the interval [0,1] and that all quantities must be nonnegative).
The resulting relative (1-sigma) uncertainties associated with ERSP (Total Volume of Oil Recovered per Operating Period) are 10% for “Day 1,” 13% for “Day 2,” and 14% for “Day 3.” If, in addition, the user entertains uncertainties for representative oil thickness and models these uncertainties using a lognormal distribution with mean and standard deviation equal to those of the three thickness values considered in the report (2.5 mm [0.1 inch], 1.3 mm [0.05 inch], and 0.6 mm [0.025 inch]), then the relative (1-sigma) uncertainty of the ERSP calculation jumps to 40%. These illustrative uncertainty assessments are based on 100,000 sets of “perturbations”
applied to the variables whose uncertainty has been propagated. This required modest programming and computational effort20 that could be built into a planning calculator.
As a further example, instead of specifying particular values for the representative oil thickness on the 3 days that it contemplates, the ERSP calculator could say that the average Day-1 Thickness of oil is like an outcome of an exponential random variable with mean 2.5 mm (0.1 inch) and that the simulated actual Day-2 Thickness and Day-3 Thickness are obtained by successive halving of the thickness on the previous day.
More generally, by explicitly accounting for uncertainty associated with all the other model inputs (which the user may indicate by entering into the calculator the relative uncertainty associated with each of them), the calculator will in fact entertain ranges of values around nominal values instead of requiring that the user commit to specific, individual values. For example, the user may indicate that the representative Day-1 Thickness of oil is 1.91 mm (0.075 inch) with relative uncertainty of 25% or that the transit time for the skimmer is 30 minutes with relative uncertainty of 50%.
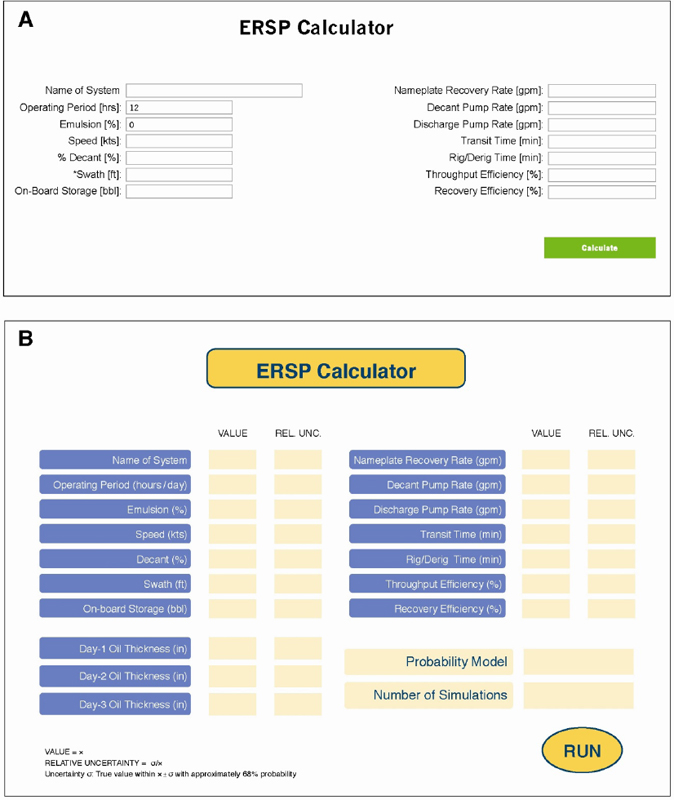
If the means to specify relative uncertainties were added to the ERSP calculator, a possible graphical user interface (GUI) could be as shown in Figure 2B, a modification of the calculator’s current GUI (Figure 2A). A user manual containing guidance for the ERSP calculator together with a small set of planning scenarios with key calculator parameters for each scenario could also contain guidance with examples for specifying these uncertainties. Alternatively, BSEE could let a plan holder use uncertainty values from other sources that can be verified, if those are available and documented.
______________________
20This example, which includes consideration of uncertainty for oil thickness, took 8.5 seconds to run on a Dell Latitude laptop computer equipped with an Intel Core i7 CPU @ 2.8GHz and 8 GByte of RAM, running under the Windows 7 Enterprise operating system.
CONCLUSIONS AND RECOMMENDATIONS
In summary, the committee finds that the current EDRC method for planning standards in oil spill preparedness is in need of substantial update and that the framework offered by the ERSP calculator is a good basis for doing so. Unlike EDRC, ERSP reflects the full recovery cycle associated with on-water oil spill skimming systems. In the committee’s judgment, the Genwest report is soundly based in all of its key respects, but there are several important possibilities to augment the methodology and its application that would lead to a better overall BSEE planning standard for oil spill preparedness and response.
The committee agrees with the Genwest report authors that simplification is desirable for use in a planning standard and that the computer models discussed, including ROC and other model results that might be used to characterize oil thickness under a variety of release rates and conditions, are often more complex than could be readily handled or generally understood by the regulators and contingency plan developers. However, the committee has illustrated and tested a simple, straightforward means to incorporate uncertainties of the values of input parameters for the model which then propagate to uncertainties in the outputs, including oil thicknesses.
The utility of the ERSP estimation can also be significantly increased if the user is allowed to select values based on the actual oil properties and skimmer performance studies for a set of BSEE-provided scenarios in a user manual. These values would include emulsion proportion, recovery efficiency, and throughput efficiency. As noted in Appendix C of the Genwest report, data of actual inputs for these parameters are unavailable or difficult to obtain. Therefore, the scenarios can be based on ASTM F2709-08, Standard Test Method for Determining Nameplate Recovery Rate of Stationary Oil Skimmer Systems, instead of the derated nameplate recovery capacity. Though the ASTM standard is optimistic because of its controlled setting, it provides a more realistic indication of skimmer performance as well as a better standard baseline across all skimmer designs than does the current practice of derating nameplate recovery capacity by 80% in the EDRC approach.
If some discrete default values for the parameters are suggested by BSEE, the committee recommends that the final version of the calculator include a succinct explanation of the rationale for the modeling assumptions, a discussion of uncertainties associated with these parameters, and guidelines for user-chosen inputs. The new document, a “User Manual,” would be targeted to potential users of this calculator and would be focused on use of the calculation methodology and interpretation of the results rather than on an explanation and justification of the calculator.
The user of the planning calculator could be given different options for entering estimates of oil thickness. One option is for the user to enter representative oil thickness estimates for each day. The committee suggests the use of the terminology “Day-X Thickness” to avoid confusion between a unit of time and a unit of measurement. “Day-X Thickness” could vary by (typical) water temperature of the location of interest and be based on observations; for example, “Day-1 Thickness” could be 0.1 mm (0.004 inch) thick over warm water, 1.0 mm (0.04 inch) thick over cool water, and 2.5 mm (0.1 inch) thick over cold water depending on the planning scenario(s). Another option is to accept the Genwest representative values with their assigned uncertainty estimates. A third option is to enter one representative oil thickness to be multiplied by an input parameter accounting for patchiness for each day. Patchiness could be accounted for by a factor reduction. The degree of patchiness within areas containing thick oil on “Day 2” and “Day 3” would be more substantial and would reduce the actual average thickness encountered, while the thick-oil patches could still be similar to those on “Day 1.” Using the percent cover in the Ocean Imaging data farthest from the source, a factor of 20% (i.e., 0.2 times the thick-oil thickness) on
“Day 2” and 5% (i.e., 0.05 times the thick-oil thickness) on “Day 3” seems appropriate for this option. The committee recommends that such inputs be a scenario-based user input with assigned uncertainties expressed as confidence intervals under guidance from the above user manual.
The committee wishes to emphasize—as also described by Genwest—that, given that the ultimate goal is to minimize adverse impacts of a spill on the environment (not simply to collect as much spilled oil as possible), the overall approach is best seen as a “system of systems” response in which mechanical oil skimmers are but one of several “tools” to employ. Indeed, the utility of skimmers can diminish rapidly and be of much less value than other response options as the spill gets older (for a “batch” spill), moves farther away from the source (for a continuing discharge), or occurs farther offshore (potentially higher winds and waves). A systems approach should be clearly and simply embodied in planning standards to encourage utilization of the best available response techniques and to facilitate flexible response plans that would allow a plan holder to adapt in a rapidly changing actual spill response environment. As an example, the United Kingdom’s primary response technique for spills in the North Sea is the aerial use of dispersants because of the great distance from shore and typically severe sea conditions (see Chapter 6 and Appendix J in Maritime and Coastguard Agency, 2012). Any overall U.S. planning standard would be strengthened by including the possibility of such a planning scenario under similar conditions. For example, the proposed ERSP calculator as well as the regulatory accepted Dispersant Mission Planner 221 (or similar tool) could become components of such an integrated approach for better contingency planning.
For clarity and reference, the committee gives direct responses to the specific questions posed in the statement of task in Box 1.
______________________
21Dispersant Mission Planner (DMP2). Available online at http://response.restoration.noaa.gov/oil-and-chemical-spills/oil-spills/response-tools/dispersant-mission-planner-dmp2.html. Accessed November 11, 2013.
BOX 1
Short Responses to Statement of Task Questions
Methodology
Are the methods used to estimate an oil skimming system necessary and scientifically sound?
Examining the oil skimming system, rather than the skimmer alone, is a necessary and important improvement that ERSP makes over EDRC. The methods used in ERSP to estimate a skimming system’s capabilities are basically sound and based upon available knowledge. A strength of ERSP is that it considers the mechanisms that control the volume rate of removal of oil from the water surface. That said, improvements can be made to estimating the input value of several parameters, including oil thickness and/or patchiness, by making all available for user input based on a set of specified scenarios. Of course, default values can be available to the user as well.
Does the proposed three-day model address conditions expected to be encountered on the U.S. Outer Continental Shelf?
The ERSP model’s use of 3 consecutive days of “nominal” or representative oil thicknesses applies best to open water (including most nearshore) conditions and batch releases, the majority of area and spills under BSEE responsibility. It does not account for shoreline within the operational area.
Are there any data or methodological gaps that would preclude the use of this report for decision making? If so, how should they be addressed?
The ERSP model focuses only on one tool in the response “toolbox”—mechanical skimming. For skimming purposes, it can guide decision making by BSEE for planning standards, but encouragement of best practices and better planning will require similar tools for other response options as discussed in this letter report. These calculators should be used together in the integrated approach to better illustrate availability of response options.
Can this report and associated computer-based methodology be used as a scientifically credible source to appropriately support rule-making?
The methodology and model can be credibly used to support BSEE rule-making for skimmer response planning standards, but improvements to the calculator should be conducted before rule-making is initiated. A number of specific recommendations and suggestions are contained this letter report.
Applicability
Does Genwest’s use of units throughout the report align with the actual factors?
Within its report, Genwest uses consistent units that align with common industry terminology. Some of the details for parameters within the calculator itself need to be more carefully explained. If BSEE adopts ERSP or some improvement of it, the committee recommends that the adopted version be published and accompanied by a detailed user manual that would easily avoid the present shortcomings and open a path for future calculator improvements.
Are the variables used to determine a system’s efficiency properly defined?
The variables used in the Genwest report to determine a system’s effectiveness for planning standards are properly defined. Steps can be taken to improve the values associated with these variables and/or to make them available for user input as described in this letter report.
Is the use of the unit “Day” to describe thickness an appropriate metric?
The use of the term “Day” addresses the important practical planning issue that the nominal average or representative oil thickness encountered in the area swept by a skimmer will decrease on subsequent days after oil is released. Thus, the term is appropriate, albeit somewhat confusing to the general public without a clear explanation, particularly for a blowout (i.e., a steady or continual spill).
The committee prefers the term “Day-X Thickness.” The committee recommends that the three inputs for representative oil thicknesses be available for user input in the calculator to allow for other scenarios and better planning results when each input is also associated with its uncertainty.
Alternatively, an initial thickness on the first day could be entered along with the thickness on the following days estimated from the initial thickness and subsequent patchiness (via a simple factor between 0 and 1). Note that, for blowout spills, skimmers are likely only to operate near the source (always at “Day-1 Thickness”), whereas for batch spills, skimmers might be directed to the thicker and increasingly sparse patches farther from the source. These options are discussed in this letter report.
Does the Estimated Recovery System Potential (ERSP) process appropriately incorporate operational period, thickness factors, and “batch” or “continuous release” scenarios?
The committee found that the ERSP process appropriately incorporates operational period, thickness factors, and “batch” or “continuous release” scenarios for the most part. See above answers and more detailed suggestions within this letter report (e.g., the section “Applicability of the Estimated Recovery System Potential Calculator”). However, the methods for applying the calculator to a continuous release should be explained in simple terms with examples.
Computer Model
Are the assumptions underlying the computer model correct and adequate?
The Genwest report, the ERSP method, and the calculator code are consistent, but there are important, conceptual pieces missing, which, in the committee’s judgment, could be easily added. The committee suggests several ways to implement its recommendations in this report.
The committee recommends that the calculator’s defining equations be typeset unambiguously, accompanied by a clear definition of variables and their units of measurement and also by a succinct explanation of the rationale for the modeling assumptions and choices that are made. This would be documented in a user manual. The equations should then be exposed to the community of remediation experts for public examination and improvement. The committee believes that such exposure will improve the model in the long term and also promote its acceptance and use by the target community.
Does the model run as described without compounding errors?
The committee believes that the results listed in the Genwest report for the example systems used to illustrate the operation of the ERSP calculator do not suffer from numerical errors. This conclusion arises from an independent code used to reproduce the calculations for selected examples given in the Genwest report. It is recognized that some of the assumptions made by the underlying model are subject to debate, like all modeling assumptions inevitably are, yet without suggesting that they are incorrect. Some of these assumptions are not stated or explained (in particular, the factor “1.43” that appears in the “Total Volume of Oil/Emulsion Recovered/Operating Period”). Publishing the calculator code and a user manual will overcome these shortcomings in the long run. There is no compounding of numerical errors beyond what the user’s computer (where the calculator runs) does in terms of numerical precision. Errors that relate to the uncertainty of inputs are neither considered nor propagated; the committee regards this omission as a shortcoming of the calculator in its present form.


