
3
Data Resources for Indicators
Measuring capacity and change in science, technology, and innovation (STI) has a long history, dating back decades in economics and management research. Since the 1950s, under congressional mandate, the U.S. National Science Foundation (NSF) has produced measures of research and development (R&D), as well as education and occupational statistics specifically for science and engineering (S&E) fields. This chapter describes the data resources used by NSF’s National Center for Science and Engineering Statistics (NCSES) to develop its STI indicators. These resources include its own surveys; administrative records and statistics from U.S. and international agencies, organizations, and companies; and bibliometric analysis of publications in peer-reviewed S&E journals. The main purpose of the chapter is to identify the high-priority indicators that NCSES already produces and the types of indicators that require further development. The panel also examined the long-standing issue of balance between indicators addressing human resources and R&D and innovation.
The analysis in this chapter, as well as the companion Appendix F,1 is based on databases that are available to the public. NCSES’s surveys yield scores of data for variables that are not released to the public for privacy and confidentiality reasons or because resources are inadequate to create data series from all relevant survey questions. In other words, NCSES has already collected or has access to some of the information desired by users of STI indicators.
NCSES communicates its science and technology (S&T) data through various media ranging from InfoBriefs, to Detailed Statistical Tables (DSTs), to table generation tools. The three table generation tools—the Integrated Science and Engineering Resource Data System (WebCASPAR), the Scientists and Engineers Statistical Data System (SESTAT), and the Survey of Earned Doctorates (SED) Tabulation Engine (National Center for Science and Engineering Statistics, 2013b)—are supported by application-specific database systems. The Industrial Research and Development Information System (IRIS) is a searchable database of prepopulated tables.
WebCASPAR hosts statistical data for S&E at U.S. academic institutions (National Science Foundation, 2012e). This database is compiled from several surveys, including:
- NSF SED2/Doctorate Records File;
- NSF Survey of Federal Funds for Research and Development;
- NSF Survey of Federal Science and Engineering Support to Universities, Colleges, and Nonprofit Institutions;
- NSF Survey of Research and Development Expenditures at Universities and Colleges/Higher Education Research and Development Survey;
- NSF Survey of Science and Engineering Research Facilities;
- NSF-National Institutes of Health (NIH) Survey of Graduate Students and Postdoctorates in Science and Engineering; and
____________________
1Appendix F contains a catalog of STI data and statistics from NCSES and other sources, including OECD; the United Nations Educational, Scientific and Cultural Organization, Institute of Statistics; Eurostat; Statistics Canada, Canadian Socio-economic Information Management System; the World Intellectual Property Organization; other U.S. agencies; and private sources. The appendix also contains a heat map analysis, illustrating a tool that could be used to identify areas for which there is either a paucity or an abundance of statistics.
2SED data on race, ethnicity, citizenship, and gender for 2006 and beyond are available in the SED Tabulation Engine. All other SED variables are available in WebCASPAR except for baccalaureate institution. For more details on the WebCASPAR database, see https://ncsesdata.nsf.gov/webcaspar/ [April 2014].
- National Center for Education Statistics (NCES), Integrated Postsecondary Education Data System (IPEDS)
- IPEDS Completions Surveys;
- IPEDS Enrollment Survey;
- IPEDS Institutional Characteristics Survey (tuition data); and
- IPEDS Salaries, Tenure, and Fringe Benefits Survey.
SESTAT (National Science Foundation, 2013d) is a database of more than 100,000 scientists and engineers in the United States with at least a bachelor’s degree. This is a comprehensive data collection on education, employment, work activities, and demographic characteristics, covering 1993 to 2010. The SESTAT database includes data from:
- the National Survey of College Graduates (NSCG),
- the National Survey of Recent College Graduates (NSRCG),
- the Survey of Doctorate Recipients (SDR), and
- an integrated data file (SESTAT).
IRIS (National Center for Science and Engineering Statistics, 2013a) is a database containing industrial R&D data published by NSF from 1953 through 2007. It comprises more than 2,500 statistical tables, which are constructed from the Survey of Industrial Research and Development (SIRD). It is, therefore, a databank of statistical tables rather than a database of microdata of firm-specific information. The data are classified by Standard Industrial Classification and North American Industrial Classification codes (as appropriate), and by firm size, character of work (basic, applied, development), and state. Employment and sales data for companies performing R&D are also included in IRIS.
The data outlined above focus on academic and industrial R&D expenditures and funding and on human capital in S&T. NCSES conducts five surveys to capture R&D support and performance figures for various sectors of the economy. The National Patterns of Research and Development Resources series of publications presents a national perspective on the country’s R&D investment. R&D expenditure and performance data are available, as well as employment data on scientists and engineers. The National Patterns data are useful for international comparisons of R&D activities. The data also report total U.S. R&D expenditures by state. The data series spans 1953 through 2011 and is a derived product of NCSES’s above-referenced family of five active R&D expenditure and funding surveys:
- Business Research and Development and Innovation Survey (BRDIS; for 2007 and earlier years, the industrial R&D data were collected by the SIRD);
- Higher Education Research and Development Survey (HERD; for 2009 and earlier years, academic R&D data were collected by the Survey of Research and Development Expenditures at Universities and Colleges);
- Survey of Federal Funds for Research and Development;
- Survey of Research and Development Expenditures at Federally Funded R&D Centers (FFRDCs); and
- Survey of State Government Research and Development.3
Two surveys are under development at NCSES: the Microbusiness Innovation Science and Technology Survey (MIST), which will capture firms with fewer than five employees,4 and the Survey of Postdoctorates and Early Career Researchers.5
NCSES’s data catalog clearly covers a wide range of information on the STI system, but underlying challenges influence the portfolio and timeliness of the indicators produced.
First, response rates are declining for many of NCSES’s major surveys.6 Although most of NCSES’s surveys had response rates above 80 percent in the early 2000s, by 2010 the SDR, NSRCG, BRDIS, and HERD saw response rates fall into the 70-75 percent range, while the NSCG hovered around the 80 percent mark, down from 87 percent just 2 years prior.7 Given the importance of these surveys to NCSES’s indicators on innovation activities in the United States and abroad, these declining response rates represent a critical issue for the agency.
____________________
3For details on each of these surveys, see http://nsf.gov/statistics/question.cfm#ResearchandDevelopmentFundingandExpenditures [November 2012]. A sixth survey, the Survey of Research and Development Funding and Performance by Nonprofit Organizations, was conducted in 1973 and for the years 1996 and 1997 combined. The final response rate for the 1996-1997 survey was 41 percent; see http://www.nsf.gov/statistics/nsf02303/sectc.htm [January 2014]. This lower-than-expected response rate limited the analytical possibilities for the data, and NSF did not publish state-level estimates. The nonprofit data cited in National Patterns reports either are taken from the Survey of Federal Funds for Research and Development or are estimates derived from the data collected in the 1996-1997 survey. See National Science Foundation (2013c, p. 2), which states: “Figures for R&D performed by other nonprofit organizations with funding from within the nonprofit sector and business sources are estimated, based on parameters from the Survey of R&D Funding and Performance by Nonprofit Organizations, 1996-1997.”
4A microbusiness is defined as a corporation, partnership, or sole proprietorship operating in the United States or Puerto Rico with fewer than five employees. By this definition, a microbusiness may have between zero and four employees. As micobusinesses with zero employees are numerous and have different characteristics from businesses with one to four employees, there is a case for treating them separately for analytical purposes.
5NCSES also added a “field of bachelor’s degree” question to the American Community Survey in 2009. More detail on this development is provided in Chapter 6.
6This statement refers to survey nonresponse. The panel did not have data on item nonresponse rates for NCSES.
7This information was provided by NCSES. It is important to note, though, that the SED, Graduate Student Survey, Federal Funds Survey, Federal Support Survey, State Agency R&D Survey, and Academic Facilities Survey had response rates above 90 percent.
Second, costs per respondent have increased dramatically for almost all of NCSES’s surveys. The same surveys that have seen declines in response rates also have seen marked increases in costs per respondent, which have doubled or almost tripled for some surveys. Obtaining responses from marginal respondents, especially when the goal is to achieve response rates above 80 percent, is increasingly expensive, and this is a factor in prolonged delays between fielding a questionnaire and publishing related data tables and statistics.
Third, 80 percent of NCSES’s expenditures on surveys in 2010 were for human resources data. That year, BRDIS accounted for 10 percent of survey expenditures. The remaining 10 percent was for surveys on academic facilities, FFRDCs, and R&D expenditures by state governments; the Federal S&E Support to Universities Survey; and contributions to the General Social Survey for information on public attitudes toward and knowledge of S&E (see Figure 3-1).
NCSES explained to the panel the high share of expenditures on human resources surveys: gathering information on individuals is more difficult and time-consuming than gathering information from firms or government agencies that can rely on some administrative reporting for answers to questionnaires. In addition, because each survey has an assigned staff member to manage contracting, site visits, analysis, and publication of information related to the survey, approximately three-fourths of NCSES personnel costs is related to the management of human resources data and statistics.
In light of tightening budgets, NCSES is seeking to rationalize its survey operations, looking for opportunities to reduce its dependence on large, lengthy surveys while augmenting data and statistical acquisitions with a focus on satisfying user needs, as discussed in Chapter 2. To its credit, the agency has already cut costs on the human resources side. NCSES eliminated the NSRCG; 2010 was the final year of data collection for this survey. However, users will still be able to obtain data on recent college graduates, because NCSES is relying on the American Community Survey (ACS) for a sampling frame for other surveys and for data on new college graduates. This decision—and the implications for indicators on human capital—is examined in Chapter 6.
Despite NCSES’s sizable expenditures on human resources surveys, the number of tables or data series published by the agency appears to be more balanced. Figure 3-2 shows the concentration of NCSES tables, with points closer to the center of the diagram indicating greater concentration.8 Based on the datasets described earlier in this chapter, the figure shows that business expenditures on R&D (BERD) make up 52 percent of NCSES’s databases, while the category “scientists and engineers” (including academic and workforce data) accounts for 44 percent.
Figure 3-3 similarly shows the concentration of STI datasets for the United Nations Educational, Scientific and Cultural Organization (UNESCO), OECD, Eurostat, and Statistics Canada. UNESCO, Eurostat, and Statistics Canada have a greater concentration of innovation statistics and much less focus on human resources statistics than is the case for NCSES. OECD appears to place greater emphasis on measuring activities of researchers, technology trade in R&D-intensive industries, and business expenditures on R&D. For international comparability purposes, it appears that a balance would be accomplished and users would be better served if NCSES improved its portfolio of indicators on innovation activities (including innovative output), while other countries produced comparable measures on scientists and engineers (e.g., number of earned bachelor’s, master’s, and doctoral degrees as indicators of potential for R&D and innovation in S&T fields). This is not to say that a proliferation of indicators is preferable to the status quo. Chapters 4-6 provide detail on the types of indicators that should be targeted for further development by NCSES and its international counterparts.
The National Science Board’s Science and Engineering Indicators (SEI) and companion publications are major outlets for NCSES’s STI indicators. Indicators also appear in NCSES’s InfoBriefs and interactive tools on the agency’s website.
More than 300 indicators are published in SEI, covering a wide range of topics for several countries and regions around the world and for a variety of demographic classifications.9
Figure 3-4 shows the distribution of indicators in several areas of importance to NCSES’s clientele. Based solely on shares of different types of indicators published in SEI as shown in the figure, it is clear that a rich set of indicators covers science, engineering, and health degrees; the S&E workforce; education assessment; public attitudes toward S&T; trade in R&D-intensive industries; and R&D expenditure. By contrast, there is relatively sparse coverage of direct measures of innovation, public-sector R&D, and R&D conducted by nonprofit organizations—areas of keen interest for users of indicators and therefore areas in which NCSES could improve its portfolio.
____________________
8The categories for the diagram were chosen for purposes of comparison with data from international organizations. Hence the shares do not add to 100 percent. For example, science, engineering, and health (SEH) degrees make up a portion of the data on “scientists and engineers.” Some organizations report SEH degrees, while others report data on scientists and engineers (including academic and workforce data). Concentration is defined here as the percentage of tables produced on a particular subtopic relative to the total tables generated by the STI database.
9See National Science Foundation (2012c) for the appendix of STI indicators. Appendix F of this report contains a summary table of these indicators.
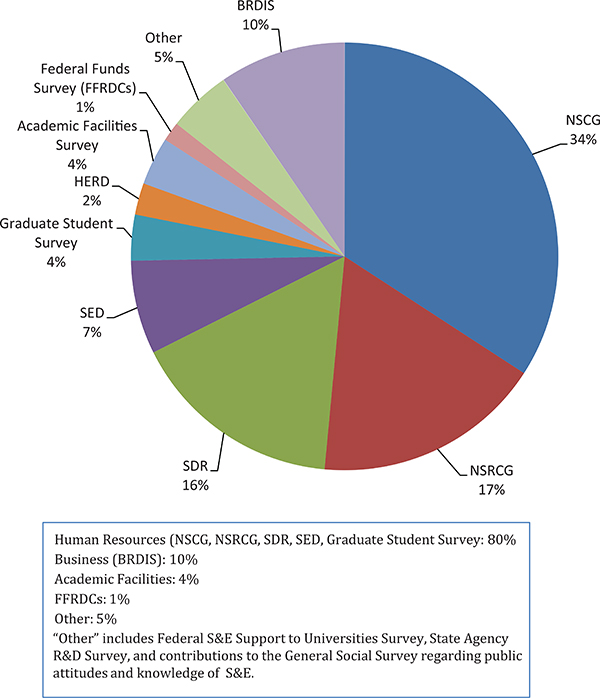
FIGURE 3-1 Percentage of NCSES survey costs, 2010.
NOTES: BRDIS = Business Research and Development and Innovation Survey; FFRDC = Federally Funded Research and Development Center; HERD = Higher Education Research and Development Survey; NCSES = National Center for Science and Engineering Statistics; NSCG = National Survey of College Graduates; NSRCG = National Survey of Recent College Graduates; R&D = research and development; SDR = Survey of Doctorate Recipients; SED = Survey of Earned Doctorates.
SOURCE: NCSES data.
The panel used another method—a heat map exercise—to determine the areas in which NCSES has abundant coverage of STI indicators—items that are highly correlated and potentially tell a similar story about trends in S&T activities. Perhaps this method could also be used to identify areas in which there is a paucity of information. The results of this heat map exercise for NCSES’s indicators are formally presented in Appendix F and summarized here.
Initially, all of the variables were included in the heat map analysis and multidimensional scaling of the Pearson correlation matrix. The result was multiple clusters because most of the variables are tabulations of main variables, so that the
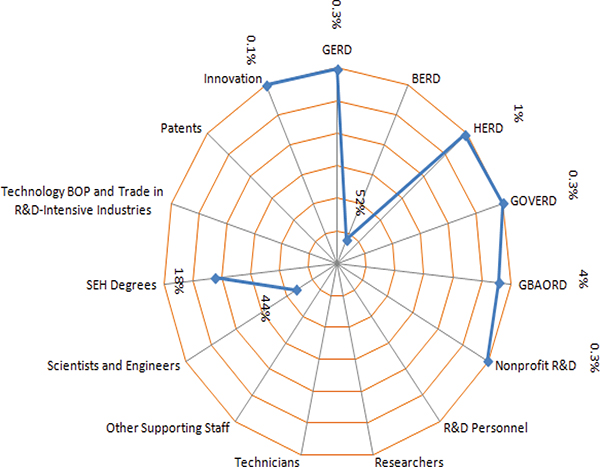
FIGURE 3-2 NCSES’s concentration in STI subtopics.
NOTES: BERD = business enterprise expenditure on R&D; BOP = balance of payments; GBAORD = government budget appropriations or outlays for research and development; GERD = gross domestic expenditure on research and development; GOVERD = government intramural expenditure on R&D; HERD = higher education expenditure on research and development; NCSES = National Center for Science and Engineering Statistics; R&D = research and development; SEH = science, engineering, and health.
SOURCES: Adapted from BRDIS, see http://www.nsf.gov/statistics/industry/ [November 2012]. Federal Funds, see http://www.nsf.gov/statistics/fedfunds/ [November 2012]. R&D Expenditure at FFRDCs, see http://www.nsf.gov/statistics/ffrdc/ [November 2012]. HERD, see http://www.nsf.gov/statistics/herd/ [November 2012]. Science and Engineering State Profiles, see http://www.nsf.gov/statistics/pubseri.cfm?seri_id=18 [November 2012].
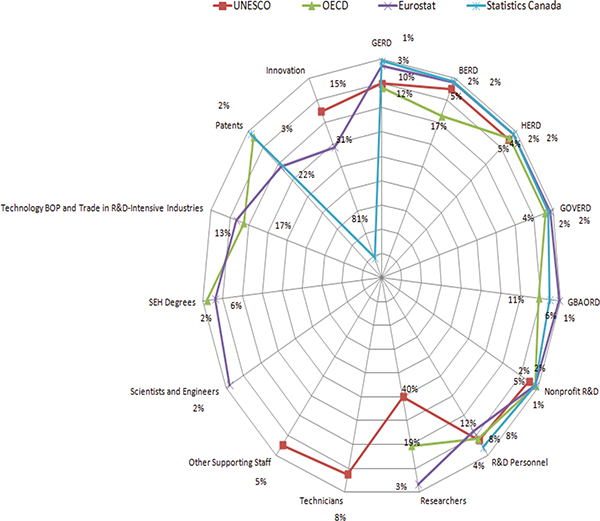
FIGURE 3-3 Subtopics of STI data produced by agencies/organizations other than NCSES.
NOTES: BERD = business enterprise expenditure on R&D; BOP = balance of payments; GBAORD = government budget appropriations or outlays for research and development; GERD = gross domestic expenditure on research and development; GOVERD = government intramural expenditure on R&D; HERD = higher education expenditure on research and development; OECD = Organisation for Economic Co-operation and Development; R&D = research and development; SEH = science, engineering, and health; UNESCO = United Nations Educational, Scientific and Cultural Organization.
SOURCES: Adapted from UNESCO, see http://www.uis.unesco.org/ScienceTechnology/Pages/default.aspx [November 2012]. OECD, see http://stats.oecd.org/Index.aspx?DataSetCode=MSTI_PUB [November 2012]. Eurostat, see http://epp.eurostat.ec.europa.eu/portal/page/portal/science_technology_innovation/data/database European Union, 1995-2013 [November 2012]. Statistics Canada, CANSIM; see http://www5.statcan.gc.ca/cansim/a33?lang=eng&spMode=master&themeID=193&RT=TABLE [November 2012].
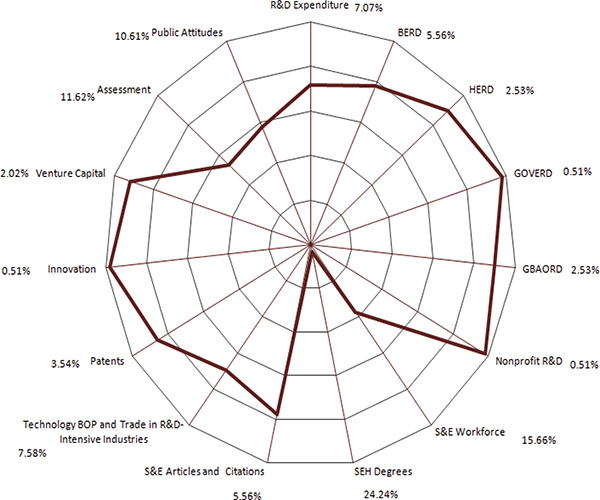
FIGURE 3-4 Science and Engineering Indicators 2012: Distribution of STI subtopics.
NOTES: BERD = business enterprise expenditure on R&D; BOP = balance of payments; GBAORD = government budget appropriations or outlays for research and development; GERD = gross domestic expenditure on research and development; GOVERD = government intramural expenditure on R&D; HERD = higher education expenditure on research and development; R&D = research and development; S&E = science and engineering; SEH = science, engineering, and health.
SOURCE: Adapted from Science and Engineering Indicators, 2012, see http://www.nsf.gov/statistics/seind12/tables.htm [January 2014].
number of variables gleaned from a single subtopic was very large. Because the aim of this analysis was to understand the redundancy in main S&T variables, the variables included in the heat map exercise were narrowed to those that address key STI topics. Therefore, the heat map exercise did not utilize all SEI 2012 variables, but it did capture all the major areas important to users of the statistics.
Before delving into the results of the heat map exercise, it is essential to note that the granularity and frequency that users demand of STI indicators often determine which indicators take priority in the portfolio. Certain users may want to understand levels of R&D expenditure to compare nations, while others may want the same variable for subnational comparisons (say, hot spots for innovation activities in different areas of the United States). Thus the same statistics may be produced at different geospatial or sectoral levels to satisfy different types of users. Also, highly correlated variables may have substantively different meanings and not stem from the same root logically. Therefore, the information conveyed by each of the highly correlated variables may be useful to users, offering no obvious opportunity for eliminating any specific indicator. Nevertheless, it is helpful to get a picture of the areas in which indicators have proliferated yet point to the same concept or idea, and for this purpose the heat map exercise can be instructive.
Consider the 20 variables in Table 3-1. These variables represent only a small fraction of the STI indicators produced by NCSES, but they are presumed to convey very different information about the S&E system. The R&D intensity variable is highly used by policy makers, as are measures of doctoral degree holders, trade in S&T products and intangible assets, and publications of discoveries in journals. The related heat map shown in Figure 3-5 reveals that (1) the export and value-added variables are shaded red and are therefore highly, positively correlated; (2) the education degrees and R&D intensity variables appear in the yellow area, and are not much in line with one another; (3) the variables doctoral degrees in natural science, global high-value patents, trade balance in knowledge-intensive services, and engineering journal articles as a share of total S&E journal articles are not correlated at all with one another; and (4) the variables doctorates in engineering, research articles with international coauthors, and share of citations in international literature are strongly, negatively correlated. One conclusion to be drawn here is that the highly, positively correlated variables are derived from the same root or factor, so it could be helpful to use that basis as an indicator. Again, users from the health and social services sector will want to know levels and trends for that particular sector. They are unlikely to be as satisfied with information from other knowledge-intensive sectors, even if those statistics are highly correlated with those from the health and social services sector.
Another way to view the results of the heat map exercise is to look at the multidimensional scaling of the variables.
TABLE 3-1 Variables Used in Heat Map Exercise
| Indicator Label | Indicator |
| 1. RD_%_GDP |
R&D expenditures as a share of economic output (research and development [R&D] as percentage of gross domestic product [GDP] or R&D intensity) |
| 2. Deg_NatSci |
First university degrees in natural sciences |
| 3. Deg_Eng |
First university degrees in engineering |
| 4. Doct_NatSci |
Doctoral degrees in natural sciences |
| 5. Doct_Eng |
Doctoral degrees in engineering |
| 6. S&E_Art |
Science and engineering (S&E) journal articles produced |
| 7. Eng_Share_S&E_Art |
Engineering journal articles as a share of total S&E journal articles |
| 8. Res_Art_Int_CoAuthor |
Percentage of research articles with international coauthors |
| 9. Share_Citation_Int_Lit |
Share of region’s/country’s citations in international literature |
| 10. Global_HighValue_Patents |
Global high-value patents |
| 11. Export_Comm_KIS |
Exports of commercial knowledge-intensive services |
| 12. HighTech_Exports |
High-technology exports |
| 13. Trade_Balance_KIS_IntAsset |
Trade balance in knowledge-intensive services and intangible assets |
| 14. VA_HighTech_Manu |
Value added of high-technology manufacturing industries |
| 15. VA_Health_SS |
Global value added of health and social services |
| 16. VA_Educ |
Global value added of education services |
| 17. VA_Whole_Retail |
Global value added of wholesale and retail services |
| 18. VA_Real_Estate |
Global value added of real estate services |
| 19. VA_Transport_Storage |
Global value added of transport and storage services |
| 20. VA_Rest_Hotel |
Global value added of restaurant and hotel services |
Figure 3-6 shows groupings of variables that are highly associated with one another. R&D intensity lies close to the value-added variables in the center of the diagram, suggesting relatively high correlations among those variables. One might not want to eliminate some items in the center of the multidimensional configuration, but one might want those variables gathered with less frequency or across staggered time periods. Of interest, the variables on the periphery of Figure 3-6 can provide additional information for those in the center. The former variables are grouped as follows: (1) engineering journal articles as a share of total S&E journal articles, trade balance in knowledge-intensive services and intangible assets, and global high-value patents and (2) share of region’s/country’s citations in international literature and percentage of research articles with international coauthors. Doctoral degrees in natural sciences and in engineering do not overlap in the space. Global value added of real estate services is negatively related to most of the variables. In addition, the variable S&E journal articles produced is far away from the variable engineering journal articles as a share of total S&E journal articles, indicating that these two variables convey independent information.
This method of mapping the portfolio of STI indicators and observing which indicators are similar at least in some dimensions of what they convey can be useful in setting priorities for NCSES’s indicators program. However, there are three important caveats. First, it is important to analyze a full set of indicators, not just the selection used in this report for illustrative purposes. Second, as stated earlier, the panel believes that understanding user needs and the best indicators to address user demand takes precedence over methods that cannot weigh users’ specific interests. Third, other methods, such as principal components and model-based cluster analysis, should be applied to see whether statistical artifacts arise from a given clustering method. Finally, to consider cost savings, a more comprehensive analysis would be necessary, including information on how many surveys or survey questions need to be analyzed to produce the data and whether variables can be obtained from administrative records or organizations that would produce the statistics in any event.
GAPS IN STI INDICATORS THAT NCSES SHOULD FILL
Taking the inventory of all of the indicators produced by NCSES together with the list of indicators derived using the policy-driven framework in Chapter 2, the panel identified key indicators that NCSES currently produces that satisfy user priorities and those indicators that need further development or need to be created over time.
High-Priority STI Indicators Currently Produced by NCSES
It is no surprise that NCSES has an impressive collection of data and indicators on R&D expenditures; science, technology, engineering, and mathematics (STEM) education; and the STEM workforce and talent. These are the bedrock statistics that have long been in NSF’s purview. Also in NCSES’s portfolio are statistics on innovation and other measures of commercial outputs and outcomes and knowledge outputs, and some information on institutions and organizations that are actors in the STI system. Hall and Jaffe (2012, p. 20) note, however, that
There are also multiple indicators that correspond to knowledge and human capital outputs, although these measures are universally proxies that are related to the underlying concepts with substantial measurement error (e.g., degrees as a measure for the human capital of graduates; papers as a measure of new scientific knowledge; patents as a measure
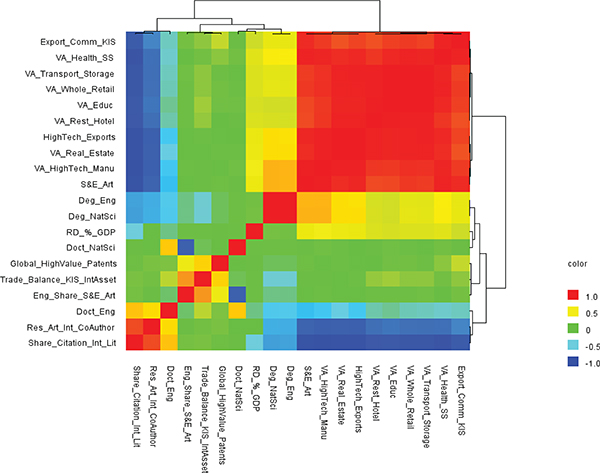
FIGURE 3-5 Heat map based on Pearson correlation matrix for 20 variables (see Table 3-1).
SOURCE: Produced by panel from the National Science Board (2012a). See Appendix F for details of heat map generation.
of new technical knowledge). The measures of innovation (as opposed to innovative activities) are much less complete, and arguably more “distant” from the underlying concepts. For example, the errors of both over-inclusion and under-inclusion in using new trademark registrations as a proxy for innovation are probably even greater than the corresponding errors in using patents as a proxy for new inventions. And a similar observation applies to using high-tech value added as an indicator for increased output that can be attributed to innovation.
Box 3-1 shows the STI indicators already produced by NCSES that users identified as priorities. Any improvements to these indicators would likely involve changes in frequency or granularity to enhance their utility. For example, some users stated that it would be helpful to have some measures available more than once per year (say, quarterly), while other indicators that fluctuate little could be reported annually or biannually or even every 3-5 years. Users were pleased with the validity of the statistics, informing the panel that having a reliable, unbiased source of data on companies, educational institutions, and other countries was an important public good. They stressed, however, that receiving these statistics in a timely manner is of paramount importance and expressed some concern about the growing gap between observation and public release of the data.
Gaps That NCSES Should Fill in the Near Term
NCSES has an opportunity in the near term to produce new or revised STI indicators in a few key areas, based on existing datasets or statistics from other agencies and organizations. The core chapters of this report—Chapters 4, 5, and 6—offer specific recommendations for improvements to NCSES’s measures of innovation, knowledge capital, and
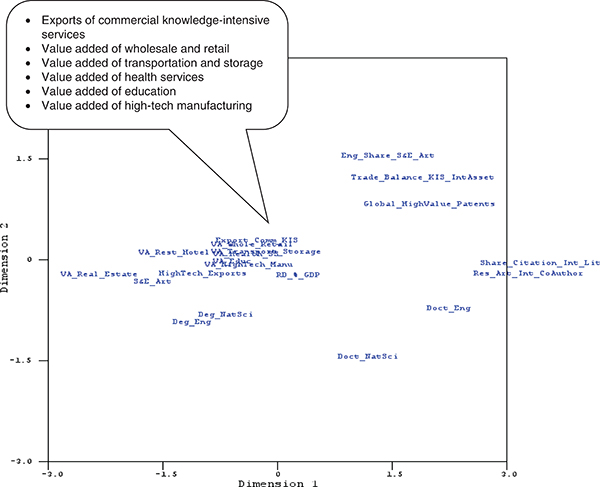
FIGURE 3-6 Multidimensional scaling of 20 measures (see Table 3-1).
SOURCE: Produced by panel from the National Science Board (2012a). See Appendix F for details of heat map generation.
human capital. NCSES should focus first on cultivating measures in areas in which the data already exist in its BRDIS and SESTAT databases and in which it has productive collaborations with other statistical agencies in the United States and abroad. Indicators that fall into this category include (but are not limited to)
- innovation breakdowns by firm size (based on number of employees) that are comparable with OECD statistics;
- expenditures on design and technical specifications, including computer systems design and design patents;
- sale of new-to-market and new-to-firm innovations as a share of turnover;
- births and deaths of businesses linked to innovation outputs (firm dynamics by geography, industry, business size, and business age);
- technology balance of trade (especially intellectual property);
- knowledge stocks and flows in specific sectors, including nanotechnology, information technology, biotechnology and agriculture research, oil and gas production, clean/green energy, space applications, weapons, health care technologies, educational technologies (massive open online courses [MOOCs]), and mining;
- advanced manufacturing outputs (information technology-based processes);
- percentage of faculty in nonteaching and nonresearch roles at universities;
- share of population aged 30-34 having completed tertiary education;
- share of youth aged 20-24 having attained at least upper-secondary-level education;
- persistence and dropout rates in education, by geographic and demographic distinctions;
- postdoctoral levels and trends in various STEM fields, by country of birth and country of highest degree;
BOX 3-1
High-Priority Indicators Currently Produced by NCSES
Research and Development (R&D)
- National R&D expenditures
- Federal and state funds for basic research
- Public-sector R&D (focus on advanced manufacturing, green technologies, energy-related R&D, nanotechnology, agriculture, weapons)
- Public R&D spending as a share of gross domestic product (GDP)
- Business R&D spending
- Business R&D as a share of GDP
- Industry support for R&D in universities
- Social science R&D
- National R&D performance (by type of industry and source of funds)
Innovation
- Firms (5+ employees) introducing new or significantly improved products or processes as a share of all firms
- Firms (5+ employees) introducing new or significantly improved goods or services as a share of all firms
Commercial Outputs and Outcomes
- Medium- and high-tech manufacturing exports as a share of total product exports
- Knowledge-intensive service exports as a share of total service exports
- Value added in manufacturing
- Value added in technical services
- Trade flows of science and technology (S&T) products and services
- Information and communication technology (ICT) output and sales (intermediate and final)
Knowledge Outputs
- U.S. receipts and royalty payments from foreign affiliates
- U.S. patent applications and grants by country, technology
- U.S. trademark applications and grants by country, technology
- Patent citations
- number of postdoctoral fellows in health (specific fields); and
- labor mobility and workforce migration.
Over time, NCSES should build capacity in house and through its Grants and Fellowships Program to develop measures that are of high priority for users but require deeper knowledge of how to obtain statistically valid data or require the use of frontier methods (as described in Chapter 7).10 Some of this information might be in the form not of quantitative measures but of in-depth case studies that NCSES could obtain from the research community and communicate through InfoBriefs or vignettes in the National Science Board’s biennial SEI volume. NCSES’s Grants and Fellowships Program also could benefit synergistically from cofunding opportunities with the Science of Science and Innovation Policy Program, which also resides in NSF’s Social, Behavioral, and Economic Sciences Directorate. Important as well is for NCSES to develop a roadmap or strategic plan for adding new indicators or case studies, because doing so will likely require curtailing the frequency of some of its current measures. Proliferation of indicators is not the goal but rather the development of a rich portfolio of information on the global STI system desired by users.
Users of NCSES’s data and statistics are diverse and eager to obtain information on a variety of topics that the agency has as yet been unable to produce. NCSES has access to some
____________________
10The solicitation for NCSES’s grants competition is found at http://www.nsf.gov/funding/pgm_summ.jsp?pims_id=5265&org=SBE&from=home [January 2014].
- License and patent revenues from abroad as a share of GDP
- Triadic patent families by country
- Percentage of patent applications per billion GDP
- Percentage of patent applications related to societal challenges (e.g., climate change mitigation, health) per billion GDP
Science, Technology, Engineering, and Mathematics (STEM) Education
- Expenditures, direct and indirect costs, investments, revenues, financing for STEM education
- Enrollment data by STEM field at various levels (e.g., associate’s, bachelor’s, master’s, doctorate) and for various types of institutions
- New degrees (e.g., associate’s, bachelor’s, master’s, doctorate); new doctoral graduates per 1,000 population aged 25-34
- Stock of degrees (e.g., associate’s, bachelor’s, master’s, doctorate)
- Number of high school students pursuing associate’s degrees and implications for the workforce and cost of higher education
- Disciplines in which community colleges have comparative advantage
- Foreign-born STEM-educated individuals—country of birth; immigration visas, etc.
- Stay rates of foreign students
- Trends in online learning
STEM Workforce/Talent
- STEM employment
- Demographic composition of people who would enter specific occupations (e.g., clean energy, ICT, biotechnology, health services)
- Fraction of STEM degree holders that hold STEM jobs
- Earnings by degree type and occupation
- Employment in knowledge-intensive activities (manufacturing and services) as a share of total employment
Organizations/Institutions
- Public-private copublications per million population
- Number of international collaborations
- Technology transfer between academic institutions and businesses, including mechanisms
- Technology transfer (Manufacturing Extension Partnership)
- Technology transfer from national laboratories
- Research and experimentation tax credits (federal and state)
of the raw data required to satisfy user demands, and it has opportunities to provide more high-utility policy-relevant indicators in particular with the use of various methodologies. However, satisfying user demands and anticipating future demands on its databases and analytical products will require developing a strategic plan, whose execution will in turn require careful husbanding of existing resources and possibly new financial and human capital resources as well.
RECOMMENDATION 3-1: In the near term, the National Center for Science and Engineering Statistics (NCSES) should work to produce new and revised science, technology, and innovation indicators in a few key areas, using existing data from the Business Research and Development and Innovation Survey and the Scientists and Engineers Statistical Data System or from productive collaborations with other statistical agencies in the United States and abroad. Over time, NCSES should build capacity in house and through its Grants and Fellowships Program to develop measures that are high priority for users but that require deeper knowledge to obtain statistically valid data or to use frontier methods appropriately. NCSES should also develop a strategic plan for adding new indicators or case studies because doing so may require curtailing the frequency of some of its current measures.
Four main themes arise from the discussion in this chapter. First, NCSES has an array of education and workforce data from which to produce indicators of STI talent. These
indicators address many of the questions raised in Chapter 2 regarding STI talent. However, there is still room to improve coverage of human capital, especially regarding the mobility of S&E workers within the United States and between countries, and there is a paucity of data on training of S&E workers at the postdoctoral level and in the workplace. NCSES and statistical organizations around the world should collaborate on building capacity in these areas.
Second, in contrast to human capital indicators, international organizations such as OECD, Eurostat, UNESCO, and Statistics Canada have comparatively more developed innovation indicators than NCSES. Improving international comparability could be a mutually beneficial collaborative effort among these organizations.
Third, as NCSES determines which new indicators to produce to satisfy user needs, it must make difficult decisions about which indicators to discontinue producing or at least to publish less frequently. This chapter offers some guidance on empirical methods that could be used to help make those decisions. However, the priorities and diverse needs of users should remain primary considerations as these decisions are made.
Fourth, improving the ability to address pressing policy-relevant issues in the future will require more than raw data or statistical measures. Acquiring analytical knowledge about STI worldwide will require statistics derived from empirical research; experimental exercises that allow counterfactual analysis to reveal impacts of expenditures on R&D and innovation; and case studies that convey narratives regarding collaborative activities, networks, and other characteristics of tacit knowledge that are key drivers of the international system of innovation. NCSES is primed to take on these challenges over time, with some near-term opportunities to satisfy user demands.


