
This chapter considers the measurement of innovation—in particular, the outputs of the country’s innovation system.1 It presents definitions of innovation, explains the importance of measuring innovation and the relevance of innovation measures for policy decisions, and examines the role of innovation surveys and their limitations. The chapter then reviews improvements to innovation surveys, in particular the Business Research and Development and Innovation Survey (BRDIS), including improving international comparability, gathering deeper information on innovations, extending BRDIS to include such items as organizational and marketing as well as “unmarketed” innovations and to track a broader array of inputs to innovation, improving the presentation of information, and improving linkages between the BRDIS data and other datasets. Finally, the chapter turns to the use of nontraditional methodologies to track innovation, such as the use of “business practice” data.
In accordance with the framework used in this study (Chapter 2), the panel’s recommendations for the National Center for Science and Engineering Statistics (NCSES) regarding the measurement of innovation are driven by key policy questions and by specific questions raised by users of science, technology, and innovation (STI) indicators, as well as by the need for internationally comparable measures. The panel acknowledges that the innovation measures presented in this chapter answer policy questions only in part. It is essential that such measures be used in concert with in-depth analysis of economic and institutional environments and understanding of behavioral responses to changes in those environments. An innovation may reach forward into varied markets and backward to human capital and at times research and development (R&D) inputs. The discussion in this chapter must therefore be viewed in the context of an indicators program that is analytically strong.
Schumpeter (1934, p. 66) provided a definition of “innovation” early in the 20th century. He defined product innovation as “the introduction of a new good … or a new quality of a good” and process innovation as “the introduction of a new method of production … or a new way of handling a commodity commercially.” This definition influenced early attempts to measure the activity of innovation through case studies and surveys. Other definitions offered more recently are presented in Box 4-1.
Knowledge gained from a decade of experience with experimental surveys in Canada, Germany, the Nordic countries, and the United States was codified by OECD in the first Oslo Manual (OECD, 1992), which dealt with innovation in manufacturing products and processes. Following more measurement experience, the scope of the manual was extended to the nonagricultural economy (OECD-Eurostat, 1997). This broadened scope gave rise to a better understanding of the measurement of innovation in service industries and expansion of the definition of innovation to include not only product and process innovations but also organizational change and the development of new or the extension of existing markets. These additional components of the definition were also considered by Schumpeter.
For measurement purposes, the Oslo Manual (OECD-Eurostat, 2005, p. 46) defines innovation as follows:
____________________
1Edquist (2005, p. 182) defines the “system of innovation” as “all important economic, social, political, organizational, institutional, and other factors that influence the development, diffusion, and use of innovations.” Lundvall (1992, p. 2) states that a system of innovation is “constituted by elements and relationships which interact in the production, diffusion and use of new, and economically useful, knowledge.” Lundvall (2007, p. 106) extends this definition by focusing on the learning processes, stating: “The analysis of innovation systems may be seen as an analysis of how knowledge evolves through processes of learning and innovation.” Other noted studies on national innovation systems include Freeman (1995); Furman et al. (2002); Lundvall (1988); Martin and Johnston (1999); Mowery (1992); Muller and Zenker (2001); and Nelson (1993).
BOX 4-1
Definitions of Innovation
The following definitions of innovation vary, but the common thread is the extraction of economic value from novel activities (Innovation Vital Signs Project 2007):
Innovation is “the commercial or industrial application of something new—a new product, process or method of production; a new market or sources of supply; a new form of commercial business or financial organization.”
Schumpeter 1983
Innovation is the “intersection of invention and insight, leading to the creation of social and economic value.”
Council on Competitiveness 2005
Innovation covers a wide range of activities to improve firm performance, including the implementation of a new or significantly improved product, service, distribution process, manufacturing process, marketing method or organization method.
European Commission 2004
Innovation—the blend of invention, insight and entrepreneurship that launches growth industries, generates new value and creates high value jobs.
Business Council of New York State 2006
The design, invention, development and/or implementation of new or altered products, services, processes, systems, organization models for the purpose of creating new value for customers and financial returns for the firm.
Advisory Committee on Measuring Innovation in 21st Century Economy, Department of Commerce 2008
An innovation is the implementation of a new or significantly improved product (good or service), or process, a new marketing method, or a new organizational method in business practices, workplace organization or external relations. Innovation activities are all scientific, technological, organizational, financial and commercial steps which actually, or are intended to, lead to the implementation of innovations.
OECD-Eurostat 2005
Innovation success is the degree to which value is created for customers through enterprises that transform new knowledge and technologies into profitable products and services for national and global markets. A high rate of innovation in turn contributes to more market creation, economic growth, job creation, wealth and a higher standard of living.
Innovation Vital Signs Project 2007
SOURCE: Aizcorbe et al. (2009).
… the implementation of a new or significantly improved product (good or service), or process, a new marketing method, or a new organizational method in business practices, workplace organization or external relations.
Innovations can be distinguished from inventions by the criterion that innovations are implemented in the marketplace. By definition, therefore, innovation is a new product or idea that has been commercialized. This does not mean that an innovation is necessarily widely distributed or diffused in a market. It does mean that neither a new product that is not marketed nor a new process that does not help get a product to market is considered an innovation. Note that later in this chapter, the panel considers the possibility of collecting information on “unmarketed” innovations to address important policy questions.2
By contrast, the Oslo Manual (OECD-Eurostat, 2005, p. 18) identifies such inputs as R&D, capital expenditures, and training as “innovation activity”:
… all scientific, technological, organisational, financial and commercial steps which actually, or are intended to, lead to the implementation of innovations. Some innovation activities are themselves innovative; others are not novel activities but are necessary for the implementation of innovations. Innovation activities also include R&D that is not directly related to the development of a specific innovation.
____________________
2The European Community Innovation Survey (CIS) has been gathering such information, which has been shown to be policy relevant. For CIS 2012, the relevant question is 4.1 (Eurostat, 2012).
The underlying analytical framework used in this study posits that new and improved products and processes, new organizational methods, and new marketing concepts and strategies are key measures of the output of a country’s innovation system. Innovation affects both economic performance measures, such as productivity growth, profits, and job creation, and noneconomic variables, such as life expectancy and environmental response. Meanwhile, the rate of innovation responds to inputs such as R&D spending; the availability of science, technology, engineering, and mathematics (STEM) labor; regulatory policies; and other variables.3
From this perspective, the panel strongly believes that NCSES needs to improve its ability to measure and track innovation. Improved measures of innovation are necessary to assess the impact of federal, state, and local innovation policies, such as the amount and direction of federal R&D funding, support for STEM education at the graduate level, and regulation of new products and services. In addition, having good measures of innovation output facilitates comparison of the United States with other countries in a key area that promotes economic growth. NCSES’s mandate in the America Creating Opportunities to Meaningfully Promote Excellence in Technology, Education, and Science (America COMPETES) Act (U.S. House of Representatives, 2010) includes the curation and dissemination of data on “United States competitiveness in science, engineering, technology, and research and development.” Innovation is an important element for such comparisons. Without improved direct indicators of innovation outputs, policy analysis will continue to rely on imperfect indicators of innovation, such as number of patents granted; inputs to innovative activities, such as R&D spending and number of STEM workers; and broad performance measures for the economy, such as productivity.
A voluminous literature addresses the historical link between patents and innovation, and the topic remains controversial today. However, there is little doubt that the more than doubling of patent grants over the past 20 years—from 96,511 in 1991 to 224,505 in 2011—did not reflect an equally sharp rise in the volume of innovation. As recent litigation has shown, multiple patents have become a bargaining chip rather than an accurate measure of innovation output. Moreover, a recent NCSES InfoBrief suggests that patents are less important to companies than other forms of intellectual property protection (Jankowski, 2012). Based on data from the 2008 BRDIS, firms across virtually every industry are much more likely to cite trademarks, copyrights, and trade secrets than either design or utility patents as important for intellectual property rights. Also, the propensity to patent is highly industry dependent.
Similarly, input measures such as R&D spending cannot adequately substitute for measures of innovation output, especially if policy makers are concerned about government funds being used efficiently. Moreover, recent evidence shows that most firms that report innovations do not report R&D spending. For example, Table 4-1, drawn from the 2011 BRDIS results, shows that 79 percent of all firms with new or significantly improved products or processes did not report R&D spending. In other words, focusing only on firms that report R&D spending raises the possibility of missing much of the innovation taking place in the economy.4
Many innovations developed and introduced by start-up companies may not be associated with formal R&D, or R&D may not be recorded as such because start-ups often have no revenues against which to record expenses. More broadly, advances in information and communication technologies and the importance of innovations such as Google’s search service, Amazon’s e-commerce website, and Apple’s iTunes store signal how the nature of the innovation process has changed, increasingly depending on investments in innovative assets other than R&D (e.g., data, organizational know-how) and with take-up primarily in the service sector. Indeed, in fiscal year 2006, the year before the iPhone was introduced, Apple reported spending less than 3 percent of its revenues on R&D—relatively low for a technology company.5
Finally, broad measures of economic performance, such as productivity, do contain information about the country’s innovation system, especially over longer periods such as decades. However, productivity growth is a weak signal in the short run because it is affected by external factors such as the business cycle and by external factors such as the availability of finance.
The panel acknowledges that developing useful measures of innovation output is far more difficult than measuring inputs or patents, for example. The space of economically significant innovations is both diverse and expanding. Inno-
____________________
3One prominent model is presented by Crépon and colleagues (1998). This three-equation model has the following structure: (1) RD = f (Xr); (2) Innovation = g(RD, Xi); and (3) Productivity/other economic output = h(Innovation, Xp), where X’s are vectors of other factors relevant to the output (see also Mairesse and Mohnen, 2010; OECD, 2009).
4Sectors in which more than 50 percent of firms indicated that they were engaged in either product or process innovation between 2009 and 2011 were manufacturing—petroleum and coal products; chemicals (particularly basic chemicals; soap cleaning compound, and toilet preparation; paint, coating, adhesive, and other chemicals); machinery (particularly agricultural implement; engine, turbine, and power transmission equipment); computer and electronic products (particularly communications equipment; semiconductor and other electronic components; navigational, measuring, electromedical, and control instruments; other measuring and controlling devices); and transportation equipment (particularly guided missile, space vehicle, and related parts); or nonmanufacturing—information (particularly software publishers). See Appendixes H-K for specific details.
5Apple’s R&D/sales ratio has historically been relatively low compared with companies such as Google, Microsoft, Intel, and Samsung. For example, Apple’s R&D/sales ratio was at 2.27 percent in fiscal year 2012, approximately one-third of Samsung’s R&D/sales ratio. However, Apple may have benefited from R&D spending by suppliers such as Samsung and Intel.
TABLE 4-1 Research and Development (R&D) Firms Are More Likely to Innovate, but Most Innovating Firms Do Not Do R&D
| R&D Status of Firm | % of Firms with New or Significantly Improved Products or Processes | % of Total Firms in Scope* | ||
| Doing R&D | Not Doing R&D | Total | ||
| Firms Doing R&D | 64 | N.A. | 21 | 5 |
| Firms Not Doing R&D | N.A. | 12 | 79 | 95 |
NOTE: A firm that does R&D may produce many innovations, while a firm without R&D may produce only one innovation. However, BRDIS does not report on the number of innovations per firm.
*Approximately 1.2 million firms on a weighted basis are in scope, that is, reported to the survey.
SOURCE: Calculated by the panel from the 2011 BRDIS, Table 49; see Appendix K. For more information on innovation statistics from the 2011 cycle of BRDIS, see Business R&D and Innovation: 2011, which will be published in 2014. For previous cycles, the full set of detailed statistical tables is available in Business R&D and Innovation: 2008-2010 (NSF 13-332) at http://www.nsf.gov/statistics/nsf13332/start.cfm [April 2014]. Innovation statistics from the 2008 BRDIS are found in Tables 33-36, the 2009 BRDIS innovation statistics are found in Tables 82-85, and the 2010 BRDIS innovation statistics are found in Tables 126-129. Relative standard errors are available from NCSES staff upon request.
vation can include everything from the successful development and approval of gene therapy, to the development of the special high-strength glass used for smartphone screens, to the steady improvement of unmanned aerial vehicles used by the military in Afghanistan, to logistical warehouse management systems. Other significant contemporary innovations include Google’s AdSense/AdWords technology for targeted online advertising and Apple’s invention of the App Store concept, which enables small programming firms to sell and get paid for lightweight mobile applications. Although some may disagree, moreover, the creation of credit default swaps in the 1990s was almost certainly an economically significant innovation of a type that should be considered by NCSES.6
Nevertheless, it is clear that as a national goal, policies that encourage bringing more innovations to market are useful if they generate economic growth and jobs and improve the nation’s competitiveness. As discussed below, measures of innovation outputs are needed, and providing such measures is clearly within the purview of NCSES to support such policies.
RECOMMENDATION 4-1: The National Center for Science and Engineering Statistics should develop additional indicators for measuring innovation outcomes that would complement existing data on patents, inputs to innovation activities, and broader measures of economic performance.
POLICY RELEVANCE OF INNOVATION MEASURES
Information should not be collected in a vacuum. It is good business practice for NCSES to focus on developing new indicators that are useful for informing policy decisions, especially given the current fiscal environment. This section identifies some innovation-relevant policy questions that such indicators could help address. This is not to say that the indicators suggested here are relevant only for government policy makers; many of them should be useful to university administrators and business managers as well.
As noted above, the value of a measure of innovation is that it offers the possibility of a direct link between innovation outcomes and relevant policy variables, many of which are innovation inputs. In particular, one or more innovation measure can make it possible to test the impact on innovation of such factors as R&D spending, the availability of STEM labor, regulation, market power, globalization of research, immigration policy, and tax policy (see Box 4-2). Note that these factors can have either a positive or a negative effect on innovation, and it is essential for policy makers to know which way the arrow points and under what conditions.
Firm-level analysis also links investment in innovation to improved outcomes. Using the third Community Innovation Survey (CIS3) for 16 European countries, Jaumotte and Pain (2005) found that the proportion of firms engaged in innovation spending was closely correlated with the proportion of successful innovators in a country. Their results suggest that a 1 percentage point increase in aggregate innovation spending was associated with an increase of 0.85 percentage points in the probability of being a successful innovator and an increase of 0.7 percentage points in the share of new products in turnover.7
An analysis of innovative companies could shed light on such key policy questions as the appropriate amount and direction of federal R&D funding, limits on or encouragement of immigration of skilled workers, support for STEM
____________________
6According to one account, the concept of credit default swaps was developed in 1994 to help Exxon fund its huge potential liability for the Exxon Valdez disaster (see Tett, 2009).
7In this study, innovation spending included not only intramural R&D but also extramural R&D, other acquisitions of knowledge (such as rights to use patents, licenses, and software), investment in capital goods, expenditures on training, and spending necessary for the innovation to be placed on the market (for example, marketing or design expenditures). Non-R&D expenditures were sometimes more important than those on R&D, and many of the countries with the highest proportion of successful innovators also had the highest propensity to engage in non-R&D innovation spending—showing the importance of taking a broad view of innovation inputs.
BOX 4-2
Selected Innovation-Related Policy Questions
- What kinds of innovations create jobs and what kinds of jobs?
- What specific innovations have made the most important contributions to economic growth and over what time period?
- Where should the government spend its R&D dollars?
- Can government procurement policy be changed to encourage innovation?
- What new industries, occupations, and skill sets are being created by recent innovations, and are current educational institutions equipping enough people with the skills needed to take maximum advantage of these changes?
- How important is formal R&D to the innovative process, as opposed to organizational changes and continued on-the-job tinkering by employees and their managers?
- Does the globalization of R&D increase or decrease the ability to turn research into marketed innovations?
- Are U.S. firms conducting more or less of their research activities offshore and does it even matter where this activity takes place?
- Is the United States innovating more or less than other countries?
- Are small companies more likely to innovate than big companies? In which types of firms—small or large, young or mature—do the most important innovations occur, and is this pattern stable?
- How do service firms innovate and create new knowledge?
- What are the sources of funding for innovation activities, including R&D?
- Are potential innovations not reaching market because of too much regulation, taxes that are too high, or too much market power in product markets?
- Are potential innovations being stalled because of insufficient funding, not enough skilled workers, or too many obstacles to skilled immigrants?
- Are innovations not being brought to market or implemented because of misguided patent policies?
education at the graduate level, regulation of new products and services, rules for university technology transfers, and the appropriate role of R&D tax credits. Perhaps more important, innovation measures should help identify bottlenecks in the innovation system—cases in which most of the necessary inputs are present, but innovation apparently falls short of expectations. These are potentially high-return areas for policy, where relatively small policy changes could potentially lead to much better results.
The most striking potential bottleneck is in biomedical research, with the pharmaceutical industry and the National Institutes of Health having struggled over the past decade with how to turn increases in scientific knowledge into marketable innovations that improve human health outcomes. In this context, innovation measures could be helpful in two key ways. First, they would quantify the perception that commercialization of biomedical research is slower than expected. Second, they could help researchers offer insight into different possible explanations for the gap between knowledge and the market, providing useful guidance for policy makers.
On the broadest level, measures of innovation can help answer important policy-relevant questions such as those listed in Box 4-2. The list of such questions is easily much longer. However, current STI indicators are not fully capable of answering many of these questions.
THE ROLE OF INNOVATION SURVEYS
Currently, the most widely used tool for measuring innovation is the innovation survey. Innovation surveys ask firms about types of innovation in which they are engaged, reasons for innovating (or not), collaboration and linkages among firms or public research organizations, and flows of knowledge; they also collect quantitative data on sales of product innovations and spending on a range of innovation activities beyond R&D. They are designed to collect direct information on the elements of the knowledge-to-production system without asking about particular innovations or details thereof. They provide fairly detailed guidance to respondents about what is or is not an innovation, and allow for comparison of levels of reported innovation across organizations/ countries and for analysis of the determinants of reported innovation and their link to economic output (Stone et al., 2008).
The Business Research and Development Innovation Survey (BRDIS)
In 2008, the National Science Foundation (NSF) launched the BRDIS, which collects key information on innovation as well as a wide range of other variables. Although the 2008 BRDIS was a pilot survey, it did yield some data on the incidence of product and process innovation among firms by sector (including services), size class, and whether respondents reported R&D activity (Borousch, 2010).8 Questions on innovation were augmented in the 2009 and 2010 versions of the survey, allowing for comparison of innovation statistics across several countries.9Box 4-3 has selected innovation questions from the 2011 version of BRDIS (U.S.
____________________
8The data are based on the 2008 BRDIS, which was launched in January 2009. See National Science Foundation (2013a) for the BRDIS questionnaire.
9It is widely known that the innovation statistics from BRDIS and the CIS lack comparability; see an explanation in Hall (2011). Also see the discussion of the disparities between the U.S. and European innovation statistics later in this chapter.
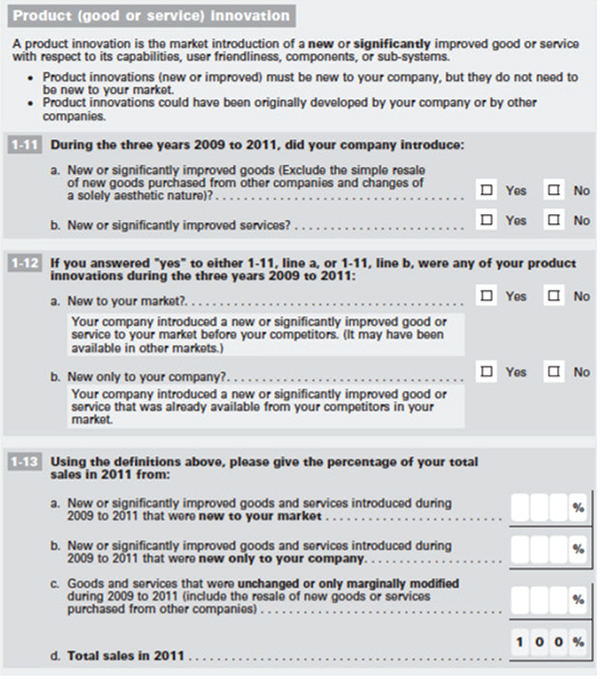
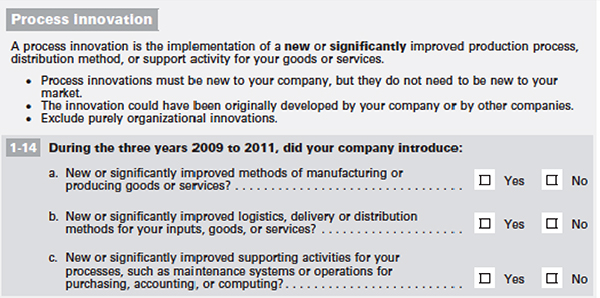
BOX 4-3
Innovation Questions on the 2011 Business Research and Development and Innovation Survey (BRDIS)
SOURCE: Available: http://www.nsf.gov/statistics/ [January 2014].
Department of Commerce, 2012), which contained sections on: the 2011 survey was in the field as of this writing (see Box 4-3 for selected innovation questions from the 2011 survey). The 2011 version of the BRDIS (U.S. Department of Commerce, 2012) contained sections on:
- innovation, reported by the nature of the innovation (new product or new process), and the percentage of sales coming from newly introduced products;
- R&D spending, reported by business code, country, state, funder, and performer;
- characteristics of R&D spending, reported by type (basic versus applied versus development) and area of focus (e.g., biotechnology, nanotechnology);
- R&D employees, by type (scientists and engineers versus technicians and technologists); and
- use of intellectual property, including patents, and trademarks.
NCSES’s efforts to revise BRDIS are aimed at gathering more information on innovation activities, going beyond simple “yes/no” questions on whether a firm introduced or significantly improved goods, services, or processes. These efforts also are aimed at enhancing comparability with key questions in the CIS and ensuring that the questions on innovation are answered by firms that do not conduct R&D. Comparability of the BRDIS and CIS data also depends on surveying similar populations of firms and on the techniques used to derive estimates from the data.
As befits a cutting-edge survey, BRDIS is still evolving. It is important to recognize that such concepts as invention, innovation, and technology diffusion are on a continuum, and there is still debate regarding their respective space on that continuum. As NCSES develops surveys, new datasets, and new indicators of innovation activities, it will be important to attempt to establish rigorous standards for defining these terms. Such standards will have implications for innovation surveys internationally and for the comparability of data produced by those surveys. NCSES’s role in the working group of OECD’s National Experts on Science and Technology Indicators (NESTI) gives the agency a good opportunity to contribute to the development of more precise standardized definitions and their implementation through surveys such as the CIS and BRDIS when the Oslo Manual on innovation (OECD-Eurostat, 2005) is next revised.
In addition to the lack of standard definitions, other factors can limit the comparability of U.S. and European data on the innovativeness of firms (see the discussion of international comparability later in this chapter in the section on improvements to BRDIS). These factors include the use of different survey frames, of different size cutoffs (BRDIS uses businesses with 5 or more employees, while other countries use businesses with 10 or 20 more employees), the impact of a lengthy R&D and innovation survey, sampling errors, and weighting issues. NCSES and OECD are actively collecting evidence to assess the factors that may drive biases in international comparisons. (See Table 4-2 for a list of websites for innovation surveys from regions around the world.)
Complete cognitive testing of the questions used on innovation surveys is ongoing in the United States and Europe. Nevertheless, the data are useful for preliminary snapshots. OECD-NESTI has been conducting a cognitive testing research project since 2011, with participation by representatives from the United States and other countries. The project is examining how businesses define and measure innovation. This effort is motivated by the sizable gap between estimates in the United States and Europe on the incidence of innovation among firms, with 2008 BRDIS data being used as the baseline for U.S. innovation statistics. The 2009 and 2010 BRDIS instruments included some systematic variations aimed at determining whether the way innovation questions were being asked substantially influenced the incidence answers provided. During a discussion with panel members, NCSES staff indicated that the conclusion to date is that there is no major difference in the statistics due to the phrasing of the questions. The weak result on innovation changed little when the questions were moved to the front of the 2009 BRDIS (see Table 4-3). The relatively low reported incidence of innovation in the United States compared with European nations remains an issue for further research by NCSES and its partners in OECD-NESTI.10 In addition, the size dependence of the propensity to innovate may contribute to the weak results, suggesting that the Table 4-3 should be produced for at least three employment cutoffs (see Recommendation 4-2 later in this chapter).
Other U.S. Public and Private Innovation Surveys
BRDIS is not the only source of innovation-related data in the United States. Other agencies collecting information on innovation include the Bureau of Labor Statistics (BLS) in the U.S. Department of Labor, the Census Bureau, the Bureau of Economic Analysis (BEA), the National Institute of Standards and Technology (NIST) in the U.S. Department of Commerce, and the Economic Research Service in the U.S. Department of Agriculture. Indeed, if the subject is broadened to STI, then at least six agencies collect these data, including the National Center for Education Statistics, which collects data on STEM education.
The surveys administered by these agencies contain a wide range of useful global, national, state, and local indicators. However, most rely on policy indicators or indicators of inputs to innovation activity; they contain very few measures
____________________
10This is a reminder that innovation is difficult to measure, and international comparability is difficult to achieve. Not all business strategy is “innovation.” Improved business value and other success indicators can come from various quarters. Can companies distinguish innovation from, say, “continuous improvement” or other noninnovation business enhancers? How can innovation and its impact on a business be measured? These are basic questions that the cognitive testing project is considering.
TABLE 4-2 Websites for Innovation Surveys from Regions Around the World
SOURCE: Adapted from Hall and Jaffe (2012).
TABLE 4-3 Percentage of Firms Reporting Innovation, BRDIS 2008-2011
| Type of Innovation | 2006-2008 (%) | 2007-2009 (%) | 2008-2010 (%) | 2009-2011 (%) |
| Goods | 4.6 | 5.8 | 5.5 | 5.4 |
| Services | 6.9 | 9.1 | 7.8 | 6.8 |
| Manufacturing/production methods | 3.6 | 4.4 | 4.1 | 3.8 |
| Logistics/delivery/distribution methods | 3.1 | 4.1 | 3.7 | 3.2 |
| Support activities | 6.9 | 9.3 | 8.2 | 7.2 |
NOTE: In the 2008, 2009, 2010, and 2011 BRDIS, companies were asked to identify innovations introduced in 2006-2008, 2007-2009, 2008-2010, and 2009-2011, respectively.
SOURCE: Tabulations from the 2008-2011 BRDIS.
of innovative outputs. This gap illustrates the importance of BRDIS, and it also suggests that these agencies, to the extent possible, should be working together (see Recommendation 8-2 in Chapter 8).
Limitations of Innovation Surveys
The panel strongly supports the increased use of innovation surveys as a way to measure the output of the innovation system. Later in this chapter, new, nontraditional methodologies for measuring innovation are discussed. In this section, however, the panel underscores the inherent limitations of any survey of innovation inputs and outputs.
First, surveys are time-consuming and expensive for the companies asked to complete them, as well as for those that must compile, validate, and publish the results. The quality of the survey depends not only on the number of responses, but also on the amount of time and level of personal attention paid to them by respondents, which surely vary across companies. Surveys of individuals, such as those relating to the career paths of scientists and engineers discussed later in this report, are becoming increasingly problematic because of declining response rates.11 NCSES also experiences
____________________
11See the National Research Council (2013a) report on survey nonresponse. The report finds that “for many household surveys in the United States, response rates have been steadily declining for at least the past two decades. A similar decline in survey response can be observed in all wealthy
delays in obtaining data on firms, as is clear from the delays in publishing statistics from BRDIS.
A second limitation of innovation surveys is that the nature of the economy is rapidly changing, largely as a result of innovation itself. As a consequence, new and interesting subjects (such as outsourcing of R&D or the rise of “big data”)12 on which survey questions and answers would be desirable are constantly coming to the attention of policy makers and researchers. Yet because of the many lags built into the survey process—from survey design, to survey deployment, to compilation and validation of results, sometimes across multiple agencies—results may be stale or of limited use once they are published. Timing also is important because rates of dissemination of new knowledge and products are important variables of interest. Furthermore, in the current budgetary environment, it will be difficult if not impossible for NCSES to mount new surveys in the future without cutting back on those it already undertakes.
Third, large, multinational companies that report R&D expenditures report where they conduct the R&D (and thus spend money on salaries, equipment, and the like). They rarely if at all, however, report to the public and government statistical agencies the impacts of their R&D on their operations, and specifically the extent to which the location of the R&D leads (or does not lead) to the creation of jobs and income in the United States.
Fourth, the traditional classification of economic transactions into goods and services can miss important innovations that do not fall easily into either of these categories. A good example is the rise of data as a separate economic category or product. Innovations in constructing and analyzing databases are becoming increasingly important in an ever-expanding range of industries—not only Internet search, but also retailing and manufacturing and now even health care. These innovations are important, but their economic value is difficult to measure and categorize.
Fifth, a more general challenge is that some innovations—the precise share is unknown—do not result in increased output, at least as conventionally measured. Accordingly, “production functions” that relate R&D to increased output may not be capturing well the real economic impact (or spillover effects) of some innovations. For example, the activity of someone in Germany downloading a free application written in the United States will not show up in either the U.S. trade or output statistics. Similarly, an increase in Internet search activity will not show up as an increase in consumer expenditures (Mandel, 2012).
Sixth, although economists have long viewed innovation as unfailingly positive, extending the so-called “production-possibility” frontier, recent events suggest that this is not always the case. Various (but not all) financial innovations, for example, had perverse effects that contributed to the financial crisis of 2007-2008, which in turn led to the Great Recession (see, e.g., Litan, 2010). Likewise, while innovations and communication that have facilitated the growth of trade can make some countries better off, some countries or portions of their population (unskilled workers in particular) may be made worse off in a globalized economy (see, e.g., Samuelson, 1962).
Finally, the virtue of innovation surveys is that they provide an overall picture of firms’ innovation activity. However, experience suggests that the subjective nature of survey responses poses some difficulties for interpretation. In particular, the percentage of self-reported innovative firms varies across countries in unexpected ways. According to the 2009 BRDIS, for example, only 6.4 percent of U.S. firms had introduced new or significantly improved goods in the previous 3 years, while only 10.3 percent reported new or significantly improved services. By contrast, the percentage of German firms reporting themselves as innovative in the period 2005-2007 was far higher, at 79.9 percent.13 In part, this large and surprising disparity may reflect differences in survey methodology and questions. Even within the European Union (EU), however, unexpected differences are seen, with Germany reporting far higher rates of innovation than the Netherlands (44.9 percent) and the United Kingdom (45.6 percent).
The panel does not have recommendations for NCSES for responding to each of these challenges. Rather, the challenges are described here to give a sense of how changes in the economy lead to difficulties in measuring innovation and its impact. The panel does have some thoughts about general processes NCSES can follow to stay abreast of these changes and meet these challenges, which are outlined later in this and subsequent chapters of the report.
This section examines improvements that could be made to BRDIS in five areas: (1) international comparability; (2) deeper information on innovations; (3) extensions to cover organizational and marketing innovations, unmarketed innovations, and a broader array of inputs to innovation; (4) improvements to the presentation of information; and (5) better linkages between BRDIS data and other datasets.
____________________
countries” (National Research Council, 2013a, p. 1). The report also documents declining response rates for a variety of surveys, including panel and longitudinal surveys (pp. 14-30).
12The term “big data” technically refers to a collection of data so large and complex that it is difficult to store in one place and difficult to manage. Recently, however—and in this report—the term has come to refer to data that are gathered from sources other than surveys, such as administrative records, websites, genomics, and geographic sensors, to name a few. Statistically, the term and its characteristics are still being codified.
13The U.S. statistic was calculated from the NSF summary sheet on BRDIS. The statistics for German firms are found in Eurostat (2010).
International Comparability
One impediment to understanding and assessing innovation in the United States is the lack of comparability between U.S. STI indicators and those developed by other countries.
Comparability of BRDIS and CIS data requires surveying similar populations of firms in comparable size categories and using similar techniques to derive estimates of innovation from the raw data collected. Also needed for comparability are statistics using the same set of industries typically used in statistics for other countries. An example is the core set of industries used by Eurostat for comparison of innovation statistics among EU countries, including mining; manufacturing; and selected service industries, such as wholesale trade, transport services, financial services, information technology (IT) services, R&D services, and business services. These data could be used to compile a simple indicator of the share of product-process innovative firms, defined as firms that have implemented a product or process innovation.
Deeper Information on Innovations
Even with more comparable statistics on innovation, it still will not be clear to users that firms are representing the same or similar things when they report product or process innovations. The BRDIS questions do not give enough information to provide a full understanding of what the resulting data and statistics mean. For example, users have no independent measure of whether the innovations of firms that innovate but do not conduct R&D are more or less important than those of firms that conduct R&D. Users would have more confidence in and understanding of the BRDIS innovation measures if they knew that knowledge input measures were correlated with actual performance. Users would have even more confidence in the measures if they knew what firms meant by innovation—how closely company reporting on the survey matched NCSES’s definition of innovation.
Without greater detail on specific innovations, moreover, the surveys paint an exceedingly broad picture of innovation. Knowing, for example, that 60 percent of a country’s firms have introduced some type of innovation does not help in understanding why and how innovation happened, what impacts it has on the economy, and how it can be encouraged. Indicators should provide not only a level but also insight into how that level was achieved. Microdata from innovation surveys connected with other data on a firm might help achieve this goal, but this approach has as yet not been exploited. Most innovative firms introduce both product and process innovations, as well as organizational or marketing innovations (discussed below), and the impacts of the innovations are likely to depend on many other business decisions (see OECD, 2010; Stone et al., 2008).
In a recent study conducted in Australia (Arundel et al., 2010), respondents were asked to describe their most important innovation, and experts then classified these examples according to whether they met the requirements for an innovation. The study results provide valuable information on how respondents perceive innovations and on what innovation indicators represent. They also indicate which types of innovations are deemed most important for business performance; in many cases, examples of new organizational methods and new marketing concepts and strategies were cited.
NCSES might want to consider including an open question in BRDIS on the most important innovation or innovations produced by the firm over the previous 3 years. Alternatively, NCSES might want to consider commissioning a study similar to that of Arundel and colleagues (2010) on a subset of responses to BRDIS to determine what firms are measuring as innovation. It would be useful to have firms of different sizes, different sectors, and different geographic locations represented in such a study.
Extensions to BRDIS
There are three important ways in which BRDIS could be extended to make it more useful for policy purposes. First, the innovation questions could be broadened to include organizational and marketing innovations. Second, it might be appropriate for policy makers if the survey included the category of “unmarketed” innovations, reflecting the reality that an innovation may be ready to be marketed but be held back by such factors as regulation, financial constraints, or the market power of incumbents. Third, the survey could track a broader array of inputs to innovation, including non-R&D investments such as design, market research, and databases.
Organizational and Marketing Innovations
The communications sector, broadly defined to include communications-related hardware and software as well as telecommunications providers, has clearly been one of the most innovative sectors of the economy in recent years. Within this sector, smartphones are a prominent example of product innovation, while increases in mobile broadband speed exemplify process innovation. Other recent innovations in the communications sector, however, do not fit so neatly into the product and process categories. These innovations include social media, such as Twitter, Facebook, and LinkedIn; search, exemplified by Google and Microsoft; web marketing and advertising, exemplified by Google’s AdSense/AdWords technology (see Box 4-4); and the availability of mobile applications through Apple’s App Store.
To identify such successful and important innovations as AdSense/AdWords, NCSES may need to broaden the scope of the innovation questions on BRDIS to include organizational and marketing innovations as identified by the Oslo Manual (see Box 4-5). In addition, NCSES might consider introducing a question about significant new data algorithms as a category of innovation. Such a question would require
BOX 4-4
Anatomy of a Marketing Innovation
Google’s AdSense/AdWords advertising technology is one of the most successful marketing innovations ever achieved. This technology, originally implemented piecemeal from 2000 to 2003, allows Google to place advertisements automatically on its own webpages or those of partner sites, depending on the webpages’ content. At the same time, an advertiser can bid for the right to be included in these placements. A retailer selling umbrellas, for example, can bid for the right to place an advertisement on any webpage using the term “rain.”
The AdSense/AdWords technology was clearly an innovation and proved remarkably difficult for competitors such as Yahoo! and Microsoft to match. Moreover, the technology allows Google to monetize successfully such product innovations as Gmail.
SOURCE: Edelman et al. (2007).
significant new conceptual development, but would help capture technological developments in some of the most dynamic sectors of the economy.
Unmarketed Innovations
A second potential expansion of the BRDIS innovation questions could be extremely useful to policy makers. As noted earlier, according to the current definition of innovation, a product must be bought to market, or implemented, to be considered an innovation. A new product, for example, does not count as an innovation unless it can be purchased or used by a consumer or a business.
From the perspective of the macroeconomic impact of innovation on growth and productivity, such a requirement makes sense. An innovation cannot affect economic performance unless it can be marketed or implemented. It is also important to understand, however, why some industries and some countries appear to produce innovations at a rapid pace, while others are less productive in turning innovative activities into marketable innovations. Part of the explanation is that promising innovations can be stalled by a variety of factors.
First, a tightening of approval regulations for scientific, political, or legal reasons can result in fewer innovations coming to market, even if the pace of technological advance stays the same.14
Second, the nature of payment systems can have a similar dampening effect on marketable innovation, especially in the case of health-related innovations that require long and expensive testing and are dependent on the willingness of Medicare and insurance companies to reimburse. For example, pharmaceutical companies avoided bringing vaccines to market because the reimbursement for them was relatively low, and the potential exposure to lawsuits was relatively high (Offit, 2005).
Third, in some industries, the market power of incumbents may be an important deterrent to the commercialization of
BOX 4-5
Four Forms of Innovation
The Oslo Manual (OECD-Eurostat, 2005, pp. 48-52) identifies four forms of innovation. The 2012 Community Innovation Survey (Eurostat, 2012) employs the following definitions of these forms of innovation:
Product: A product innovation is the market introduction of a new or significantly improved good or service with respect to its capabilities, user friendliness, components or sub-systems. Product innovations (new or improved) must be new to your enterprise, but they do not need to be new to your market. Product innovations could have been originally developed by your enterprise or by other enterprises or institutions. A good is usually a tangible object such as a smartphone, furniture, or packaged software, but downloadable software, music and film are also goods. A service is usually intangible, such as retailing, insurance, educational courses, air travel, consulting, etc.
Process: Process innovations must be new to your enterprise, but they do not need to be new to your market. The innovation could have been originally developed by your enterprise or by other enterprises, and excludes purely organizational innovations
Organizational: An organizational innovation is a new organizational method in your enterprise’s business practices (including knowledge management), workplace organization or external relations that has not been previously used by your enterprise. It must be the result of strategic decisions taken by management, and excludes mergers or acquisitions, even if for the first time.
Marketing: A marketing innovation is the implementation of a new marketing concept or strategy that differs significantly from your enterprise’s existing marketing methods and which has not been used before. It requires significant changes in product design or packaging, product placement, product promotion or pricing, and excludes seasonal, regular and other routine changes in marketing methods.
SOURCE: The 2012 Community Innovation Survey (Eurostat, 2012).
____________________
14The panel notes that some regulations achieve societal goals that increase social well-being and that advancing innovation clearly is not the only means of advancing a society’s goals.
potential innovations. For example, if companies lack access to important sales channels that are controlled by incumbents, then they may not find it worthwhile to commercialize a new product even if that product would be economically viable in a more competitive market.
Finally, in some cases, a potential innovation may not be introduced to market because of the need for other, complementary innovations. A classic example is Chemcor, an ultrahard glass invented in the 1960s by Corning. Because of the cost of production, Chemcor did not find a place in the market until 2006. Renamed Gorilla Glass, it became the product of choice for cell phone screens.
The concept of unmarketed innovations is implicit in an existing question on the CIS:
During the three years 2010 to 2012, did your enterprise have any innovation activities that did not result in a product or process innovation because the activities were
- abandoned or suspended before completion
- still ongoing at the end of 2012
The panel believes NCSES should consider adding a similar question to BRDIS. NCSES might also consider asking respondents to rank the main reasons why the outputs of their innovation activities have not yet been marketed or implemented, including not yet ready, lack of funding, lack of sufficient skilled labor, the need to meet regulatory requirements, or blocked from market by competitors. The panel acknowledges that such questions may be difficult for respondents to answer, although such a question on factors hampering product and process innovation has been asked in the CIS for some years (Eurostat, 2012). If such questions were added to BRDIS, then the insights they would yield into bottlenecks for innovation could be quite useful.
A Broader Array of Inputs to Innovation
The panel is aware of the budget constraints faced by NCSES. With these constraints in mind, the panel notes that BRDIS could collect other types of data that would be helpful for policy makers. Hall and Jaffe (2012), whose paper was commissioned for this study, note that it would be helpful to have more information on the amount spent on different kinds of innovation activities. For example, BRDIS currently asks respondents whether they “acquired more than 50 percent ownership in another company for the primary purpose of acquiring their IP [intellectual property].” However, it would also be useful to know how much the company spent on the acquisition of external knowledge, marketing and design of the improved goods or services, and other innovation activities. These questions are drawn from question 5.1 of the CIS, which asks specifically about:
- “acquisition of advanced machinery, equipment, software and buildings to be used for new or significantly improved products or processes (excluding expenditures on equipment for R&D);
- acquisition of existing know-how, copyrighted works, patented and non-patented inventions, etc. from other enterprises or organisations for the development of new or significantly improved products and processes;
- in-house or contracted out training for your personnel specifically for the development and/or introduction of new or significantly improved products and processes;
- in-house or contracted out activities for the market introduction of your new or significantly improved goods or services, including market research and launch advertising;
- in-house or contracted out activities to design or alter the shape or appearance of goods or services; and
- other in-house or contracted out activities to implement new or significantly improved products and processes such as feasibility studies, testing, tooling up, industrial engineering, etc.” (Eurostat, 2012, p. 6).15
While having reliable data on these innovation-related expenditures would be useful, it may be difficult for companies to report these expenditures if they do not already record them in their accounts. Interviews and testing with companies would help in discerning which types of expenditures can be reported reliably. Expenditures on training and design may be among the most feasible to measure and are important for non-R&D innovation activities. Data on innovation-related expenditures may also provide useful input for the development of statistics on knowledge-based capital and “intangible assets” (discussed in Chapter 5).
Improvements to the Presentation of Information
NCSES has long been focused on providing information on levels of R&D funding by performing and funding sector. The agency’s core tables on R&D report dollar amounts of R&D, both nominal and real, and R&D as a share of gross domestic product (GDP). In addition, BRDIS collects a wealth of other policy-relevant information that has the potential to provide guidance for policy makers. In February 2012, for example, NCSES published an InfoBrief on business use of intellectual property.
At the same time, NCSES could greatly improve the usefulness of its surveys by quickly publishing more “crosstab” tables on key policy issues, or by making it easier for researchers and policy makers to access quickly the underly-
____________________
15There are some differences between the 2010 and 2012 CIS for this and other questions. The 2012 version includes copyrighted works under acquisition of existing knowledge. It also clarifies that the activities may be in-house or contracted.
ing data necessary to construct such tables.16 A crosstab table shows the interrelationship of two variables. For example, BRDIS collects information on the amount of research spending outside the United States by U.S.-based companies. That information is important in itself, and NCSES has published the breakdown of foreign versus domestic R&D spending for different industries. From the perspective of policy, however, it is also useful to know whether companies that conduct a higher share of their R&D overseas relative to other companies are more or less likely to report innovations. That is, is globalization of R&D linked with a higher or lower propensity to innovate? Such a table, if published by NCSES, could help guide policy makers, stimulate research, and inform public debate on U.S. innovation policies.
RECOMMENDATION 4-2: The National Center for Science and Engineering Statistics should build on its Business Research and Development and Innovation Survey (BRDIS) to improve its suite of innovation indicators in the following ways:
- tabulate the results from BRDIS using the same cutoffs for firm size (as well as comparable industry sectors) that are used by OECD countries in order to facilitate international comparisons;
- fund research exploring precisely what companies mean when they report an innovation or report no innovation on BRDIS—such research would help inform current policy debates;
- broaden the innovations tracked by BRDIS to encompass organizational and marketing innovations, as well as new data algorithms;
- consider adding a section to BRDIS on unmarketed innovations, giving respondents the opportunity to cite the main reason these innovations have not yet been marketed or implemented;
- as funds permit, extend BRDIS to gather information on innovation-related expenditures in such areas as training and design; and
- publish more results from BRDIS that link innovation to business characteristics, including the amount of research and development spending by U.S.-based companies outside of the United States. Production and distribution of such cross-tabulations should be timely, and they should address contemporary policy questions.
The globalization of research is only one example of an area in which presentation of a crosstab table could be helpful for policy makers. Box 4-6 identifies examples of policy-relevant questions for which a crosstab table could be useful, especially if published in a timely manner. With access to the raw data, it is relatively easy for NCSES to construct high-interest crosstab tables and publish them quickly. Such a process is important to the agency’s mission of providing statistics that are relevant to policy makers and the public.
BOX 4-6
Examples of Questions That Could Be Informed by Policy-Relevant Crosstab Tables
Compared with other companies:
- Are companies that perform research overseas more likely to report innovations?
- Are companies that perform research in California more likely to report innovations?
- Are companies that collaborate with other companies more likely to report innovations?
- Are companies that partner with academic institutions more likely to report innovations?
- Are companies that have a high percentage of science, technology, engineering, and mathematics personnel more likely to report innovations?
- Are companies that acquire intellectual property more likely to report innovations?
- Are companies in regulated industries more likely to report unmarketed innovations?
- Are companies engaged in health care research more likely to report unmarketed innovations?
- Are companies created to commercialize academic research more likely to report unmarketed innovations?
The panel also found that NCSES’s limited access to some datasets constrains the timely development of innovation indicators. For instance, some data are available at the U.S. Census Bureau’s research data centers before NCSES has on-site access to those data at its Survey Sponsor Data Center (SSDC). This is the case for the BRDIS data, which the Census Bureau collects on behalf of NCSES. Ready access to these data is imperative if NCSES is to satisfy the demands of users for timely innovation statistics. Housing the BRDIS data in the SSDC would be one key way to improve the timeliness of the statistical analysis of the data and the publication of related R&D and innovation indicators.
RECOMMENDATION 4-3: The Survey Sponsor Data Center at the National Science Foundation should house the Business Research and Development and Innovation Survey data, improving access to the data for National Center for Science and Engineering Statistics staff who develop the research and development statistics.
____________________
16Timeliness and relevance are both data quality measures (see Recommendation 8-1 in Chapter 8).
Linkages Between BRDIS Data and Other Datasets
The data gathered in BRDIS could be used to begin developing statistics on high-growth firms and “gazelles.” The Manual on Business Demography Statistics (OECD-Eurostat, 2008, Chapter 8, p. 61) defines high-growth enterprises as “all enterprises with average annualised growth greater than 20% per annum, over a three year period…. A size threshold has been suggested as 10 employees at the beginning of the growth period.” Gazelles are the subset of high-growth enterprises that are up to 5 years old (OECD-Eurostat, 2008, Chapter 8, p. 63). These thresholds are arbitrary and based only on convention. NCSES could conduct its own sensitivity analysis to fine-tune the definitions of high-growth firms and gazelles.17
During the panel’s July 2011 workshop, several speakers18 mentioned the importance of tracking trends in the sustainability of jobs in these types of firms during economic downturns (even if total employment is small). It would also be useful to have firm data by age classes to determine over time whether high-growth firms or gazelles in particular have a higher incidence of innovation activity relative to other firms. In his presentation at the July 2011 workshop, Hollanders showed that high-growth firms are significantly more innovative than other firms in his dataset. The connection between high-growth firms and innovation is complex, and these data would help researchers better understand it. Statistics on high-growth firms and gazelles could also be used to answer the question of whether these types of firms drive economic and job growth. A simple table could compare the economic characteristics of high-growth and other firms that are and are not innovative, ideally over time.
At the panel’s September 2011 meeting in Washington, DC, representatives from BLS, the U.S. Census Bureau, and BEA mentioned that linking certain datasets among them would yield reasonable numbers on gazelles. A table with these numbers could be added to the Science and Engineering Indicators or become the foundation of an InfoBrief. The following indicators could be produced using BRDIS and other data on high-growth firms and gazelles: number of high-growth enterprises as a percentage of the total population of active enterprises with at least n-number of employees, and number of gazelles as a percentage of all active enterprises with at least n-number of employees that were born 4 or 5 years ago. These indicators would be comparable to those produced in several other countries, thus increasing users’ understanding of the comparative position of the United States on an aspect of the country’s innovation capacity.
NCSES has a unique set of data in BRDIS, which, if combined with other datasets, could be instrumental in answering these and other important questions. Integrating data on firm dynamics (and the related employment effects) would take time and resources. During his presentation at the workshop, Haltiwanger described three Census Bureau datasets that, together with BRDIS data, would allow NCSES to develop indicators of business dynamics:
- Longitudinal Business Database—tracks all establishments and firms with at least one employee, including start-ups, from 1976 to the present;
- Integrated Longitudinal Business Database—tracks all nonemployer firms and integrated-with-employer firms from 1994 to the present; and
- Longitudinal Employer-Household Dynamics—tracks longitudinally all employer-employee matches and transitions (hires, separations, job creation, and job destruction) from 1990 to the present.
Questions from the Census Bureau’s 2007 and 2012 Economic Census, Company Organization Survey, and Management and Organizational Practices Survey can also yield useful information on R&D and other innovation activities for establishments. In addition, infrastructure datasets can track relationships between start-up and young high-growth firms and large, mature firms, and can be linked further to patent and citation data. Important as well is to link data on firm dynamics to those on innovation outputs, such as patent and citation data.
Haltiwanger proposed that indicators track firm dynamics by geography, industry, business size, and business age. Hollanders noted that European countries and other OECD members are continuing to fine-tune their measures of firm dynamics. NCSES’s indicators on this dimension could further the international comparability of its STI indicators. Building the foundations for indicators of firm dynamics using BRDIS and other datasets would give NCSES a productive platform for developing several STI indicators that are policy relevant.
Clearly, developing publishable statistics on high-growth firms and gazelles is a multistage task requiring data acquisition and linkage in addition to use of the data available from BRDIS. A good first step would be for NCSES to explore linking its BRDIS data with data on firm dynamics from BLS.
RECOMMENDATION 4-4: The National Center for Science and Engineering Statistics (NCSES) should begin a project to match its Business Research and Development and Innovation Survey data to data from ongoing surveys at the U.S. Census Bureau and the Bureau of Labor Statistics. It should use
____________________
17Petersen and Ahmad (2007) present a technique for conducting this type of analysis in OECD (2007).
18Howard Alper, University of Ottawa; Robert Atkinson, Information Technology and Innovation Foundation; John Haltiwanger, University of Maryland; Hugo Hollanders, United Nations University’s Maastricht Economic and Social Research Institute on Innovation and Technology (UNU-MERIT); and Brian MacAulay, National Endowment for Science, Technology, and the Arts.
the resulting data linkages to develop measures of activities by high-growth firms, births and deaths of businesses linked to innovation outputs, and other indicators of firm dynamics, all of which should be tabulated by geographic and industry sector and by business size and business age to facilitate comparative analyses. NCSES should conduct a sensitivity analysis to fine-tune meaningful age categories for high-growth firms.
USE OF NONTRADITIONAL METHODOLOGIES
Traditionally, NCSES and its predecessors have used surveys to trace the inputs and outputs of the innovation system. As noted earlier, however, executing a survey is an expensive and time-consuming process, requiring writing and testing questions, identifying the universe of potential respondents, collecting the data, cleaning and validating the data, analyzing the data, and then finally publishing the results. Thus, for example, NCSES did not publish the topline R&D spending results from the 2009 BRDIS until March 2012.
Another issue with government surveys is that those being surveyed may not respond, and when they do, they are almost always guaranteed confidentiality. As a result, some or even many results must be withheld to avoid disclosing, even indirectly, the responses of individual companies. In the basic table showing R&D spending by industry and source of funding from the 2010 and 2011 BRDIS (Table 2 in InfoBrief 13-335), for example, 37 and 36 (respectively) of the 154 cells are suppressed. The significance of this problem grows when more detailed industries or subnational areas are considered. Take, for example, the interesting question of whether the location of R&D conducted by the IT industry is becoming more or less concentrated in Silicon Valley. If BRDIS were to ask companies to apportion their research spending by metro area, the data for most metro areas across the country would likely have to be suppressed because information on a specific firm might be identified in cases involving a small number of firms in a given sector or region. It might even be difficult to obtain useful data at the state level for the same reason.
Until fairly recently, there was no good alternative to surveys for collecting data on innovation inputs and outputs. Increasingly, however, businesses and individuals are generating detailed electronic data in the normal course of their economic activity. Such data are available either in a firm’s administrative records, publicly on the web, or from third parties that collect them in the normal course of economic activity, and can be obtained in digital form from a given firm. Such nontraditional data are referred to here as “business practice” data. Examples of these data include several datasets derived from the Internet: (1) reports on innovations, (2) help-wanted ads, (3) journal articles on new products and services, (4) altmetric measures of scientific and engineering activities,19 and (5) trademark databases.20 This section examines the advantages and disadvantages of business practice data from the perspective of NCSES. Further discussion of the use of these types of data for developing STI indicators appears in Chapter 7 of this report.
Conceptual Background
The use of business practice data as a supplement to traditional surveys is under active consideration in statistical agencies. Robert Groves, then director of the Census Bureau, recently delineated the key issues entailed in using these data (see Box 4-7), noting: “Combined, the ‘big data’ and the benchmark survey data can produce better statistics.” The advantages of business practice data include
- Timeliness—Collecting and analyzing survey data is a lengthy process. Because most business practice data today are digital, they can be available for analysis in near real time.
- Detail—Survey data offer limited detail by industry and geographic location. Business practice data can be used to track innovation activity by detailed industry or subnational area.
- Flexibility—Survey methods require making some assumptions about the nature of innovation many years in advance. The ability to adjust the measuring tool easily is helpful, particularly when new categories of innovation emerge.
At the same time, business practice data have disadvantages that make them an imperfect substitute for conventional surveys. These disadvantages include
- “Institutional drift”—Business practice data are generated by normal business activity, but because patterns of business activity change over time, interpretations of business practice data are not necessarily stable.
- Difficulty with cross-industry/cross-country comparisons—Different industries and countries may have very different business practices.
____________________
19“Altmetrics are alternative measures that can supplement citation counts and journal impact factors as measures of the impact of scholarly communications. Such measures are generally derived from online activity such as mentions, downloads, tweets, blog posts, Facebook “likes,” bookmarking and other similar evidence of attention” (Travis, 2013).
20Note that not all business practice data fall into the category commonly referred to as “big data.” For example, administrative records are included in the panel’s definition of business practice data but are not considered “big data.” Also note that the term “big data” had not been formally codified by statistical agencies at the time this report was being written. Lastly, “big data” is not a panacea (see Boyd and Crawford [2011] for important caveats).
BOX 4-7
“And Now, for Something a Little Different” Excerpt from a Blog Post by Robert Groves, Director, U.S. Census Bureau
If we had access to customer purchase transactions volume, we might construct models blending our benchmark sample survey data with the continuous transaction data, to produce more timely and more disaggregated estimates. The strength of the transaction data will be their timeliness and the large number of transactions they reflect; their weakness will be that they do not include many transactions conducted in ways other than those the data reflect (e.g., cash might be omitted). The strength of our benchmark survey will be its statistical coverage of the entire population of business units; its weakness is its lack of timeliness and its relatively small sample size of firms. Combined, the “big data” and the benchmark survey data can produce better statistics.
Sometimes the link between our sample surveys and the big data will be time, other times it will be space. “Big data” will be useful for constructing small area estimates. For example, internet sites listing asking prices for houses may be accompanied with exact location of the units. Their strength is that they offer millions of records of prospective sales; their weakness is that they don’t cover all areas of the country, not all sales are covered, and asking prices are not sale prices. Our sample survey on residential sales offers statistical coverage of all sales, but its sample size is too small to provide statistics on all areas. Combining the two data series might offer more spatial detail.
At other times, the link between the big data and our sample survey data may be measures that are highly correlated to our key statistics. For example, we might have access to traffic volume data continuously streaming based on traffic cameras, with location codes to permit fine spatial detail. Our sample survey reports of commuting times from home to place of work might be enhanced by statistically combining them with the traffic count data from available cameras. The strength of the traffic camera counts would be very fine grain detail on time; the weakness would be coverage of all roads and counts of commercial traffic as well as private cars.
SOURCE: Available: http://directorsblog.blogs.census.gov/2012/06/27/and-nowfor-something-a-little-different/ [January 2014].
As a result, using business practice data requires innovative statistical techniques to standardize measures across time, industries, and location. In addition, key indicators must be maintained consistently over time to provide a benchmark.
RECOMMENDATION 4-5: The National Center for Science and Engineering Statistics should make greater use of business practice data to track research and development spending and innovation-related jobs at a more detailed geographic and occupational level than is possible with government survey data.
BOX 4-8
Examples of Web-Based Data on Innovation
Lists of Top Innovations
- http://www.fastcompany.com/1738506/the-10-most-innovative-companies-in-health-care
- http://www.rdmag.com/Awards/RD-100-Awards/2011/06/R-D-100-2011-Winners-Overview/
- Small Business Administration—http://www.sba.gov/content/sba-announces-winners-2011-tibbetts-awards
- Technology Review—http://www.technologyreview.com/tr50/
- http://my.clevelandclinic.org/media_relations/library/2011/2011-10-6-cleveland-clinic-unveils-top-10-medicalinnovations-for-2012.aspx
Innovation Data Reported by Companies
- New England BioLabs products—http://www.neb.com/nebecomm/newprod.asp
- GE products—http://www.ge.com/products_services/directory/by_product.html
- Corning—http://www.corning.com/displaytechnologies/en/index.aspx
Site That Collects Innovation Data
- ProductDb: http://productdb.org
Examples of Business Practice Data21
Understanding of innovation would be facilitated if NCSES regularly (annually or biannually) published a list of significant innovations brought to market. Such a list would be useful for assessing trends in innovation and how they relate to growth and jobs. Also helpful would be to have a list of major potential innovations under development, based on publicly reported data. Such lists have occasionally been manually constructed in the past (see Box 4-8). In 1982, for example, the Small Business Administration sponsored a project that entailed gathering information from 46 trade magazines and identifying and coding 8,074 innovations—4,476 in manufacturing industries. This information included
- model name, trade name, or trademark;
- name and description of the innovation;
____________________
21Nonsurvey methods for extracting data for the development of STI indicators are discussed in greater detail in Chapter 7.
- year of introduction;
- innovation type (product or process);
- innovation significance (new class, new type, significant improvement, updated model); and
- origin of technology and source of funding.
Today, more efficient techniques for creating lists of innovation are available, based on web scraping. One can also look at the propagation of technologies by examining the publication of product manuals. The panel considers these techniques in greater detail in Chapter 7.
In this chapter, the panel has offered five recommendations whose implementation would improve NCSES’s indicators program with respect to measuring innovation. These recommendations address four topics: (1) new and improved measures of innovation inputs and outcomes based on existing data, with clear implications for economic performance; (2) analysis, based on existing data, that is more comparable across countries than is currently the case; (3) improved data resources and accessibility; and (4) augmented survey questions that would ensure better reporting on innovation activities by firms. The panel believes NCSES should focus first on activities that use existing data while further developing capabilities for linking its data with those of other agencies and using frontier tools to produce STI indicators in a more timely fashion.


