
7
Test Protocols for Backface Deformation:
Statistical Considerations and Assessment
The original Army protocols for backface deformation (BFD) were based on binary (0-1) data. The BFD measurement at each location was compared against its specified threshold, and the outcome was scored as a “1” (failure) if it exceeded its threshold. This original plan was based on 20 shots; if no BFD measurements exceeded their limit, the demonstration was successful. In this sense, it was similar to Army’s legacy protocol for resistance to penetration (RTP). The Director, Operational Test and Evaluation (DOT&E) protocol expanded the number of shots to 240 and used the continuous measurements together with an assumption that the data are normally distributed. Specifically, the plan compared the 90 percent “upper tolerance limits” computed at 90 percent confidence level (90/90 rule) with their thresholds for the corresponding location on the helmet. As noted in Chapter 5, available BFD test data show that the probability of BFD exceeding its limits is quite small—on the order of 0.005. As this chapter observes, DOT&E’s BFD protocol has about a 90 percent chance of accepting the helmet design even if there is an order of magnitude increase in the exceedance probability (from 0.005 to 0.05). This weakens the incentive for manufacturers to produce helmets that are at least as good as current helmets with respect to BFD. In addition, the DOT&E protocols are based on an assumption of normality (a priori untestable) and the complex notion of an upper tolerance limit. Therefore, Recommendation 7-1 proposes that DOT&E’s protocol be changed. This change has the advantage that the new BFD protocol would exactly parallel the RTP protocol and would be easy for designers and manufacturers to understand and interpret. It is important that, after testing, the continuous BFD measurements be analyzed to assess the actual BFD levels and monitor them for changes over time.
This chapter evaluates the DOT&E’s first article testing (FAT) protocol for BFD. For the sake of comparison, the committee also considers the Army’s legacy test plan. As was the case for RTP (Chapter 6), the Army has modified the DOT&E protocol for application to the lightweight Advanced Combat Helmet, so the effect of that modification is also evaluated.
Recall from Chapter 4 that BFD is the maximum depth of the indentation in the clay headform resulting from a 9-mm-bullet impact on a mounted helmet. It is measured for each shot that does not penetrate the helmet. These BFD measurements are compared against corresponding thresholds (or limits) that depend on shot location: 25.4 mm for front and back and 16.0-mm for left, right, and crown. As discussed in Chapter 5, there appears to be no scientific basis for the choice of these thresholds. Without a scientific basis, the committee is limited to an assessment of whether the BFD distribution for a new helmet is at least as good as that of current helmets, in terms of the probability of exceeding the specified limits.
7.2 BACKFACE DEFORMATION FIRST ARTICLE ACCEPTANCE TESTING PROTOCOLS AND THEIR PROPERTIES
DOT&E Protocol
The DOT&E protocol is based on the suite of 240 shots discussed in Chapter 5. Data from the 240 shots are divided into two groups corresponding to shot location as follows:
1. 96 measurements from all the shots at front and back locations, combined across helmet sizes and environments; and
2. 144 measurements from all the shots at left, right, and crown locations, combined across helmet sizes and environments.
To accept the lot, the 90/90 UTLs calculated from the data for both groups must be less than their respective thresholds.
A 90/90 upper tolerance limit (UTL) is the upper 90 percent confidence bound on the 90th percentile of the underlying distribution. The statistical inference is that, with 90 percent confidence, 90 percent of the underlying BFD distribution is less than the UTL calculated from the data. The DOT&E protocol calculates the UTLs assuming the BFD measurements have a normal distribution (but different normal distributions for the two location groups).
For a normal distribution with mean µ and standard deviation σ, the upper 90th percentile is µ + 1.28σ. Because the parameters are unknown, one has to estimate them and also incorporate the variability in the estimates. It turns out that UTL, based on the data, has the form
UTL = Ῡ+ k S
Here, Ῡ is the sample mean, S is the sample standard deviation, and k is a constant that depends on the sample size n (number of shots), the confidence level, and the distribution percentile of interest. The last two are both set at 90 percent by DOT&E, hence the 90/90 rule. The k-factors are derived from a non-central t distribution. They have been tabulated and can also be obtained using commercial software.
For the 90/90 criterion, it is clear that the k-factor has to be larger than 1.28 to account for the uncertainty in estimating the parameters µ and σ from the data using Ῡ and S.
The 90/90 UTL is applied as follows in DOT&E’s BFD protocol. UTL is a 90 percent upper confidence bound for the 90th percentile, so one can say with 90 percent confidence that at least 90 percent of the distribution is smaller than the UTL (or at most 10 percent of the distribution exceeds the UTL). Therefore, the FAT is successful if the UTL is less than the specified BFD limit B* for each data group. The rationale is that if UTL < B*, with 90 percent confidence, B* exceeds more than 90 percent of the distribution, and there is less than 10 percent of the distribution exceeding B*.
The same theory underlying the determination of normal distribution tolerance limits can be used to calculate a 90 percent upper confidence limit on the probability of exceeding a specified threshold. This exceedance probability is analogous to the penetration probability for RTP testing. The acceptance criterion would then be that this confidence limit on the exceedance probability be less than 0.10. This criterion is equivalent to the UTL criterion, but more in line with the 90/90 criterion underlying the DOT&E protocols.
The acceptance criterion, that Ῡ + k S < B*, can be rewritten as
(B* – Ῡ)/S> k. Equation 7.1
The left-hand side of this inequality is the number of (sample) standard deviations, S, between B* and the average BFD,Ῡ. The conventional term for this quantity is the estimated “margin” relative to a one-sided specification limit. If the estimated margin is greater than a specified k, the acceptance criterion is met.
In the statistical and quality control literature, the test plans are developed by controlling the probability of exceeding a one-sided specification limit directly from a margin calculation, rather than backing into this criterion from a UTL. If the calculated margin exceeds a threshold, k, the demonstration is successful.
Finding 7-1. Statistical tolerance limits, which are the basis of the DOT&E analyses, are complex, and one has to keep track of multiple probabilities and inequalities. An equivalent, and more conventional and transparent, analysis is to base the acceptance test on the margin (the standardized difference between the threshold and the sample mean, as in Equation 7-1).
The margin plan parameters (k, n) are analogous to the (c, n) parameters for binomial data. For a given plan, operating characteristic (OC) curves can be calculated that plot the probability of acceptance versus the underlying probability of exceeding the limit, B*. By specifying two points on the OC curve, values of n and k can be derived that define a plan that satisfies those two requirements.
Operating Characteristics Curves of DOT&E Protocol
Figure 7-1 shows the OC curves for the two groups of shot locations: (1) red dashed line corresponds to back and front, and (2) black solid line corresponds to right, left, and crown.
At the right side of Figure 7-1, the green line shows that, if the underlying probability of a BFD “failure” is 0.10 for either location group, there is only a 10 percent chance of passing the test. This is the 90/90 criterion that was specified up front, and the plans have the intended property at this value. The manufacturer’s risk, and incentive, is read from the left end of the curves. For example, for the extreme left (red) line where P(BFD > B*) = 0.005, comparable to the proportion of available BFD data that exceed their thresholds, the probability of acceptance is close to one; that is, the manufacturer’s risk is close to zero. The blue lines show that, to have at least a 90 percent chance of passing the acceptance test, the manufacturer must have a BFD exceedance probability of about 0.05 for the back and front locations and about 0.055 for the other group. Putting it another way, even if the exceedance probability is as high as 5 percent or 5.5 percent, manufacturers still have a 90 percent chance of passing the FAT requirement for BFD.
The DOT&E protocol specifies that the plans for both groups of locations must pass their acceptance tests in order for the overall BFD protocol to be successful. Thus,
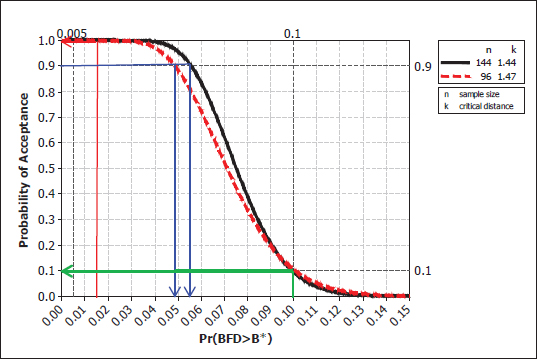
FIGURE 7-1 Operating characteristic curves for Director, Operational Test and Evaluation, backface deformation (BFD) protocol for the two groups of shot locations: red dashed line corresponds to back and front and black solid line corresponds to right, left, and crown. Green and red lines show the acceptance probabilities for the two groups when P(BFD > B*), the exceedance probabilities, are 0.10 and 0.005 respectively. Blue line shows the exceedance probabilities when the acceptance probability is fixed at 0.9.
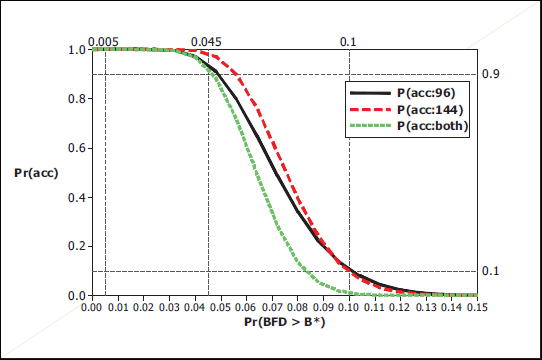
FIGURE 7-2 The two operating characteristic (OC) curves in Figure 7-1 overlaid with the overall OC curve of the backface deformation (BFD) protocol (assuming both BFD exceedance probabilities are the same).
if the underlying BFD failure probability was 0.10 for both subgroups of locations, the probability of passing both tests would be only 0.1 × 0.1 = 0.01, or 1 percent, as shown by the green curve in Figure 7-2. On the other hand, even when the underlying BFD failure probability is as high as 0.045, manufacturers have a 90 percent chance of passing both tests.
Finding 7-2. The use of two BFD tests, rather than a single test, has made the evaluation of the government’s risk and the manufacturer’s risk and incentive more complicated.
Comparison of DOT&E’s Current Protocols to the Legacy Protocol
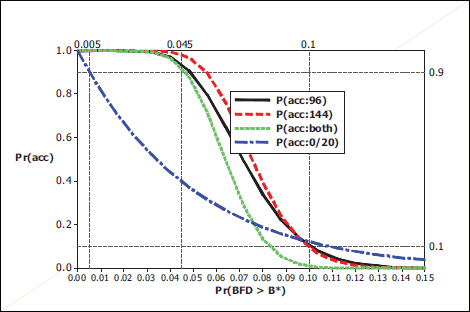
The legacy protocol was a (c = 0, n = 20) plan based on converting BFD failures to binary data. The OC curves of such plans were discussed in Chapter 5; in this case, P(BFD > B*) is the probability of a BFD failure. Figure 7-3 overlays the OC curve for that plan on the OC curves in Figure 7-2.
To have at least a 90 percent chance of passing the legacy plan, the underlying BFD failure probability had to be 0.005 or less. The DOT&E protocol relaxes that incentive by about an order of magnitude (even considering that the tolerance limit acceptance test has to be passed by both data subgroups). Thus, as was the case for RTP, the DOT&E protocol is “easier” to pass than the legacy protocol for values of true BFD failure probabilities less than 0.075 (where the legacy and the green curves cross).
For the BFD data provided to the committee (see Chapter 5), there were 8 BFD failures in a total of 816 tests. All of those failures were in one test series, which could indicate a systematic problem with that helmet or that test series. The combined data for the other three helmet tests yield an upper 90 percent confidence limit on the BFD failure probability of 0.004. This should be the region of interest for BFD protocol.
Finding 7-3. Figure 7-3 shows that the DOT&E protocol has a 90 percent chance of accepting helmets even when the BFD failure probabilities are an order of magnitude larger than what has been achieved by current helmets. This reduces the incentive for manufacturers of future helmets to sustain BFD failure probabilities at current levels.
Modified DOT&E Protocol for the Enhanced Combat Helmet
The Enhanced Combat Helmet (ECH) protocol is based on 48 helmets spanning four helmet sizes and four environments, with three helmets tested for each combination of helmet size and environment. There are 2 shots per helmet, totaling 96 shots. One shot is at one of the front/back locations; the other is at one of the left/crown/right locations. The same type of 90/90 UTLs are computed based on the assumption of normality; the k-factor for n = 48 and the 90/90 criterion is 1.57. The black curve in Figure 7-4 is the OC curve for the plan based on 48 shots. The red dashed curve is the OC curve for both tests passing. This curve shows that for a manufacturer to have a 90 percent chance of acceptance for both location groups, the helmets should have an underlying probability of exceeding the limit, B*, at just less than 0.03. As was the case with the previous protocol, this is a substantially higher BFD failure probability than what current helmets have achieved.
Finding 7-4. The DOT&E protocol for the ECH has a 90 percent chance of accepting helmets that have an order of magnitude larger BFD failure probability than those achieved by current helmets.
Army’s Modified DOT&E Protocol for the Lightweight Advanced Combat Helmet
This protocol changed the grouping of the shots in the subsection above as follows: (1) front only, (2) rear only, (3) crown only, and (4) right and left sides combined. Before combining right and left sides, a pre-test is done to test if the distributions (mean and variance) for the two sides are different; the data are combined only if there is not an indication of significant difference. This separation of the protocol into four or five subgroups is in line with the patterns of heterogeneity that were discussed in Chapter 5.
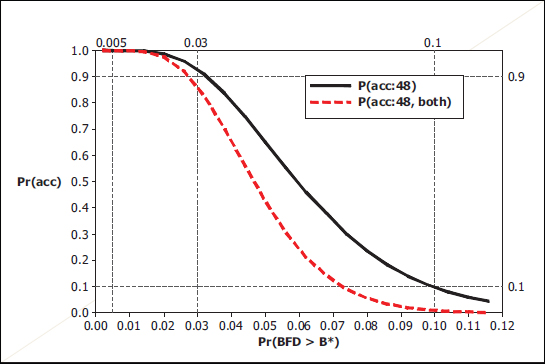
FIGURE 7-4 Operating characteristic curves for the two location groups for the Enhanced Combat Helmet. NOTE: BFD, backface deformation.
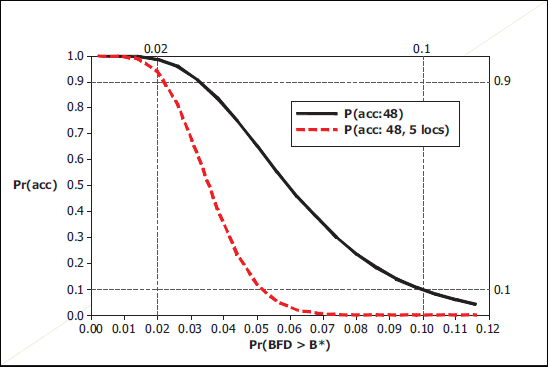
FIGURE 7-5 Operating characteristic curves for a single 48-shot plan and for five 48-shot plans. NOTE: BFD refers to backface deformation.
Under this protocol, the tolerance limit analysis is done on appropriate subsets of either 48 or 96 shots, depending on the location and whether the left and right distributions of BFD are consistent. Figure 7-5 shows the OC curves for the situation in which the protocol is applied to a single group of 48 shots, and the combined curve is for the situation of all five groups passing their individual margin tests.
Figure 7-5 shows that for a manufacturer to have a 90 percent chance of passing all five acceptance tests by location, the underlying BFD failure probability would have to be about 0.02. As was the case with RTP, the Army’s modification of the DOT&E protocol is considerably more stringent than the DOT&E protocol (Figure 7-2).
Backface Deformation Protocol Based on Binary Data
Although the BFD tests are part of DOT&E’s FAT protocols, the committee’s impression is that they do not receive the same level of public scrutiny as the RTP protocols. For example, they were not mentioned in the communications between Rep. Slaughter and the Department of Defense. There are many possible reasons, some of which are stated in the following finding.
Finding 7-5. The rationale behind BFD protocols for FAT is difficult to understand for the following reasons:
• The lack of a scientific connection between BFD and brain injury dilutes the usefulness of BFD measurements;
• The choice of BFD thresholds is not based on data or scientific studies, so the notion of exceeding the
threshold has no practical or scientific meaning, and their use is limited to comparing a new design of helmets with existing ones; and
• BFD measures the deformation on clay, which is only an indirect measure of the actual deformation on helmets.
There are also several statistical issues related to the DOT&E protocols. The data in Chapter 5 indicate an appreciable difference between the BFD distributions for front and rear shots. To address this, DOT&E has recommended preliminary analyses to decide whether the BFD data can be pooled across groups before conducting the test. These added analyses will add substantial complexity to both the decision process and the properties of the test protocol. They also make it the protocols less transparent. These points are summarized in the following finding.
Finding 7-6.
• The current DOT&E protocols for BFD data are based on upper tolerance limits, which are more difficult to understand than the protocols for RTP based on binary data.
• These protocols are based on the assumption that the BFD data follow a normal distribution. The computed values of the upper tolerance limits are sensitive to this assumption.
• The graphical diagnostics that were shown to the committee indicate that the normality assumption is not unreasonable for the limited data sets that have been analyzed. However, one should be cautious in assuming that future BFD test measurements will always be normally distributed.
• The methodology for computing UTLs requires that the BFD data across environments, helmet sizes, and across locations (within the two groups) are homogeneous; that is, they have a normal distribution with the same mean and variance. DOT&E has proposed: (1) conducting preliminary hypotheses tests to determine if this assumption of homogeneity holds, and (2) pooling the data only for cases where the pre-test suggests the homogeneity assumption is valid. Such an approach will add substantial complexity to the decision process and, more importantly, to the properties of the test protocol.
The replacement of the legacy protocol, based on binary data, with variable BFD data was presumably driven by efficiency considerations. If the normal distribution assumption is correct, the resulting protocol is much more efficient from a statistical perspective. When the test sample is small, as was the case with the legacy protocol of 20 shots, statistical efficiency is indeed an important consideration.
However, if the test sample size is large (as is the case with 240 shots), the concern about efficiency is less critical. In this case, it is preferable to use protocols that do not require strong parametric assumptions. An additional consideration is the need for simplicity and transparency. The use of two very different protocols for RTP and BFD data makes it difficult for DoD test designers to develop plans with the same goals and for users to understand their properties.
DOT&E’s legacy protocol was a simple and transparent plan that was based on binary data. Specifically, each BFD measurement is compared to its location-specific threshold, and the data are converted to 0-1 outcomes depending on whether the observation is below or above the threshold. A BFD measurement above the threshold leads to a “failure.” The probability of interest is then the exceedance probability.
Recommendation 7-1. The Director, Operational Test and Evaluation, should revert to the more transparent and robust analysis of backface deformation data based on pass/fail scoring of each measurement.
With such conversion, one can use the same types of protocols as those for RTP. For the BFD data the committee has seen, the probability of exceedance is around 0.005, about the same levels as the penetration probabilities estimated from the data. So, if the same considerations in Chapter 5 are used to develop the BFD plan, the two protocols are likely to be the same.
A natural concern in converting continuous measurements to binary data is the loss of statistical efficiency. However, recall that the goal of the test protocols is to determine if the BFD measurements exceed their corresponding thresholds. The FAT BFD data provided to the committee indicate that these thresholds are well in the upper tails of the BFD measurements (see Figures 5-2 and 5-4). The data show that P(BFD > B*) is less than 0.005. The probability of rejecting helmets (manufacturer’s risk) produced at this level of quality is essentially zero for the test, based on binary data (the same as that for protocols based on normal theory). In other words, the probability of acceptance is essentially 1 for both protocols. If P(BFD > B*) were to increase to 0.05 (an order of magnitude increase), the probability of rejection under a binary (17, 240) plan is about 0.10 (see Figure 6-5). This is very close to the combined normal-theory plan that is currently in use (see Figure 7-2).
The current DOT&E protocol is based on two different plans for the two different location subsets, because they have different thresholds and also differences in distributions within location subsets.
Recommendation 7-2. The binary data for the different location subgroups should be combined into a single backface deformation protocol.
Converting to a binary protocol and combining the data across the locations would mean that the exceedance probabilities may vary across locations. However, the numerical
study described in Chapter 5 indicates that the OC curves are robust to the level of deviations in exceedance probabilities that are present with current BFD data.
Post-Test Analyses
As noted, the loss in efficiency is not a major concern in converting the continuous BFD measurements to 0-1 outcomes. It is, however, important for DOT&E and the Services to do post-test analyses of the continuous BFD data, compute the margins, and monitor them to see if there is any trend or increase or decrease in BFD values over time. Such monitoring is an important part of any test process.
Recommendation 7-3. The Office of the Director, Operational Test and Evaluation, and the Services should analyze the continuous backface deformation measurements, compute the margins, and track them over time to assess any changes over time.
Recommendation 7-4. Available backface deformation (BFD) data should be used to develop data-based limits against which to compare future BFD data, as a replacement for the current legacy ad hoc limits.


