TABLE G-1 Sample Statistics of NRI Projects, 2008a
| Unit | Mean | Standard Deviation |
|
| PROJECT OUTPUTS | |||
| Refereed Journal Articles | Number published | 2.65 | 5.29 |
| Citations per Article | Number per article | 6.86 | 14.01 |
| PROJECT SCALE | |||
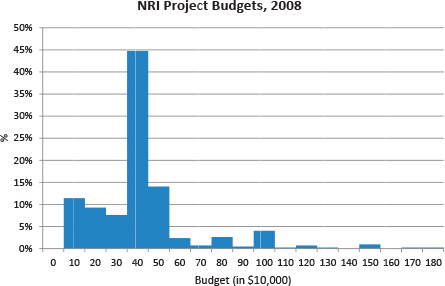
| Budget | $0,000 | 39.32 | 25.98 |
| Project Duration | Months | 31.61 | 9.45 |
| PROJECT SCOPE | |||
| Project Complexity | |||
| Number of Co-PIs | Number | 2.92 | 2.97 |
| Current Supportb | |||
| Federal Support | 0.73 | 0.44 | |
| Non-Federal Support | 0.52 | 0.50 | |
| No Other Support | 0.10 | ||
| Project Functions | |||
| Research | % | 93.53 | 20.95 |
| Extension | % | 4.29 | 12.88 |
| Education | % | 2.18 | 8.59 |
| Project Composition | |||
| Basic Research | % | 61.35 | 34.60 |
| Applied Research | % | 32.33 | 29.51 |
| Extension or Education | % | 6.32 | |
| PROJECT LOCUS | |||
| Subject Area | |||
| Plants | 0.314 | 0.465 | |
| Animals | 0.212 | 0.409 | |
| Food/Nutrition | 0.145 | 0.353 | |
| Social Sciences | 0.067 | 0.249 | |
| Bio-Products | 0.048 | 0.213 | |
| Ecosystems | 0.214 | 0.411 | |
| Type of Performing Institution | |||
| Federal | 0.045 | 0.208 | |
| Private Research | 0.029 | 0.167 | |
| Private University | 0.043 | 0.203 | |
| Public Non–Land-Grant Univ | 0.083 | 0.277 | |
| Land-Grant University | 0.800 | 0.400 | |
| Unit | Mean | Standard Deviation |
|
| Rank of Project Director | |||
| Professor | 0.48 | 0.50 | |
| Associate Professor | 0.19 | 0.39 | |
| Assistant Professor | 0.20 | 0.40 | |
| Federal Scientist or Other | 0.09 | 0.28 | |
| Pre- or Postdoctorate | 0.04 | 0.20 | |
| Award Type | |||
| Area | 0.33 | 0.47 | |
| Conference | 0.11 | 0.31 | |
| Standard | 0.56 | 0.50 | |
| OTHER FACTORS | |||
| Laboratory Assistance | |||
| Undergraduate | FTE months | 7.66 | 14.84 |
| Graduates | FTE months | 18.25 | 22.29 |
| Postdoctorates | FTE months | 13.10 | 17.34 |
| Project Vintage | Months since start date | ||
| Completed Project | 1 if completed, 0 other | ||
aIndicator (0/1) variables. Means shown are percentages of the sample falling into the respective category, expressed in decimal form.
bAFRI project directors may receive support from a variety of sources. The sum of the percentages of support sources therefore is greater than unity.
TABLE G-2 Sample Statistics of AFRI Projects, 2009–2010a
| Unit | Mean | Standard Deviation |
|
| PROJECT OUTPUTS | |||
| Refereed Journal Articles | Number published | 1.79 | 2.90 |
| Citations per Article | Number per article | 2.62 | 6.58 |
| Non-Refereed Communications | Number communicated | 1.74 | 3.25 |
| PROJECT SCALE | |||
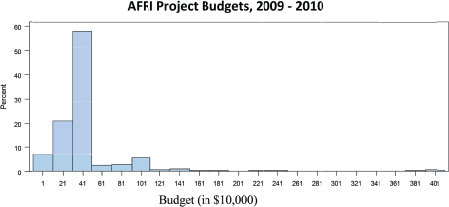
| Budget | $0,000 | 43.9 | 41.0 |
| Project Duration | Months | 41.7 | 9.7 |
| PROJECT SCOPE | |||
| Project Complexity | |||
| Number of Co-PIs | Number | 3.52 | 3.19 |
| Current Supportb | |||
| Federal Support | 0.66 | 0.47 | |
| Non-Federal Support | 0.51 | 0.50 | |
| No Other Support | 0.14 | 0.34 | |
| Project Function | |||
| Research | % | 89.22 | 24.79 |
| Extension | % | 5.48 | 16.16 |
| Education | % | 5.30 | 17.73 |
| Project Composition | |||
| Basic Research | % | 60.24 | 35.21 |
| Applied Research | % | 28.98 | 26.22 |
| Extension and Education | % | 10.81 | 22.29 |
| PROJECT LOCUS | |||
| Subject Area | |||
| Plants | 0.37 | 0.48 | |
| Animals | 0.21 | 0.40 | |
| Food/Nutrition | 0.15 | 0.36 | |
| Social Sciences | 0.05 | 0.22 | |
| Bio-Products | 0.04 | 0.20 | |
| Ecosystems | 0.18 | 0.39 | |
| Type of Performing Institution | |||
| Federal | 0.05 | 0.23 | |
| Private Research | 0.03 | 0.16 | |
| Private University | 0.05 | 0.21 | |
| Public Non–Land-Grant Univ | 0.10 | 0.29 | |
| Land-Grant University | 0.77 | 0.45 | |
| Unit | Mean | Standard Deviation |
|
| Rank of Project Director | |||
| Professor | 0.40 | 0.49 | |
| Associate Professor | 0.18 | 0.38 | |
| Assistant Professor | 0.29 | 0.46 | |
| Federal Scientist | 0.05 | 0.22 | |
| Postdoctorate or Other | 0.08 | ||
| Award Type | |||
| FASE | 0.29 | 0.45 | |
| CAP | 0.01 | 0.11 | |
| Conference | 0.07 | 0.28 | |
| Standard | 0.63 | 0.48 | |
| OTHER FACTORS | |||
| Laboratory Assistance | |||
| Undergraduate | FTE months | 10.5 | 52.9 |
| Graduate | FTE months | 25.0 | 33.8 |
| Postdoctorates | FTE months | 11.8 | 19.4 |
| 42.2 | 3.3 | ||
| Project Vintage | months since start date | ||
| 0.33 | 0.47 | ||
| Completed Project | 1 if completed, 0 other | ||
aIndicator (0/1) variables. Means shown are percentages of the sample falling into the respective category, expressed in decimal form.
bAFRI project directors may receive support from a variety of sources. The sum of the percentages of support sources therefore is greater than unity.
TABLE G-3 Sample Statistics of AFRI Projects, 2011–2012a
| Unit | Mean | Standard Deviation |
|
| PROJECT OUTPUTS | |||
| Refereed Journal Articles | Number published | 0.88 | 3.60 |
| Citations per Article | Number per article | 0.42 | 1.76 |
| Non-Refereed Communications | Number communicated | 0.73 | 2.16 |
| PROJECT SCALE | |||
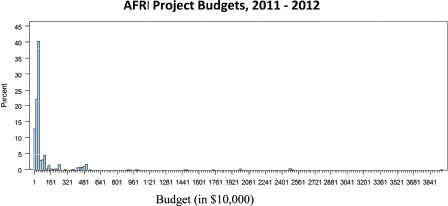
| Budget | $0,000 | 119.55 | 346.26 |
| Project Duration | Months | 37.79 | 13.39 |
| PROJECT SCOPE | |||
| Project Complexity | |||
| Number of Co-PIs | Number | 4.29 | 4.76 |
| Current Supportb | |||
| Federal Support | 0.70 | 0.46 | |
| Non-Federal Support | 0.45 | 0.50 | |
| No Other Support | 0.17 | 0.38 | |
| Project Functions | |||
| Research | % | 88.30 | 23.73 |
| Extension | % | 6.10 | 16.43 |
| Education | % | 5.70 | 15.88 |
| Project Composition | |||
| Basic Research | % | 54.85 | 36.84 |
| Applied Research | % | 33.46 | 35.85 |
| Extension or Education | % | 10.80 | 21.87 |
| PROJECT LOCUS | |||
| Subject Area | |||
| Plants | 0.12 | 0.33 | |
| Animals | 0.11 | 0.31 | |
| Food/Nutrition | 0.05 | 0.23 | |
| Social Sciences | 0.08 | 0.27 | |
| Bio-Products | 0.07 | 0.26 | |
| Ecosystems | 0.03 | 0.17 | |
| Type of Performing Institution | |||
| Federal | 0.04 | 0.18 | |
| Private Research | 0.02 | 0.14 | |
| Private University | 0.06 | 0.23 | |
| Public Non–Land-Grant Univ | 0.10 | 0.30 | |
| Land-Grant University | 0.78 | 0.41 | |
| Unit | Mean | Standard Deviation |
|
| Rank of Project Director | |||
| Professor | 0.32 | 0.47 | |
| Associate Professor | 0.18 | 0.39 | |
| Assistant Professor | 0.22 | 0.41 | |
| Federal Scientist | 0.02 | 0.16 | |
| Postdoctorate or Other | 0.26 | ||
| Award Type | |||
| FASE | 0.39 | 0.49 | |
| CAP | 0.03 | 0.17 | |
| Conference | 0.05 | 0.24 | |
| Standard | 0.53 | 0.50 | |
| Program Area | |||
| Challenge Grant | 0.33 | 0.47 | |
| Fellowship Grant | 0.21 | 0.41 | |
| Foundational Grant | 0.46 | 0.50 | |
| OTHER FACTORS | |||
| Laboratory Assistance | |||
| Undergraduate | FTE | 12.86 | 52.67 |
| Graduates | FTE | 33.99 | 71.40 |
| Postdoctorates | FTE | 19.43 | 43.98 |
| 20.12 | 7.47 | ||
| Project Vintage | Months since start date | ||
| 0.08 | 0.18 | ||
| Completed Project | 1 if completed, 0 other | ||
aIndicator (0/1) variables. Means shown are percentages of the sample falling into the respective category, expressed in decimal form.
bAFRI project directors may receive support from a variety of sources. The sum of the percentages of support sources therefore is greater than unity.
TABLE G-4 Budget Regression on Outputs and Inputs, AFRI 2009–2010 and 2011–2012
| Variable | 2009–2010 | 2011–2012 | ||||
| Linear | Interactive | Linear | Interactive | |||
| OUTPUTS | Intercept | 23.15 | 24.43 | –110.22 | –92.29 | |
| Number of Journal Articles | 1.44 | 1.14 | 8.54 | –1.91 | ||
| (3.24) | (1.90) | (4.08) | (–0.50) | |||
| INTERACTIONS | Number of Non–Refereed Articles | 16.71 | –9.39 | |||
| (4.86) | (–0.75) | |||||
| Number of Refereed Articles/Number of PIs | 0.06 | 0.54 | ||||
| (0.73) | (3.30) | |||||
| Number of Non–Refereed Articles/Duration | 0.58 | |||||
| (2.30) | ||||||
| SCALE | Project Duration (months) | 1.09 | 1.10 | 2.06 | 2.01 | |
| (8.28) | (8.31) | (3.50) | (3.34) | |||
| SCOPE | Number of Principal Investigators | 2.14 | 1.97 | 26.26 | 24.13 | |
| (4.50) | (3.69) | (12.52) | (11.22) | |||
| Basic Research Proportion of Project | –0.06 | –0.06 | –0.25 | –0.27 | ||
| (–1.24) | (–1.26) | (–1.20) | (–1.34) | |||
|
Award Type |
FASE (Base = Standard Grant) | –8.60 | –8.63 | |||
| (–3.11) | (–3.12) | |||||
| CAP (Base = Standard Grant) | 229.69 | 227.01 | 903.64 | 884.86 | ||
| (17.39) | (16.56) | (17.75) | (17.46) | |||
| LOCUS | Institution Type | |||||
|
Private University (Base = all other institutions) |
21.07 | 21.14 | ||||
| (3.61) | (3.62) | |||||
|
Public NLG University (Base = all other institutions) |
45.27 | 43.00 | ||||
| (1.91) | (1.83) | |||||
| Subject Area | Plants | 10.45 | 10.42 | |||
| (2.77) | (2.76) | |||||
| Animals | 14.59 | 14.39 | ||||
| (3.46) | (3.41) | |||||
| Food | 16.59 | 16.56 | ||||
| (3.99) | (3.98) | |||||
| Bio-Products | 8.83 | 8.71 | ||||
| (1.29) | (1.27) | |||||
| Social Science | 3.01 | 2.83 | ||||
| (0.49) | (0.46) | |||||
| Base = Ecosystems | Base = Ecosystems | Base = Ecosystems | Base = Ecosystems | |||
| OTHER | Project Vintage (months) | –1.00 | –1.02 | |||
| (–2.60) | (–2.64) | |||||
| Statistics | R2 | 0.630 | 0.630 | 0.700 | 0.706 | |
| N | 447 | 447 | 726 | 726 | ||
NOTES: Dependent variable is Project Budget. Conference and Planning Grants are not included in the dataset. If an input has a positive (negative) output-constant effect on budget, then it has a negative (positive) budget-constant effect on that output.