
The ultimate value of research, extension, and education activities is best assessed in terms of important outcomes such as technical improvements, productivity growth, material and social welfare, and individual and population health. Those outcomes are sensitive to program policy and design, including the mix of activities—fundamental or transformative1 research, applied or translational research,2 training, product development, and societal implementation of knowledge gained in service of desired outcomes. In particular, one can ask whether the U.S. Department of Agriculture (USDA) Agriculture and Food Research Initiative (AFRI)’s fundamental (knowledge or discovery) projects achieve the following outcomes:
• Support new research that would not otherwise have been done.
• Address an important problem.
• Involve leading scientists.
_______________
1A transformative approach to research and extension would “apply a systems perspective to agricultural research to identify and understand the significance of the linkages between farming components and how their interconnectedness and interactions with the environment make systems robust and resilient over time.” “Transformative changes include the development of new farming systems that represent a dramatic departure from the dominant systems of present-day American agriculture and capitalize on synergies and efficiencies associated with complex natural systems and broader social and economic forces using integrative approaches to research and extension at both the farm and landscape levels” (NRC, 2010, p. 2).
2Translational research, a term used in biomedical sciences, could also be applied to agriculture. There are two kinds of translation: the process of applying discoveries generated in the laboratory to the field, which leads to testing by producers, and the translation of research to enhance the adoption of best practices in the community.
• Serve as a catalyst for other research.
• Yield transformative insight.
Similarly, one could ask whether AFRI applied projects
• Direct financial support toward new products or activities that would not otherwise have been feasible.
• Address important problems.
• Involve key sectors of agriculture, food, or natural resources.
• Serve as a catalyst for other applied research.
• Yield a transformative product.
AFRI’s short history does not allow a comprehensive outcome assessment, because product development, changes in program activities, and the overall societal consequences of fundamental or applied-cum-translational research typically take more than 5 years and could take decades to materialize (Alston et al., 1995). Therefore, the assessment in this chapter is confined to the more immediate task of assessing AFRI’s effectiveness in terms of the relationships between AFRI program inputs (or costs) and such program outputs that can now be readily measured, including the number of publications produced, presentations delivered, and students and postdoctoral fellows trained. It is necessary, although not sufficient, to know those outputs if one is to assess the wider technical, economic, and social effects just listed. Such a study can be conducted only in the future when sufficient time has elapsed to permit observing and addressing the questions about outcomes listed above. Thus, early inferences related to AFRI’s value are useful not just in their own right but in identifying relationships that merit careful continuing scrutiny.
It is useful first to examine how project-level sample means of important outputs and policies have changed, beginning with the late USDA National Research Initiative (NRI) period and proceeding through AFRI 2012.3 This brief history of the National Institute of Food and Agriculture (NIFA) competitive grants program is divided into three phases:
_______________
3To conduct this exploratory analysis, we used a compilation of competitive grant-specific information for each of the years 2008–2012 supplied by USDA NIFA.
• The final year (2008) of the NRI program.
• AFRI’s first 2 years (2009–2010).
• AFRI’s second 2 years (2011–2012).
This last period (AFRI 2011–2012) marked the initiation of challenge-area grants, an important scaling-up of the Coordinated Agricultural Project (CAP) program, and corresponding changes in how project subject areas were categorized. It therefore merits attention separately from the period (AFRI 2009–2010) that characterized the transition from the NRI to the AFRI program.
Profiles of Average Projects
A complete profile of both means and standard deviations of all three phases can be found in Tables G-1 through G-3 in Appendix G. For the purposes of this discussion, we concentrate on selected variables that either have changed noticeably or are interesting because of their relative stability (Table 4-1).
A crucial development in 2011–2012 was the rise in average budget size—a near tripling from the $439,000 in 2009–2010 to $1,119,555 in 2011–2012. That dramatic increase was due to the increase in the number and size of CAP grants, especially those of $10 million or more. That rise led to a prominent positive skew in the distribution of award sizes, which distorted the mean’s significance. An examination of median award sizes, which are much less sensitive to skew, confirms that point. In NRI 2008, the median budget ($375,000) was nearly as high as the mean ($391,850). In AFRI 2009–2010, the median remained at $375,000 even as the mean rose to $439,395. In AFRI 2011–2012, the median rose by only 29% to $484,000, but the mean nearly tripled to $1,197,980.
The increase in budget size was accompanied by a lengthening mean project duration, from NRI’s 32 months to 42 months in AFRI 2009–2010 and 38 months in AFRI 2011–2012. There was also a steady rise from 2.9 to 4.3 in the mean number of principal investigators, reflecting an emphasis shift toward multi-institution, multidisciplinary projects. Turning to project composition, the mean percentage of a project that was basic research fell from 61.5% in NRI 2008 to 54.8% in AFRI 2011–2012; this was accompanied by rising extension or education components from 6.3% in NRI 2008 to 10.8% in AFRI 2011–2012.
Beyond project scale, there have been notable changes in project locus; “locus” being defined as the nature of the projects themselves, including subject area, type of performing institution, and rank of project director. The transition from NRI 2008 to AFRI 2009–2010 saw little change in the proportions of grants awarded by subject area (as defined by the foun-
TABLE 4-1 Profile of NRI (2008) and AFRI (2009–2012) Projects Showing Means of Selected Attributes
| 2008 (NRI) | 2009–2010 (AFRI) | 2011–2012 (AFRI) | |
| PROJECT SCALE | |||
|
Budget |
$393,000 | $439,000 | $1,196,000 |
|
Project duration (months) |
31.6 | 41.7 | 37.8 |
| PROJECT SCOPE | |||
|
Project complexity |
|||
|
Number of co-principal investigators |
2.9 | 3.5 | 4.3 |
|
Project composition |
|||
|
Basic research |
61.5% | 60.2% | 54.9% |
|
Applied research |
32.3% | 29.0% | 33.5% |
|
Extension or education |
6.3% | 10.8% | 10.8% |
| PROJECT LOCUS | |||
|
Subject area |
|||
|
Plants |
31% | 37% | 12% (26%)a |
|
Animals |
21% | 21% | 11% (24%) |
|
Food and nutrition |
15% | 15% | 5% (11%) |
|
Social sciences |
7% | 5% | 8% (17%) |
|
Bioproducts |
5% | 4% | 7% (15%) |
|
Ecosystems |
21% | 18% | 3% (7%) |
|
Type of performing institution |
|||
|
Federal |
5% | 5% | 4% |
|
Private research |
3% | 3% | 2% |
|
Private university |
4% | 5% | 6% |
|
Public non–land-grant university |
8% | 10% | 10% |
|
Land-grant university |
80% | 77% | 78% |
|
Rank of project director |
|||
|
Professor |
48% | 40% | 32% |
|
Associate professor |
19% | 18% | 18% |
|
Assistant professor |
20% | 29% | 22% |
|
Federal scientist or other |
9% | 5% | 2% |
|
Predoctorate or postdoctorate |
4% | 8% | 26% |
| OTHER FACTORS | |||
|
Laboratory assistance |
|||
|
Undergraduate full-time equivalent months |
7.7 | 10.5 | 12.9 |
|
Graduate full-time equivalent months |
18.3 | 25.0 | 34.0 |
|
Postdoctorate full-time equivalent months |
13.1 | 11.8 | 19.4 |
aNo attempt was made to map challenge-area program subject areas into those used by the foundational program. Hence, numbers in parentheses denote subject-area percentages in the foundational program only, which amounted to only 46% of projects funded in 2011–2012.
dational program). With the introduction of challenge-area grants, a new coding system was used in which predoctoral and postdoctoral fellowship and challenge-area subjects were distinguished from those in the foundational program. The challenge-area subject categories differed from those in the 2009–2010 foundation-grant coding system, and the committee did not attempt to map one into the other. Rather, two figures are shown in the 2011–2012 column of Table 4-1’s subject-area percentages. The unparenthesized figure is the number of grants in that area divided by the total number of AFRI grants, including challenge-area and fellowship awards. The parenthesized figure is divided instead by the number of foundational AFRI grants only. The former thus sum to a number (0.46) less than 1.00 and give an unclear indication of subject emphasis. The latter are more useful in that regard, although limited to foundation grants. They show a marked decline between 2009–2011 and 2011–2012 in the proportions of awards going to plant science, ecosystems, and food and nutrition, and large boosts to the proportions going to social sciences and bioproducts. For instance, plant science received 37% of AFRI awards in 2009–2010 and only 26% in 2011–2012. At the same time, awards for bioproducts rose from 4% to 15%, and for ecosystems dropped from 18% to 7%.
Proportions of awards granted by performing-institution type changed little in the transition from NRI to AFRI. The great majority of projects (77–88%) were awarded to land-grant universities; no other institution type received more than 10% in a given period.
The distribution of awards by principal-investigator (PI) rank reveals a gradual decline in the percentages going to AFRI-supported professors (from 48% in NRI 2008 to 32% in AFRI 2011–2012) and to federal scientists and others (from 9% in NRI 2008 to 2% in AFRI 2011–2012). At the same time, because of the initiation of the Food and Agricultural Science Enhancement (FASE) program, the proportion of awards going to predoctorates and postdoctorates rose dramatically from 4% in NRI 2008 to an average of 26% for AFRI 2011–2012. The average number of undergraduate, graduate, and postdoctoral laboratory assistants per project rose steadily during that same interval.4
Profiles of the Average Dollar
Several components of the award profile change substantially when the allocations of the average dollar rather than the average project are examined. For example, comparisons of dollar allocations—that is, expenditure shares—in the three NRI and AFRI periods are shown in Figure 4-1. The
_______________
4As will be noted in Chapter 5, AFRI awards to pre- and postdoctorates fell from 33% to 13% between 2010 and 2011, suggesting a return to the lower rates of the previous 3 years.
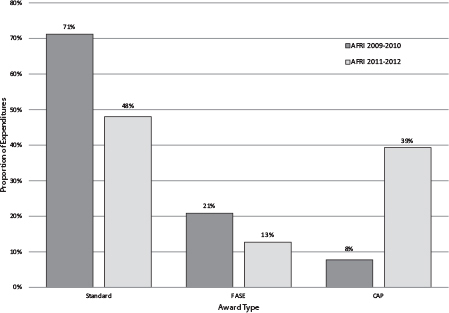
FIGURE 4-1 Share of program expenditures by award type.
expenditure percentages by award type shown in Figure 4-1 exclude NRI 2008 because there were no FASE grants under the NRI. Although the percentage of projects awarded as FASE grants rose from 29% to 39% between 2009–2010 and 2011–2012, Figure 4-1 shows that the proportion of AFRI expenditures going to FASE grants fell from 21% to 13%. Similarly, the proportion of expenditures going to standard grants fell from 71% to 48% even though the proportional number of awards fell only from 63% to 53%. The total funds awarded during the two periods rose by 14%, from $463.5 million in 2009–2010 to $530.5 million in 2011–2012 (see Table 3-1). Offsetting the decline in the amount of funding going to FASE and standard grants was a dramatic increase in the funds directed to CAP grants.
Although the share of projects awarded CAP grants rose only from 1% to 3% between AFRI 2009–2010 and AFRI 2011–2012, Figure 4-1 shows that the corresponding proportion of AFRI dollars going to CAP grants rose dramatically from 8% to 39% percent. The reason for the discrepancy is that the funds awarded to the average CAP grant were much larger than the average FASE or standard grant. In 2011–2012, for example, the mean CAP budget was $15,333,700 and supported nearly 20 co-investigators.
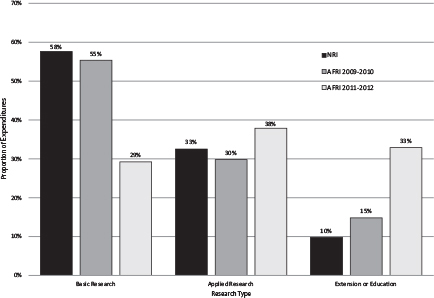
FIGURE 4-2 Share of program expenditures by type of research.
Figure 4-2 shows program expenditures by project composition or function. The proportion of AFRI money going to fundamental research changed little between the final NRI year and the first 2 years of the AFRI program (from 58% to 55%). It then plunged to 29% in AFRI’s second 2 years. The proportion going to applied research rose from 30% in 2009–2010 to 38% in 2011–2012. However, most of the decline in funding for fundamental research between AFRI’s first and second 2-year periods is explained by the rise from 15% to 33% in extension and education expenditures. The source of that abrupt change can also be attributed to the CAP grants, which tend to be far more extension- and education-oriented than other grants. Furthermore, even within the CAP grants, the proportion of money allocated to extension and education rose from 2009–2010 to 2011–2012. Some 33% of CAP resources awarded in 2009–2010 went to extension and education, whereas 47% of resources awarded in 2011–2012 went to these functions.5
_______________
5The CAP grants initiated in 2011–2012 were in the challenge-area programs. In contrast, the CAP grants initiated in 2009–2010 were awarded before the inauguration of the challenge-area programs.
CONSIDERATIONS FOR AN ANALYSIS
OF PROGRAM PRODUCTIVITY
The main purpose of this chapter is to provide a preliminary assessment of the input–output relationship of AFRI grants in which research output is measured in terms of communication products such as publications and presentations. The analysis consists of estimating how AFRI policies affect the input–output relationships. Because AFRI selects the projects that it funds, its investment and management policies are evident in the characteristics of the funded projects. The policies are to be distinguished from such project-management issues as the request-for-application process (discussed under “Program Management” in Chapter 5) although policies and project-management issues overlap to some extent.
The robustness of these and any other regression estimates is highest when data on the horizontal (explanatory-variable) axis and vertical (dependent-variable) axis are distributed evenly throughout the ranges of interest. Successive re-estimation of our regression model with a number of alternative explanatory variables suggests that model robustness was moderately good. That said, the estimated input–output relationships are best deemed illustrative given, among other things, the truncated nature of the data with which the committee had to work. Zero outputs tend to bunch the data around the vertical (budget) axis, detracting from the even-data-distribution ideal. For brevity and clarity, detailed descriptions of methods and statistical results in this chapter are kept to a minimum; the focus instead is on the committee’s principal findings. Additional tables and figures can be found in Appendix G.
Assessing Research Input-Output Relationships
The use of bibliometric indicators to assess quantitatively the relationship between research inputs and outputs has received some, albeit only modest, attention in a variety of disciplines and grants programs. Researchers have used various proxies as measures of knowledge output, including the number of papers that a scientist has published, the number of patents awarded, the number of citations to them in articles or other patents, and the status of the journal or patent that has granted a citation. Some of the early conceptual foundations of this approach are in Evenson and Kislev (1975), Jaffe (1986), Griliches (1990), and Adams (1990). The following represents only a sample of this literature.
Research outputs can be expressed either as an annual flow of information or as the accumulated stock of knowledge capital. One strand of the literature has used such flows or stocks to explain individual or institutional performance. The Evenson–Kislev and Adams studies, for example, dem-
onstrate how changes in agricultural scientists’ knowledge boost farm productivity performance. Zucker et al. (1998) show that biotechnology firms are drawn into areas geographically near “star” scientists—measured by the scientists’ success in attracting literature citations. Buccola et al. (2009) and Nag et al. (2012) document how publication success attracts public and private research funds into a university biology laboratory.
Most of the bibliometric literature has focused on the knowledge-production function, namely, the determinants of knowledge output itself. In one of the earlier such studies, Pardey (1989) examined the effects of state agricultural research expenditures on agriculturally relevant scientific knowledge, using as a proxy the quality-adjusted publication output of a scientist sample. These expenditures have few short-run but substantial long-run knowledge benefits (Pardey, 1989).
In the same knowledge-production framework, Levin and Stephan (1991) showed evidence that academic scientists publish less as they age, presumably because as one ages a publication has progressively smaller implications for one’s future career. Foltz et al. (2003) examined how an academic scientist’s patent awards are influenced by university type, the presence on campus of a technology-transfer office, and dynamic factors. Carayol and Matt (2004) regressed publication and patent outputs on such laboratory inputs as technical assistants and on the principal investigator’s characteristics. Azoulay et al. (2007) provided evidence that patent output is influenced by the “scientific opportunities” in a patent’s field as much as by the scientist’s skill or funding. Gulbrandsen and Smeby (2005) documented the role of industry funding in driving research toward more collaborative and translational research and toward higher publication rates; their results are consistent with the finding by Xia and Buccola (2005) that industry funding lifts patent-cited publication rates. Turner and Mairesse (2003) examined similar questions among French physicists.
Campbell et al. (2010) used bibliometrics to study competitive grant peer-review effectiveness and the ties between funding and scholarly performance. Fortin and Currie (2013) examined the relative impact, in terms of publication and citation rates, of funding a few large projects or a larger number of small projects. Cummings and Kiesler (2005) found multidisciplinary projects to be as productive as single-discipline projects, but multi-institution projects to be less productive than single-institution projects. Trochim et al. (2008) proposed concept and logic mapping with bibliometric and expenditure analysis to examine the productivity of large, federally funded scientific research initiatives.
In general, research output (however measured) can be considered relative to either the average dollar expended or the additional (“marginal”) dollar invested. The average rate of knowledge production attributed to AFRI expenditures is the total amount of research output per dollar of (i.e.,
in proportion to) project budget expenditures (input). This is one measure of the productivity of AFRI investments. Alternatively, the marginal rate of knowledge production is the amount of additional output created by an additional expenditure dollar or additional unit of such project feature as duration. The principal focus in this chapter is on marginal response, although as will be seen, per-unit outputs are also a useful way of assessing research productivity.
An important category of policy questions concerns project scale—specifically, what is the implication of project size on research productivity? Budget is one dimension of project scale. Another is the number of months that principal investigators will be given to reach their objectives with the budget provided. And time itself is a resource: more of it provides greater opportunity to generate laboratory or field data and to adapt to unexpected study outcomes. But continuing support for too long may invite a scientist’s other, newer projects and interests to interfere with AFRI-funded research.
Research productivity issues also arise regarding project locus: that is, the nature of the project attempted and the types of principal investigators and institutions that attempt it. Locus attributes include project subject area, scientific discipline, project composition or function (research, extension, or education), performing-institution type, and rank of the principal investigator. Programs such as microbial genomics or food safety, for example, may differ in the opportunities available for high-profile innovation. Decisions about how AFRI money will be allocated among subject areas and which categories of researchers and institutions will be chosen to conduct analyses therefore might affect AFRI’s average return rates.
Conceptually distinct from a locus attribute, although often difficult to distinguish in practice, is project breadth or scope. One scope attribute is the variety of functions—research, extension, and education—to be combined in a single project. Single-function projects do little to coordinate research with extension effort. But they save on coordination cost by leaving the coordination function to the literature, to professional conferences, or other means. The scope of a project also has implications for the number and variety of institutions, disciplines, and principal investigators involved in a given study and in the variety of funding agencies other than AFRI that are supporting each investigator. Expanding a project’s scope in the functional or institutional dimension likely affects the research input-output relationship, and thus, potentially, the productivity of AFRI-funded research. AFRI has, or should be able to obtain, all the information needed to evaluate each of the above factors empirically. The approach to the preliminary analysis described in this chapter is to use project-level data to specify and estimate AFRI budget functions. The results show the budgets granted at given output rates and project characteristics or, equivalently, the outputs generated by given project scale, locus, and scope attributes.
Research Output Metrics and Project Attributes
Variables used in the analysis, and their sample means and standard deviations, are shown in Tables G-1 to G-3 in Appendix G.
Research Output Metrics
Project-level metrics of research output used here are
(a) The number of refereed journal articles published by the participants in a specified AFRI project through July 2013, as indicated in the articles’ acknowledgment footnotes.
(b) The per-article number of literature citations received by those articles up to July 2013.
(c) The number of nonrefereed communications—such as conference presentations, proceedings, posters, abstracts, theses, and working papers—that are produced up to the time of project termination and that the principal investigators attributed to the project.
Journal-article metrics (a) and (b) were not provided by NIFA but instead were drawn from Google Scholar queries. Metrics (a) and (c) can be regarded as indicators of the amount of research output, whereas metric (b) is in a sense a measure of the quality or communication intensity of the research. The early stages of many projects complicate the regression modeling of citation rates, and they are excluded from the budget-function analysis. However, the citation rates were examined graphically.
Project Scale
The first and primary scale factor is the total funds provided per project. The questions to be addressed are how much output—that is, how many refereed and nonrefereed articles and presentations—AFRI produces per dollar invested and how many additional articles are published when progressively larger project budgets are provided. The latter is estimated as the slope of the relationship between the project budget and the number of scholarly publications attributed to that project. Project duration (years between project start date and end date) is an additional scale factor that needs to be included with budget size. If the coefficient of the duration variable is negative after controlling for the overall size of the project budget, project duration is deemed excessive in that reducing the length of the project would have increased the number of articles without additional cost. Likewise, project duration would be deemed too short if the coefficient is positive.
Project Locus
Project locus variables are ones that influence the nature of the funded research and those who conduct it. They include
• Research subject area.
• Type of performing institution.
• Project director’s rank.
• Type of award.
When project scale and scope (see below) are controlled for, locus factors likely have their own bearing on expected research output. Refereed journal articles are generated or cited more abundantly in some agricultural research fields than they are in others, and AFRI researchers may intrinsically appear more productive (when research output is denominated in terms of the number of publications) in some fields than in others.
In terms of generating published (or more cited) outputs, some types of institutions, and project directors at some ranks, may be more successful than others. Challenge-area grants are relatively topical, suggesting that citations to their scientific articles might come more quickly but fall off more rapidly than those from more fundamental projects. The relative success of FASE and standard-grant projects in a given scale, scope, and subject-area category is difficult to assess in the absence of empirical analysis. Because CAP-grant indicators are listed in the NIFA data alongside the FASE-grant and standard-grant indicators, they were included in the set of project attributes considered in this chapter’s analysis.
Project Scope
NIFA has spent considerable time in thinking about the appropriate scope or variety of performing institutions, principal investigators, and research discovery and communication functions to include in a single project. One of its principal moves on replacing the NRI with AFRI was to put greater emphasis on projects with broader scope. The new orientation is expressed partly in the CAP grants, in which the breadth of project activities is particularly large. But many interinstitutional and interfunctional activities are also present in standard projects as well as in CAP projects.
To indicate a project’s scope, the following parameters were specified:
• The number of co-PIs cooperating in the project and hence, presumably, the variety of the human capital brought to bear on the research problem.
• The presence of current non-AFRI support for the PIs and thus interagency cooperation in funding a PI’s overall work.
• The proportions of research, extension, and education involved in the project—the more even the proportions, the broader the functional scope.
• The proportional mix of basic versus applied work in research projects.
• Whether the project is supported by a CAP grant.
These specific parameters each reflect a different scope dimension although they are partly redundant in that, for example, the average CAP grant involves more co-PIs, functions, and performing agencies than does the average standard grant.
To evaluate the association between project scope and productivity, the committee assessed how peer-reviewed and non–peer-reviewed communications were affected when project scope was expanded, while budget size was held fixed. In addition, the committee examined how project scope affects the consequences of budget’s size on the measured publication performance of a project. This was achieved by estimating regression interaction terms between the relevant scope and output variables. In any event, although greater scope normally involves greater cost and thus greater project scale, scope and scale may have qualitatively distinct effects on expected scholarly communications. The distinction between a locus effect and a scope effect on scholarly publications is partly ambiguous, as mentioned above.
NIFA provided the committee with most of the data needed to construct the project scale, locus, and scope variables in related spreadsheets. National Research Council staff collated the data into a master file suitable for regression analyses. Gaps and inconsistencies in the data provided by NIFA are discussed in Appendix H. NIFA keeps track of publications only up to project termination, which is well before many of the articles associated with AFRI funding have yet to appear. NIFA also did not provide data on the citation performance of these articles. Oregon State University staff6 downloaded from Google Scholar each project’s refereed journal-article and citation count, which Google Scholar has identified by way of (and only to the extent of) the project and funding-agency acknowledgments on the front page of each article. The downloads included AFRI’s nonrefereed papers and presentations as filtered from the Current Research Information System (CRIS) reports provided by NIFA. These data were not available for 2008 NRI projects. A detailed description of data processing for the analysis performed in this chapter is included in Appendix H.
_______________
6The committee thanks Yunguang Chen for his assistance in obtaining the data on journal-article and citation counts from Google Scholar.
PRODUCTIVITY ASSESSMENT OF PROJECT DATA
The analyses here take the form of regressing project budgets—as the dependent variable—on the projects’ refereed and nonrefereed journal-article outputs and on such project characteristics as duration, number of PIs, award type, performing-institution type, research–extension mix, subject area, and project vintage. Budget functions of this type describe relationships between selected characteristics and funding levels at given expected refereed-publication or nonrefereed-publication rates. Solving for the article-publication rate yields the effect of the indicated characteristic or budget on article output.
The fact that inadequate time has passed for all likely publications to appear implies a downward bias in expected article-output rate. The regression’s focus on marginal effects—that is, on the output changes induced by input changes—ameliorates that difficulty substantially because such changes are only weakly related to output and input levels. Improved confidence in the committee’s provisional inferences will require continued collection of AFRI outputs, including projects that have been terminated.
With those considerations in mind, the committee first assessed AFRI 2009–2010 before the introduction of challenge-area grants and the substantial expansion of project sizes and scope in early 2011. The committee then examined the challenge-area grants, which were introduced in the 2011–2012 period and it was also when mean project sizes expanded.
Productivity Analysis, Agriculture and Food Research Initiative 2009–2010
Every AFRI project output and input (characteristic or policy) variable was initially regressed against 2009–2010 project budgets and separately against 2011–2012 budgets. In each analysis, most of the statistically nonsignificant factors were progressively removed and the relationships iteratively reestimated until mostly significant factors remained. Final results for both 2009–2010 and 2011–2012 are given in Table G-4 in Appendix G.
Analytical Results: Policy Factors
Nonrefereed forms of research output (including conference presentations) were always highly nonsignificant in the 2009–2010 fits and removed from the specification. The implication is not that nonrefereed communications were meager or that grant support was irrelevant to their production but that, once laboratory and field setup costs were met, additional budget did not lead to greater output when all other factors were constant.
The rank of the project director also was nonsignificant despite that the rank with the lowest mean output (pre- or postdoctoral project director)
was used as the base group, maximizing the opportunities that the ranks included would have statistically significant output effects. When other factors were controlled for, that is, directors at all ranks were on average equally successful in producing scholarly communications.
Support to the project director from other federal or nonfederal sources consistently had no effect on scholarly communications after budgets were accounted for. That does not imply that the presence of other support was unimportant in AFRI recipients’ scholarly productivity. Rather, it suggests that in selecting and funding projects and implicitly the PIs involved in them, AFRI has successfully taken account of the non-AFRI contributions to its awardees’ productivity. With one exception, performing-institution type had no output-constant budget implication either. Projects performed at public non–land-grant, federal, and private research entities were no more or less productive than those at land-grant universities. The exception is that those at private universities required greater budgets on average than did land-grant universities to produce a given number of scholarly communications. For example, private universities (such as the Massachusetts Institute of Technology, Yale University, New York University, and Northwestern University) required $210,700 more than land-grant institutions to produce the same overall publication rate.
The distribution of a project’s functions among fundamental research, applied research, extension, and education—a potentially important element of project scope—had only a weak effect on the number of communications. The negative budget effect of boosting a project’s fundamental-research component weakly suggests that the greater a study’s fundamental content, the less expensive it is to produce another communication.
Other policy factors generally had robust influences on output-constant program budgets. It is especially important to see that greater journal-article output is statistically associated with a larger budget when PI numbers, project duration, and other project characteristics are held constant. However, FASE awardees required $86,000 less to generate a given journal-publication rate than did standard awardees. CAP grants, in contrast, expended $2,296,900 more than standard grants for a similar scholarly communication rate.
Project scale and scope policies merit close attention because they are relatively easily adjusted but have important efficiency implications. In terms of scale, project duration had a highly significantly positive effect in the 2009–2010 linear regression. Other inputs constant, this indicated AFRI was paying for additional project time for which it received no additional output. Holding budget constant, an additional project month reduced the number of journal articles produced per project. On the scope side, the analysis similarly suggested that when budget and other controlled factors were held at sample means, an additional PI in a project reduced journal-article output.
These estimated output effects of another $10,000 of budget, another PI, and another month of project duration—respectively controlling for the remaining two—are summarized in Table 4-2. Each entry shows the effect of one more unit of the variable in the left-hand column on the variable in the top row. For example, the first column of the matrix shows the respective influence of $10,000 of additional budget, one more PI, and one more project month on refereed journal-article output. In cell (i), for instance, the –1.49 is the above-mentioned mean article-production loss incurred when one more PI is added to the project while budget, project duration, and all other modeled factors are held constant.
Sources of Scale and Scope Inefficiency
The 0.47 in cell (iii) of Table 4-2 indicates that when holding article output and project duration fixed, adding $10,000 more to the budget required nearly one-half an additional PI and vice versa. Such a mutual rise in budget and PI numbers might be reasonable if it boosts output. However, output is held constant in this table row. Consequently, as the number of PIs rises, the average PI becomes increasingly inefficient in the use of non-PI budget inputs to produce journal articles. Thus also, reducing PI numbers allows some non-PI inputs to be saved. Once they are fully saved, budget and PI numbers would begin to trade off with one another, so the marginal effect of each on the other in cell (iii) would be negative rather than positive. Boosting the number of PIs would allow a given number of journal communications to be produced with fewer non-PI expenses. The fact that they do not trade off suggests these efficiency opportunities remained unexploited and hence that resource allocation in AFRI 2009–2010 projects was not maximally productive in terms of our output criterion.
This observed complementary relationship, at constant output, between budget and PI numbers in Table 4-2 is bound to have a negative influence on either budget’s or PI number’s effect on journal-article output because the ratio of these two effects is what constitutes the relationship between output-constant budget and PI numbers. In AFRI 2009–2010, the budget’s marginal impact on journal publishing was positive (0.69) and PI’s marginal effect was negative (–1.49). More importantly, AFRI’s inability to exploit the complementarities between variable and fixed research resources guaranteed that one of the two factors would have a desirably positive output influence and the other an undesirably negative one.
The possibility that boosting a project input could negatively affect output is best understood by distinguishing between the portion of the input devoted to setting the project up and the portion used to exploit the setup to produce outputs. Projects that mainly extend an earlier study, for instance, presumably have lower setup costs than do projects that begin a
TABLE 4-2 Research Marginal Productivity: Pairwise Effects of Selected Factors, AFRI, 2009–2010
| (1) Number of Refereed Articles | (2) Number of PIs | (3) Project Budget | (4) Project Duration | |
| (1) Number of refereed articles | ||||
| (2) Number of principal investigators | (i)–1.49 | |||
| (3) $10,000 of project budget | (ii) 0.69 | (iii) 0.47 | ||
| (4) One month of project duration | (iv)–0.76 | (v)–0.51 | (vi) 1.09 | |
NOTE: The number in a given cell is the effect on the variable above of applying one more unit of the variable on the left. Roman numerals in parentheses are cell numbers.
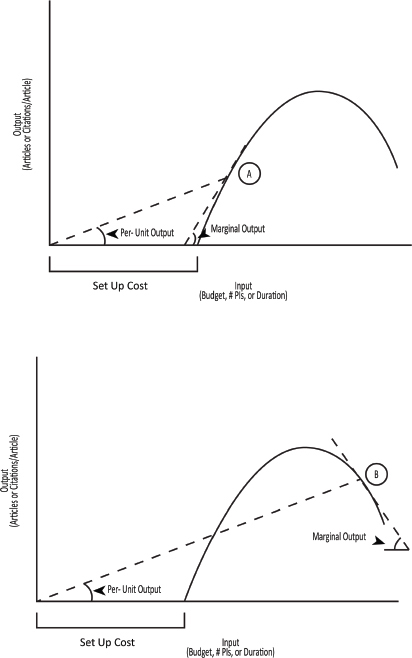
new line of research. Figure 4-3 depicts a stylized relationship between a research project’s setup cost and its marginal (directly output-producing) cost. The same technology is depicted in the bottom as in the top diagram. Until enough resources (budget, PIs, and project duration) have been devoted to set up experiments or field trials, no outputs can appear. Outputs may then arise if additional resources are applied. But the additional output created by an additional input unit typically declines as the input volume grows because increasing demands are being placed on the project’s remaining (fixed) inputs such as PI time and institutional infrastructure. At the peak of the curve, the variable inputs crowd in on the fixed inputs to such extent that output begins to fall as additional variable input units, such as undergraduate students, are brought in. Budget allocations in that region of declining output are wasteful. Increased awareness of these relationships can help identify signs of inefficient study-resource use.
Points A and B in Figure 4-3 show two alternative operating points on such a science production function. Per-unit output is the slope of the line drawn from the origin to AFRI’s operating point—A in the top diagram and B in the bottom diagram. In both cases, regardless of how much input is used, per-unit output is positive. Marginal output is the slope of the tangent to the production function at the operating point. That slope is highly sensitive to input level. Because in the top diagram the input is used moderately, marginal output is positive.7 In the bottom diagram, so much input is used that marginal output is negative: an additional input unit reduces output.
Principal-Investigator (Scope) Effects
No manager seeking to maximize output with given resources, or to minimize resources needed for a desired output, would accept less output in the face of additional input. Yet early evidence suggests that PI deployments in the average AFRI 2009–2010 projects seem to have been in such a situation. The rationale for adding PIs presumably was to broaden the scope of resources available to solve the problems addressed (e.g., in the variety of disciplines, subject matter, and laboratory and field information). But that added variety may exacerbate communication and coordination costs and use cash that could have been used more productively.
These additional coordination costs could be justified on several bases. One justification is that novel ideas and solutions emerge from collaborative research among disciplines and institutions. Truly interdisciplinary research of that nature requires understanding one another’s disciplinary language and challenges (NRC, 2004). The fact that, at sample means in 2009–2010, additional PI numbers had a negative journal-article effect suggests
_______________
7Because of the presence of setup cost and the production function’s concave shape, marginal output typically is greater than per-unit output.
that coordination costs outweighed diversity and specialization benefits. Cummings and Kiesler (2007) showed similar findings in their study of the National Science Foundation’s Information Technology Research program. If in the longer term, however, especially large projects can be shown to produce more innovative or longer-lasting effects than possible without disciplinary integration, the shorter-term inefficiencies would be justified.
When PI numbers and institutional overhead are held constant, an additional budget dollar is an additional liquid resource. The natural inclination would thus be to allocate that extra dollar to communication among PIs, students, and interest groups. In other words, the extra dollar would encourage and be associated with a more integrated project. To the degree that it is, communication costs in the larger projects substitute for, rather than produce, journal articles, presumably because the PIs’ lost scientific productivity and article-writing time are inadequately compensated by the publication benefit of the intraproject communication. On the basis of this committee’s analysis of bibliometric outputs, and with only a few years to observe it, the productivity of the average AFRI project was considerably lower than might have been expected given the size of the budget and number of PIs.
Project-Duration (Scale) Effects
Finally, consider the efficiency with which study time is assigned to AFRI projects (last row of Table 4-2). As with the relationship between budget and PI numbers, a test of study-time efficiency is to ask whether the project’s budget and duration trade off with one another in producing a given output. Cell (vi) of Table 4-2 shows, at least with the early bibliometric output data, that they do not trade off. If refereed-article output is held constant, another month of project time requires $10,900 of additional budget. Thus, in the period examined, scholarly communication rate was maintained even when both duration and budget were reduced. In the presence of a budget’s positive effect (cell ii) on article output, this unexploited complementarity implies that the longer the project, the lower its journal output (cell iv).8 Although the average project month brings positive output, adding one more month reduces it. The average project, that is, was allowed too many months given the budget and other resources supplied. The virtues of additional operating time were overwhelmed by the operational entropy that additional time encouraged.
_______________
8Full differentiation implies that when the marginal rate of technical substitution between two inputs is positive, and one of the two has positive marginal effect on output, the other must have negative marginal effect on output. Thus, for example, given in Table 4-2 that the marginal effect in cell (vi) is positive, the marginal effect in cell (ii) or cell (iv) must be negative and the other positive.
During the 2009–2010 period, when challenge-area grants had not yet been established, AFRI projects appear to have been too lengthy (a scale problem) and involved too many PIs (a scope problem) to make efficient use of AFRI resources. Budgets and PI numbers, like budgets and project durations, were jointly too high for the number of communications generated. The situation was not merely a scale diseconomy, namely, in which additional input volume reduces output per unit of input. Total output actually declined as input volumes were expanded. At the margin, in other words, another PI and project month were acting as negative inputs. Substantial reductions in both scale and scope thus would have boosted efficiency at least over the short term and possibly the medium and long term. A more general discussion of the conceptual pros and cons of the decentralized vs centralized form of scientific inquiry is outside the scope of the committee’s review.
Productivity Analysis, Agriculture and Food Research Initiative 2011–2012
As in the AFRI 2009–2010 analysis, every variable except laboratory assistance was initially included in the 2011–2012 regressions. Project-director rank and institution type were largely nonsignificant, implying as before that the AFRI proposal selection and funding process was successful in equating eventual productivity rates across investigator ranks and institution types.
Policy Factors
As in the 2009–2010 analysis, the committee did not detect a significant relationship between current support from other federal or nonfederal entities on the one hand and the number of scholarly communications (output-constant cost or cost-constant output) on the other. Discernible publication-rate differences were not found either—controlling for the remaining factors—between the fellowship, challenge-area, or FASE programs and the standard-grant base group. Nor were they found between project subject areas, relative either to the ecosystem base group or—judging from coefficient:standard error ratios—to one another. The nonsignificances of these publication rate differences might be explained by the especially early stage at which the 2011–2012 projects were being examined. Less than 55 months had elapsed since the inception of many of them, and 80% of projects were incomplete at the time of the analysis. In any event, all these support-source, grant-type, and subject-area factors were eliminated from the analysis and the 2011–2012 regressions refitted.
A key finding of the 2011–2012 study was that, despite the recentness of these projects and hence the low per-dollar output rates to date, refereed
and nonrefereed paper output were each associated highly positively with the budget provided. Refereed journal-article’s t-statistic was indeed greater in the 2011–2012 assessment than in the 2009–2010 one. When project scope, scale, and other included program factors are controlled for, more published output requires more funding, and more funding generates more output. In particular, raising a project budget by 1% raises article output by 15.9%, similar to the return rate in 2009–2010. A program’s early stages, therefore, do not appear to be too early to begin an analysis of program effectiveness, despite that results are only anticipatory.
Controlling even for other scale and scope measures like PI numbers and project duration, CAP grants appear to have been more output-inefficient in 2011–2012 than they were in 2009–2010. In particular, CAP projects in 2011–2012 required close to $9 million more than standard grants did to generate the same early scholarly output rates. This great discrepancy in project output might be explained partly by the long delay in a large project between project setup and publication appearance. That delay would be especially noticeable when, as here, analysis is conducted only 1.5–2.5 years after project inception. However, it is probably explained also by the great rise in the number and size of CAP projects in 2011–2012, which by further skewing the AFRI project-size distribution (see Figures G-1 through G-3 in Appendix G for project-size distribution graphs) may also have exacerbated the difficulty of distinguishing between the CAP effect itself and the more general scale and scope effects.
Public non–land-grant universities received about $450,000 more than other institution types did in 2011–2012 to generate the same output rate—indicative of an inefficiency twice as large as private universities had in 2009–2010. Furthermore, the greater a project’s basic-research component, the less costly at given communication rate it continued to be in 2011–2012. Boosting a project’s basic research share by 10 percentage points reduced output-constant budget by about $2,500, although the probability of a nonzero effect was only around 80%.
As in 2009–2010, the most prominent scale and scope effects on publication-rate-constant budget were positive and statistically highly significant. In the scale dimension, project durations remained excessive. Cutting one month of project time would have saved an average of about $20,600 in budget with no loss in output rate. In the scope dimension, the mean number of PIs in a project continues to be inefficient: adding one more PI would have inflated by $262,600 the budget needed to achieve a given refereed-publication rate. In other words, if budget is held constant, adding one PI reduces the refereed-publication rate. In fact, the marginal efficiency of PI deployment in AFRI projects fell in 2011–2012 by nearly half compared with 2009–2010.
Scale and Scope Effects
Table 4-3 provides insight into the sources of scale and scope effects on publication rates. Cell (i) shows that producing more nonrefereed papers comes at the price of fewer refereed ones when budget, PI numbers, and project duration are held constant. That is, any initial complementarities between these two types of communication have been successfully exploited. However, AFRI does not trade off budget size for PI numbers at a given output rate. The positive sign in cell (vi) shows that both could have been reduced while maintaining constant publication success. A consequence is that even when PI numbers are held constant, another $10,000 brings higher refereed-article and nonrefereed-article production, and another PI at constant budget reduces both these outputs [see cells (ii), (iii), (iv), and (v)]. Similarly in the scale domain, there is not a tradeoff between budget and project duration [cell (x)]. Instead, budget and project time can simultaneously be sacrificed even if output rate is held constant. Given that greater budget boosts output, adding a no-cost month to the average project would have reduced output.
In summary, budget, PI numbers, and project duration were jointly too great in 2011–2012 to most efficiently produce early scholarly outputs. This relationship appears to hold despite that, as in 2009–2010, budgets on their own were correlated strongly with early publication rates. In other words, excessive project scope rather than scale appears to have been the principal inefficiency factor, even though scope expansion inevitably requires scale expansion. With the greater emphasis in 2011–2012 on CAP grants and other complex PI arrangements, this challenge has intensified. Further addressing such potential shortcomings probably will require a better understanding of how project scope and scale combine to influence publication rate.
Interaction results in the 2011–2012 model (see Table G-4 in Appendix G) reinforce this observation. The interaction there between PI numbers and refereed-article production is statistically significant and positive, implying that the greater the number of PIs on a project, the higher the cost to produce one more refereed article. Similarly, interaction between project duration and nonrefereed-paper production is positive and significant, implying that greater project time raised the cost of another nonrefereed article. In other words, longer projects brought lower rates of nonrefereed publication return to the next budget dollar. This observation is consistent with an additional project month’s own negative effect on nonrefereed-paper production, when other factors are held constant [cell (viii), Table 4-3]. That is significant because quality among nonrefereed publications—including conference proceedings, abstracts, bulletins, and student theses—likely varies more than it does among refereed publications.
TABLE 4-3 Research Productivity: Pairwise Effects of Selected Factors, AFRI, 2011–2012
| (1) Number of Refereed Articles | (2) Number of Nonrefereed Articles | (3) Number of PIs | (4) Project Budget | (5) Project Duration | |
| (1) Number of refereed articles | |||||
| (2) Number of nonrefereed articles | (i)–1.96 | ||||
| (3) Number of principal investigators | (ii)–3.07 | (iii)–1.57 | |||
| (4) $10,000 of project budget | (iv) 0.12 | (v) 0.06 | (vi) 0.04 | ||
| (5) Months of project duration | (vii)–0.24 | (viii)–0.12 | (ix)–0.08 | (x)0.49 | |
NOTE: The number in a given cell is the effect on the variable above of applying one more unit of the variable on the left. Roman numerals in parentheses are cell numbers.
In its Research, Education, and Economics Action Plan (USDA, 2012), USDA observed that “accountability is necessary to determine if we are moving science in the right direction” and asked itself “Are we making the world better with our science?” (p. 34). The question could be rephrased to ask whether USDA research and education projects could be shown to directly or indirectly contribute to the Department’s mandate, which includes improvement in agricultural productivity, economic growth, job creation, food safety and security enhancement, and ecosystem sustainability.
In this chapter, the committee addressed those outcomes in terms of the more immediate program outputs that may support long-term aims, and examined the output and outcomes from the perspective of only several years since the projects were initiated. Impact factors and readership sizes of the journals in which AFRI articles appeared were not accounted for. However, the AFRI dataset used provides rich, cross-sectional information. In particular, it provides cross-project comparisons of AFRI study inputs and their successes in achieving early communication outputs. Such cross-sectional richness probably accounts for much of the regressions’ rather high goodness-of-fit, and for the coefficient stability observed across time-interval and equation specifications.
Early data suggest that although each new budget dollar has enhanced publication rate, the average AFRI project’s scope or complexity has been excessive, and increasingly so in recent years. Efficiency impairment was such that publication rates rose even when the budget was held constant and project scope fell. The difficulty with complex projects may be their high intraproject coordination and communication costs, which would have pushed variable expenses too far above fixed or infrastructural costs. Because greater complexity requires more money, this difficulty would lead to excessive budgets as well, even though another dollar of budget has, on its own account, been shown in the analysis to be highly productive.
Rates of return in this chapter have been expressed in terms of scholarly communications. A more complete assessment would involve converting these rates into the types of social-outcome measures referred to in Chapter 2, such as a communication’s contribution to agricultural production value. Presuming that a researcher’s compensation is on average proportional to his or her economic contribution, one method of doing so is to draw on information about a publication rate’s influences on researcher salary (keeping in mind that factors such as journal impact and researcher salary are highly discipline specific). Although the committee did not have an opportunity to pursue that kind of analysis, AFRI might in a future estimate of its research contributions consider weighting publication outputs by their mean marginal impacts on scientist salaries.
Bibliometric approaches, however, are not the only ones available for assessing program output. A more direct approach would be to compare a study’s findings with its principal investigators’ prior expectations of what the findings would be. The difference between a project’s expectations and eventual outcomes constitute the magnitude of the scientific discovery, rigorously expressible in the form of a likelihood value. Bayesian approaches for estimating these discovery magnitudes have been used to assess individual scientific projects. More recently, the method has been extended to the analysis of an entire program such as AFRI’s. The approach requires only that proposals include the principal investigators’ probabilistic anticipations of their main results, which then can be compared with the completed experiments or surveys (Qin, 2012).
FINDINGS
Finding 4-1: In measuring AFRI’s effectiveness, analysis of early publication data suggests that although each new AFRI dollar boosts publication output, the average project’s scope and complexity have been excessive. In particular, reducing average project complexity—represented especially in the number of the project’s PIs—would substantially improve publication output at no cost to AFRI’s budget. That critique extends beyond the CAP program to include many non-CAP grants. Less compelling evidence suggests that mean project duration has also been somewhat excessive. Such near-term output assessment provides only one perspective on AFRI performance. Improved performance analyses will require systematic attention to long-term outputs and, more importantly, to project outcomes in the form of the science influenced, social well being, and products and incomes generated. AFRI’s history is still too short to allow that sort of assessment.
Finding 4-2: In the present report, refereed publications and their citation rates were drawn from Google Scholar. However, such online data sources are not as effective in keeping up with the abstracts, conference papers, speeches, posters, dissertations, and station reports that are financed with AFRI money and that form an important part of AFRI project communication and program assessment. Some nonrefereed output data are, up to the project’s official termination date, available in CRIS but difficult to assemble and require much organization before analysis can be performed. The committee assumes that AFRI management would encounter similar difficulties.
Adams, J.D. 1990. Fundamental stocks of knowledge and productivity growth. Journal of Political Economy 98(4):673-702.
Alston, J.M., G.W. Norton, and P.G. Pardey. 1995. Science Under Scarcity: Principles and Practice for Agricultural Research Evaluation and Priority Setting. Ithaca, NY: Cornell University Press.
Azoulay, P., W. Ding, and T. Stuart. 2007. The determinants of faculty patenting behavior: Demographics or opportunities? Journal of Economic Behavior & Organization 63(4):599-623.
Buccola, S., D. Ervin, and H. Yang. 2009. Research choice and finance in university bioscience. Southern Economic Journal 75:1238-1255.
Campbell, D., M. Picard-Aitken, G. Côté, J. Caruso, R. Valentim, S. Edmonds, G.T. Williams, B. Macaluso, J.-P. Robitaille, N. Bastien, M.-C. Laframboise, L.-M. Lebeau, P. Mirabel, V. Larivière, and É. Archambault. 2010. Bibliometrics as a performance measurement tool for research evaluation: The case of research funded by the National Cancer Institute of Canada. American Journal of Evaluation 31(1):66-83.
Carayol, N., and M. Matt. 2004. Does research organization influence academic production?: Laboratory level evidence from a large European university. Research Policy 33(8):1081-1102.
Cummings, J.N., and S. Kiesler. 2005. Collaborative research across disciplinary and organizational boundaries. Social Studies of Science 35(5):703-722.
Cummings, J.N., and S. Kiesler. 2007. Coordination costs and project outcomes in multiuniversity collaborations. Research Policy 36:1620-1634.
Evenson, R.E., and Y. Kislev. 1975. Agricultural Research and Productivity. New Haven, CT: Yale University Press.
Foltz, J.D., K. Kim, and B. Barham. 2003. A dynamic analysis of university agricultural biotechnology patent production. American Journal of Agricultural Economics 85:187-197.
Fortin, J.-M., and D.J. Currie. 2013. Big science vs. little science: How scientific impact scales with funding. PLoS ONE 8(6):e65263.
Griliches, Z. 1990. Patent statistics as economic indicators: A survey. Journal of Economic Literature 28:1661-1717.
Gulbrandsen, M., and J.-C. Smeby. 2005. Industry funding and university professors’ research performance. Research Policy 34(6):932-950.
Jaffe, A.B. 1986. Technological opportunity and spillovers of R&D: Evidence from firms’ patents, profits, and market value. American Economic Review 76(5):984-1001.
Levin, S.G., and P.E. Stephan. 1991. Research productivity over the life cycle: Evidence for academic scientists. American Economic Review 81(1):114-132.
Nag, S., H. Yang, S. Buccola, and D. Ervin. 2012. Productivity and financial support in academic bioscience. Applied Economics 45(19):2817-2826.
NRC (National Research Council). 2004. Facilitating Interdisciplinary Research. Washington, DC: The National Academies Press.
Pardey, P.G. 1989. The agricultural knowledge production function: An empirical look. Review of Economics and Statistics 71(3):453-461.
Qin, L. 2012. The Economics of a Research Program: Knowledge Production, Cost, and Technical Efficiency. PhD Dissertation, Oregon State University.
Trochim, W.M., S.E. Marcus, L.C. Mâsse, R.P. Moser, and P.C. Weld. 2008. The evaluation of large research initiatives: A participatory integrative mixed-methods approach. American Journal of Evaluation 29(1):8-28.
Turner, L., and J. Mairesse. 2003. Individual productivity differences in scientific research: An econometric study of the publications of French physicists. Available online at http://www.nber.org/CRIW/papers/mairesse.pdf.
USDA (U.S. Department of Agriculture). 2012. Research, Education, and Economics Action Plan. Washington, DC: U.S. Department of Agriculture.
Xia, Y., and S. Buccola. 2005. University life science programs and agricultural biotechnology. American Journal of Agricultural Economics 87:229-243.
Zucker, L.G., M.R. Darby, and M.B. Brewer. 1998. Intellectual human capital and the birth of U.S. biotechnology enterprises. American Economic Review 88(1):290-306.


