
Satellite, airborne, and surface-based sensors operating from the very-low-frequency (VLF) range to the optical region of the electromagnetic (EM) spectrum have been used for remote sensing of permafrost landscapes for several decades (Duguay et al., 2005; Hall, 1982; Kääb, 2008; Westermann et al., In press). As discussed in the previous chapter, permafrost can be studied by remote sensing directly and indirectly through the measurement of permafrost-related ecological variables. Measurements of subsurface permafrost could be based indirectly on remotely sensed observations of the climate and hydrological controls (such as air and surface temperatures, snow depth, and soil moisture) and on observations of the surface expressions of subsurface phenomena or on measurements of subsurface properties directly. The former observations are, for example, obtained using fine-resolution spaceborne and airborne optical systems, which have been used for mapping ground cover, topography, and changes in permafrost. Satellite and airborne optical and IR (infrared) sensors have been used to determine surface topography, soil properties, and surface temperature and to map thermokarst (Duguay et al., 2005; Kääb, 2008).
Active microwave sensors have also been used for permafrost monitoring and mapping. Ground-penetrating radars have been used to map the thickness of both the active layer, particularly during the winter season before the onset of surface melt, and buried ice in permafrost during both the winter and summer (Arcone et al., 2002; Hubbard et al., 2013; Leuschen et al., 2003; Westermann et al., 2010; Yoshikawa et al., 2006). Radar backscatter from a distributed target depends on surface roughness, dielectric properties, and the internal structure of the subsurface. In addition, the backscattered signal is strongly modulated by the presence of water and has been exploited for mapping freeze/thaw conditions, surface soil moisture and soil moisture profiles under favorable conditions, and surface topography (Alasset et al., 2008; Bartsch et al., 2012; Boehnke and Wismann, 1996; Komarov et al., 2002; Sabel et al., 2012; Strozzi et al., 2010; Watanabe et al., 2012). InSAR has been utilized to study active layer changes and long-term surface deformation (Liu et al., 2010; Singhroy et al., 2007).
Coarse-resolution passive microwave sensors (with tens of kilometers footprints) are used to determine soil moisture and snow conditions (Yubao et al., 2010). Both spaceborne and airborne LiDAR (LIght Detection And Ranging) have been used for fine-resolution mapping of surface topography of regions underlain by permafrost (Hubbard et al., 2013; Jones et al., 2013; Figure 2.1).
During the workshop, two tables were developed to better structure the discussion on permafrost research needs and the relevant remote sensing methods and sensors that may address these needs (Tables 2.1 and 2.2).1Table 2.1 consists of permafrost processes and properties, and Table 2.2 consists of ecological variables that are categorized by six permafrost-related research ecological categories: climate, topography, geology and soil, hydrology, vegetation and land cover, and
_______________
1 These two tables are not comprehensive; rather they serve as a tool for organizing the information that was discussed at the workshop.
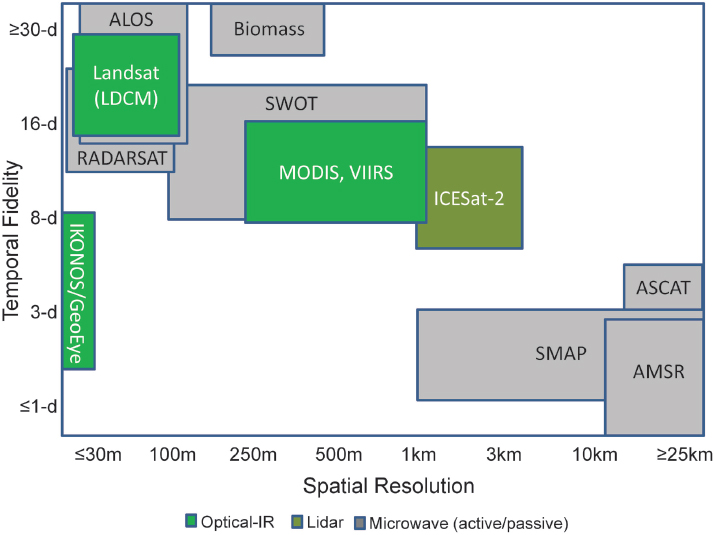
FIGURE 2.1 Space-time plot of selected near-term (2013-2020) satellite sensor observations with potential relevance for permafrost. ALOS-2 (L-band SAR) has a planned launch in 2014. ESA Biomass Earth Explorer mission will be the first satellite P-band SAR with a potential launch in 2019. Landsat 8 was launched in February 2013 and utilizes two sensors, the Operational Land Imager and the Thermal InfraRed Sensor. RADARSAT (C-band radar data) refers to the RADARSAT Constellation Mission, which is scheduled for launch in 2018. IKONOS and GeoEye/RapidEye are commercial optical-NIR (near infrared). SWOT (Surface Water Ocean Topography) is a Ka-band SAR altimeter and radar interferometer with a potential launch in 2020. VIIRS, a subsequent mission to MODIS, is a scanning radiometer that collects visible and infrared imagery and radiometric measurements. ICESat-2 (LiDAR) is a second-generation orbiting laser altimeter scheduled for launch in 2016. ASCAT (Advanced SCATterometer) is a C-band radar that was launched in 2006. SMAP (L-band SAR) is scheduled to launch in late 2014. AMSR (Advanced Microwave Scanning Radiometer) is a passive microwave radiometer and does not currently produce data. HyspIRI (Hyperspectral Infrared Imager; not shown in figure), which will include a combination of VIS-IR and TIR instruments, is still in the study stage. This figure does not include all upcoming missions applicable to permafrost remote sensing studies (e.g., ESA Sentinels 1 and 2 [SAR and Landsat-type optical sensors]; gravimetry missions; X-band SAR, TerraSAR-X, and Tandem-X). SOURCE: Image courtesy of John Kimball, University of Montana.
greenhouse gases. Each variable in both tables has a description of any relevant ecological indicators (second column); remote sensing techniques that currently exist to measure these variables (the third column) or their ecological indicators (the fourth column); remote sensing technologies that may become available in the future (the fifth column); the available (the sixth column) and desirable (the seventh column) spatial and temporal resolution of the relevant remote sensing products; and examples from the published literature (last column). The following discussion is structured in accordance with the categories presented in Tables 2.1 and 2.2.
Of the more than 60 permafrost and related ecological variables that were discussed during the workshop, those listed in Box 2.1 emerged as having the most impact in advancing the current state of knowledge of permafrost landscapes, if they could
BOX 2.1
Important Permafrost and Related Ecological
Variables to Measure with Remote Sensing
Active layer thickness
Ground ice (volume and morphology)
Snow characteristics (extent, water equivalent, depth, density, conductivity)
Surface topography (static, macro-, and micro-)
Longer-term surface subsidence
Thermokarst distribution
Surface water bodies (including dynamics, redistribution)
Surficial geology-terrain units (including lithology, bedrock)
Soil organic layer (thickness, moisture, conductivity)
Land cover (including spectral vegetation indices)
Vegetation structure and composition
Methane (flux or concentration)
Water vapor flux
Carbon dioxide (flux or concentration)
Land surface (skin) temperature
Subsurface soil temperature
Seasonal heave/subsidence
Soil moisture
Biomass (above ground)
be measured through remote sensing. It is important to note that it may not be currently possible or even feasible to remotely sense some of these properties in the near future.
PERMAFROST PROPERTIES AND PROCESSES
Permafrost
Active layer thickness is defined as the depth of a near-surface layer of soil or rock that experiences periods of freezing and thawing during an annual cycle. The freezing/thawing processes may produce some distinct geomorphological features such as sorted and unsorted circles and other small-scale patterned ground (Figure 2.2). The term “active layer” is most commonly used to describe a seasonally thawed layer above permafrost that thaws through during summer and completely refreezes during the next winter. The maximum depth of the summer thaw is usually observed at the very end of the warm period (August, September, or even October in the Northern Hemisphere, depending on site location) and may vary between a few decimeters to several meters. This maximum depth of thaw is called the “active layer thickness” (ALT). Another variable related to seasonal freezing and thawing is called the “depth of seasonal freezing.” This variable may be observed and measured in the area where permafrost is either completely absent or absent in at least the few upper meters. The seasonally frozen layer forms during the cold part of the year and completely thaws during the summer. Both of these variables are relevant to permafrost. Increase in the maximum depth of seasonally thawed layer (or in the ALT) indicates the beginning of permafrost degradation and may lead to local permafrost instability if any substantial amount of ground ice is present in the near-surface permafrost. Inversely, if the increase in the seasonally frozen layer thickness exceeds the maximum thickness of the seasonally thawed layer, then it may lead to the formation of new permafrost. Both of these variables are important for functioning of the ecosystem and for the stability of infrastructure in cold regions.
Several traditional methods reviewed by Hinkel and Nelson (2003) are used to determine the interannual and long-term changes in thickness of the active layer: mechanical probing once annually, frost (or thaw) tubes, and interpolation of soil temperatures obtained by data loggers. The ability to use remote sensing methods to directly estimate the depth of the active layer over large synoptic areas is limited at this moment, but a few promising techniques based on lower-frequency microwaves have been proposed recently. For small areas of coverage, surface-based ground penetrating radar (GPR) systems have been proven to provide high-quality information about the ALT (Hubbard et al., 2013). These sensors, however, cannot feasibly be used to produce such information over large regions. Low-frequency (i.e., long wavelengths) airborne or spaceborne synthetic aperture radars (SARs) are able to cover large areas rapidly. They have the capability to penetrate the ground to varying degrees, depending on the liquid water content, layering structure, and texture of soils. Although specific demonstration of ALT retrieval using SAR systems over permafrost soil has not yet taken place, it has been shown that retrieval of soil moisture for a range
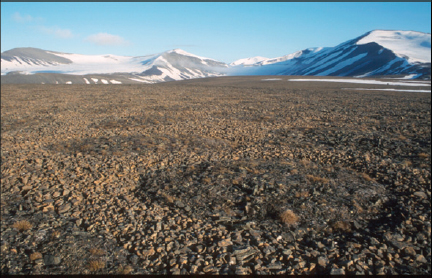
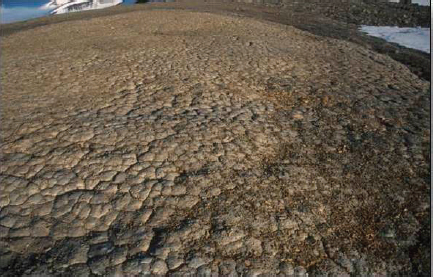
FIGURE 2.2 Active layer features. The left shows “sorted ground,” and the right shows “small-scale patterned ground.” SOURCE: Photos by Guido Grosse.
of textures and temperatures, as well as for a variety of land cover types, is possible with good fidelity (Tabatabaeenejad et al., in review). Recent observations using the AirMOSS and the UAVSAR airborne synthetic aperture radars (Tabatabaeenejad and Moghaddam, 2011) have shown the potential for this capability. Additionally, the airborne electromagnetic (AEM) method2 was recently proposed as a way to estimate the ALT (Pastick et al., 2013).
Liu et al. (2012) recently proposed an indirect method of estimating the dynamics of the ALT using seasonal ground-surface subsidence trends derived from InSAR (interferometric synthetic aperture radar; Figure 2.3). This method requires knowledge of many other characteristics of the active layer, such as porosity and water content. These requirements may limit the ability to use this method. However, other remote sensing methods may be used to estimate the necessary variables and help to apply this method to the areas where the required information is currently unavailable. Another approach in estimating the ALT may be the application of physically based permafrost dynamics models (Riseborough et al., 2008; Sazonova and Romanovsky, 2003; Sazonova et al., 2004). Again, the required input data for these models may be derived from existing remote sensing products.
_______________
2AEM relies on the physics of electromagnetic induction to detect physical properties from the near surface down to several hundred meters below ground. Inductive electromagnetic methods are primarily sensitive to the electrical characteristics of geological materials that, in turn, are a function of properties such as unfrozen water content, lithology, and salinity. For more information on AEM, see Burke Minsley’s abstract in Appendix A.
FIGURE 2.3 Mapping the 1992-2000 average ALT in Prudhoe Bay using InSAR methods. SAR phase observations can provide measurements of surface dynamics, which can be used to indicate surface change and measure cm-scale surface deformation. An algorithm was developed to estimate long-term average ALT using thaw-season surface subsidence derived from spaceborne InSAR measurements. The algorithm uses a model of vertical distribution of water content within the active layer accounting for soil texture, organic matter, and moisture. The estimated ALT values match in situ measurements at Circumpolar Active Layer Monitoring (CALM) sites within uncertainties. SOURCE: Liu et al., 2012.
Many workshop participants noted that a desirable resolution for the ALT is 5 cm vertical and 30 m horizontal. The minimum temporal resolution of measurements would be once per year at the end of the warm season (mid-August to late September depending on latitude). However, it is desirable to have several measurements per warm season to establish the rate of thaw depth propagation.
Ground ice (volume and morphology). The presence of ground ice makes permafrost a unique component in the geological system (Figure 2.4). Several permafrost properties depend on the amount of ice included and the specific geometric forms of these inclusions. If ice is present, then all properties of permafrost become temperature dependent with a major threshold at the melting point of ice. Because at some locations the volume of ice in permafrost may exceed 80 percent or even 90 percent of the total volume, dramatic changes in the environment could be expected upon thawing. Permafrost can also be very ice poor, and the volumetric ice content may not exceed a few percent in other locations. In this situation, thawing of permafrost will not produce any significant changes in micro-topography. However, even in this situation, the loss of pore ice can affect the physical and biogeochemical properties of the subsurface substrate.
The amount of ground ice is measured in the field by permafrost coring and sampling of the natural permafrost exposures (French and Shur, 2010; Kanevskiy et al., 2013; Murton, 2013). The site-specific data on ground ice obtained in the field may be extrapolated
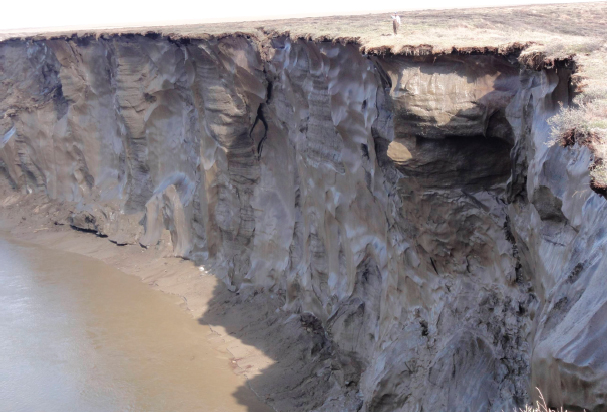
FIGURE 2.4 Large syngenetic ice wedges that developed in eolian silt during the late Pleistocene exposed in a ~25-m-high bluff along the Itkillik River in northern Alaska (see Kanevskiy et al., 2011; photo by T. Jorgenson). Syngenetic permafrost is formed when soil freezes and becomes permafrost as the soils are being deposited by wind, water, and/or gravity.
to the larger region using the knowledge of geological structure and the permafrost history of the entire area of investigation. Remote sensing products could be efficiently used for this extrapolation. The remote sensing methods that could be used to directly estimate the relative amount of ground ice in permafrost include AEM; the application of AEM (Minsley et al., 2012) for permafrost measurements, including ALT and ground ice content, has been demonstrated. A few studies with GPR were conducted to map ground ice with successful results under favorable conditions (Arcone et al., 2002; Leuschen et al., 2003; Yoshikawa et al., 2006). Most of these measurements were with surface-based systems. Airborne GPR with SAR and tomographic processing have the potential to map ground ice over large areas. In addition, ultra-wideband SARs operating in the high-frequency (HF) and very-high-frequency (VHF) regions might be useful for ground ice mapping. Promising indirect methods may be based on the estimation of total subsidence in the ground surface produced by ice masses melting away. The difference in topography between intact surfaces and the bottom of the thermokarst depressions measured using remote sensing techniques may be used to estimate the volume of melted ice. High-resolution optical sensors and airborne LiDAR may be used for this purpose.
Several workshop participants indicated that a horizontal resolution of 1 to 10 m is sufficient for this permafrost characteristic. They noted that the accuracy of ice volume estimations of 10 percent or more of the total volume would be better.
Subsurface soil temperature. According to its definition, the presence or absence of permafrost depends on the temperature of the soil. Many of the properties of permafrost, including those important to engineering, also depend on temperature. Soil temperatures are obtained in the field by lowering a calibrated temperature sensor into a borehole or recording temperature from multisensor cables permanently or temporarily installed in the borehole. Measurements may be recorded manually with a portable temperature logging system or by data loggers. No remote sensing techniques will allow direct measurement of subsurface soil temperature. However, the remote sensing derived products of land surface (or “skin”) temperature (LST),3 snow water equivalent, and snow depth (see the Climate section) may be used in physically based permafrost thermodynamic models to indirectly calculate subsurface soil temperature. Microwave radiometers operating in the ultrahigh-frequency (300-1,000 MHz) range of the EM spectrum are being explored for measuring subsurface temperature (Matti Vaaja and Hallikainen, 2013). Workshop participants noted that when using this modeling approach for estimating subsurface temperatures a horizontal resolution of LST data on the order of 30 m would be optimal.
Permafrost presence/absence. Maps of permafrost distribution are needed for infrastructure planning and various types of land management. At the same time, permafrost distribution maps are presently available only in generalized form at global to regional scales. Fine-resolution maps have not yet been developed for most permafrost-affected regions. Recent studies show good potential of AEM to directly map near-surface permafrost. Some workshop participants noted that this task is not trivial and requires additional information on geological structure and other environmental characteristics of the mapped area. Improvements here could lead to the development of fine-resolution maps of permafrost over large areas. Several workshop participants noted that the required horizontal resolution depends on the scale of investigation. For circumpolar mapping, a resolution of several hundred meters would be sufficient; a horizontal resolution of 1-10 m is needed for local maps of permafrost distribution.
Depth to top of permafrost. This permafrost property is critical for estimating the long-term rate of permafrost thaw. “Talik”—which occurs when the ground layer above permafrost does not completely freeze, even during the winter months—plays an important role in surface and subsurface hydrology and in the permafrost-carbon cycle-climate feedbacks. The thermal conditions in this layer are suitable for supporting year-round decomposition of the organic matter previously sequestered in the near-surface permafrost. Depth to top of permafrost is also important for engineering and infrastructure development on degrading
_______________
3 Land surface temperature, which is different from air temperature, is the temperature of the uppermost surface of objects on the Earth surface as detected by remote sensors.
permafrost. The AEM method can be used to estimate this variable. There are practically no indirect methods that can be used to address this question, except for the application of physically based permafrost thermodynamics models. As discussed by many participants, the required horizontal resolution depends on the expected use of the product. For circumpolar mapping, a resolution of several hundred meters would be sufficient. For developing local maps of permafrost distribution, it is desirable to have 1 to 10 m horizontal resolution.
Permafrost thickness and 3D geometry. Knowledge of permafrost thickness and 3D geometry is important in relation to understanding permafrost extent and surface and subsurface hydrology, including thermokarst lake dynamics. Development of new thermokarst lakes and an extension of existing lakes lead to changes in permafrost geometry below lakes and near lake margins. The related talik formation and extension is an important process leading to the production of a significant amount of methane, a critically important greenhouse gas (Walter et al., 2006, 2007a, b). AEM has been used to estimate these permafrost properties (Jepsen et al., 2013; Minsley et al., 2012). SARs operating in the VHF and P-band part of the spectrum with tomographic capability have the potential to provide information on permafrost thickness and 3D geometry. These include GeoSAR, AirMoss, and unmanned aerial vehicle (UAV) SARs. The radar depth sounder/imager currently being operated on NASA IceBridge might also be useful for this purpose (Rodriguez-Morales et al., 2013).
In particular, ultra-wideband radars for 3D imaging of the ice-bed interface of polar ice sheets have been developed over the past few years, applying basic concepts of tomography using a sequence of 2D image slices, much like what is done with X-ray tomography. Many technical limitations in this technology have recently been overcome through advances in RF and microwave, as well as digital technologies spawned by the communication industry. Radars with multiple receivers and transmitters, large bandwidths, and advanced SAR processing algorithms have been developed and used for fine-resolution 3D measurements over ice sheets (Jezek et al., 2011; Paden et al., 2010; Rodriguez-Morales et al., 2013). Such radars can potentially be used to measure the ALT and map ground ice.
Near-surface seasonal freeze/thaw state. Although not unique to permafrost landscapes, near-surface freeze/thaw state and its duration, timing, and spatial characteristics may have strong correlation with presence/absence and physical properties of permafrost. Active microwave sensors have been used extensively for detecting seasonal freeze/thaw (e.g., Kimball et al., 2006; McDonald et al., 2004). This measurement is among the most accurate and sensitive measurements possible with microwave sensors, because the backscattering properties of dielectric material that include water (such as soils and vegetation) are strongly altered when transitioning between frozen and thawed states. In frozen form, soils and vegetation have very low backscattering strengths. With increasing water content (e.g., transition of ice into liquid water), the dielectric constant of soils and vegetation components increases rapidly and generally causes a marked increase in backscattering across sections measured by the active sensors. Using time-series analysis of microwave measurements, it is possible to identify clear thresholds for freeze/thaw transitions for various landscapes. The thresholds can vary significantly depending on whether the ground is covered by vegetation and, if so, by the type and density of vegetation. Furthermore, freeze/thaw state has environmental indicators that may also be characterized with other remote sensing techniques. These include presence or absence of liquid water, surface heave or subsidence, overlying vegetation characteristics, and snow properties. A variety of existing and planned sensors are suitable candidates for retrieving these properties, including repeat-pass C-band or L-band InSAR (for surface subsidence), LiDAR (for surface subsidence, vegetation properties, snow), and various SAR instruments (for presence of liquid surface water).
PERMAFROST-RELATED ECOLOGICAL VARIABLES
Climate
Climate is, of course, a critical driver for the evolution of frozen ground. On the landscape scale, mean climate conditions have led to the past creation of permafrost and ground ice; recently they have also
led to its degradation. On the plot scale, microclimate features such as topographic-related variations in soil moisture and temperature are the results (and further drivers) of the forms of change most closely associated with permafrost, such as patterned ground and thermokarst. When in equilibrium, LST is the result of a balance of upward and downward radiative sensible and latent heat fluxes and is impacted by the vegetation, albedo, and underlying soil properties, such as thermal conductivity.
Land surface skin temperature and atmospheric temperature. Profiles of these two variables are both accessible from a number of historic and current satellites, including sensors on NOAA’s GOES and POES platforms, AIRS on Aqua, and CrIS on SNPP. LST is also available from AMSR, SSM/I, MODIS, SNPP, AVHRR, Landsat, ASTER, and airborne sensors using either infrared or microwave technologies (Hachem et al., 2009; Jones et al., 2010; Kimball et al., 2009). Land-based in situ air temperature measurements are typically made between 1 and 3 m above ground and will differ somewhat from LST (Hachem et al., 2012).
Precipitation. As a source of moisture, precipitation is also an important driver for the evolution of permafrost and ground ice. Quantitative precipitation estimates (QPE is “how much” precipitation as opposed to indicators of whether or not it is precipitating) are generated from operational meteorological satellites, such as the GOES and POES platforms in the United States. QPE algorithms are designed to work best in the contiguous United States and are not optimal for solid or mixed precipitation or for high latitudes. However, this information is challenging to verify because of the extreme difficulty of accurately measuring solid precipitation, even near the ground. Participants reported that the launch of the Global Precipitation Mission may show improvements in satellite estimates of precipitation in cold regions; airborne testing with sensor prototypes was promising.4
Snow on the ground. A critically important driver for the evolution of ground temperature is snow on the ground because of its powerful insulating properties. Key properties of snow for permafrost interactions include its depth, density, snow water equivalent (SWE), and thermal conductivity. Sensors with optical bands, such as MODIS, are relatively successful at mapping the snow-covered area (SCA) at the 500-m pixel scale, particularly in treeless areas (Hall and Riggs, 2007). Other satellite-borne sensors, such as passive microwave (e.g., AMSR, SSM/I), have been used to develop SWE products with mixed results (Derksen et al., 2003; Hancock et al., 2013). The global and region-specific algorithms developed to date vary considerably in their uncertainties. Radar-based approaches have been proposed to more accurately measure SWE and have been flown successfully on aircraft (Rott et al., 2010, 2012; Xu et al., 2012). The ultra-wideband radars (i.e., 2-8 GHz and 12-18 GHz) being flown as a part of Operation IceBridge to measure thickness of snow over sea ice also have the potential to measure the thickness of snow over land, as discussed at the workshop.
Snow depth on the ground is highly variable on scales from 10 cm and larger, in part because the pack evolves differently when it interacts with vegetation, and wind may redistribute snow on the ground, packing it into topographic and biological crevices. Modeling can estimate snow depth from snow-covered areas, but only during the depletion season, and it is limited by the large pixel size of the SCA products (such as 500 m from MODIS). Many workshop participants noted that this scale is sufficient for large landscape-scale estimates of snow cover, but not for studying snow interaction with individual thermokarst features or ice-wedge polygons (1-10 m scale). Currently, this can only be done from aircraft or commercial/defense satellites.
For large-scale permafrost modeling, researchers generally tend to use meteorological inputs from atmospheric reanalyses (e.g., Anisimov et al., 2007; Arzhanov et al., 2008; Mugford and Dowdeswell, 2010) rather than from remote sensing directly. Two notable exceptions are Marchenko et al. (2009) and Langer et al. (2013), who integrated satellite-derived LST and SWE in permafrost model experiments. Atmospheric reanalyses are historical runs of atmospheric or coupled oceanic-atmospheric models that assimilate remote sensing and in situ (especially radiosonde) observations. Analyses products are convenient because output is gridded and different state variables
_______________
(e.g., air temperature, precipitation, wind) are forced to have some physical consistency and operate on first principles. While the spatial resolution of reanalysis products is continually improving, they are currently available at the “large landscape scale,” for example, 0.5 degree latitude and 0.7 degree longitude for NASA’s Modern Era-Retrospective Analysis for Research and Applications (MERRA) in 2012 and approximately 0.3-degree (32-km) grid resolution for the North American Regional Reanalysis (NARR) product. Another advantage of reanalysis products is that many are now available for multiple decades such that interannual and decadal-scale variability is encompassed, including variability attributed to large-scale modes like El Niño-Southern Oscillation, the Pacific Decadal Oscillation, and the Arctic Oscillation. Shorter-term observations from airborne or satellite missions may not capture the full range of variability evident in longer climate records.
For researchers interested in the evolution of plot- and watershed-scale features on the landscape, the spatial resolution of current satellite remote sensing and reanalyses products is sufficient for some variables (e.g., air temperature) and insufficient for others (e.g., LST, precipitation, snow on the ground). Many workshop participants noted that airborne remote sensing observations are particularly useful for fine-spatial-resolution measurements of LST and mapping snow on the ground, but are difficult to support for routine temporal repetition of measurements.
Topography
Surface topography. Workshop participants noted that surface topography is an important variable for permafrost landscapes. In particular, it is important to measure thermokarst distribution by identifying elevation changes in areas where active thermokarst is occurring and by estimating loss of ice content in these thermokarst areas (Jones et al., 2012; Short et al., 2011). Topographic variables also provide essential information on the presence/absence of permafrost via “integrated terrain units” that combine slope, aspect, and elevation along with other indirect indicators. Topographic variables (such as longer-term surface subsidence and seasonal heave and subsidence) are also useful for estimating the topographically influenced distribution and variability of incident radiation across the surface, which can be used for traditional mapping approaches as well as for input in some permafrost models that simulate radiation balance. Because topography can be directly measured, many workshop participants believe that there is no pressing need to measure ecological indicators of topography, although a number of other variables (such as lake extent and vegetation cover change) are a result of and thus indicators of topographic change. Indirect indicators do have the advantage of being more readily available, for example, from stereo-interpretation of high-resolution optical remote sensing images, although they may not be as accurate as more direct remote sensing approaches.
Currently, the best system to measure topography and topographic change is airborne LiDAR, which provides relatively simple and direct yet highly accurate data on elevation, from which surfaces can be gridded at various spatial resolutions depending on the density of LiDAR sampling (e.g., Jones et al., 2011). LiDAR has the added advantage of providing structure information on vegetation canopies along with the underlying topography. InSAR can also be used to measure topography (Figure 2.5; Chen et al., 2013; Liu et al., 2012; Short et al., 2011). InSAR uses phase information of reflected radiation, which is obtained by two displaced antennas on two or more aircraft or satellites passing over the same area to determine surface topography. The horizontal resolution of spaceborne InSAR digital elevation models (DEMs) ranges from about 30 to 100 m and vertical resolution from 10 to 15 m. For airborne InSAR DEMs, the horizontal resolution ranged from about 1 to 10 m and vertical resolution from 50 cm to 2 m. Several aircraft LiDAR and SAR instruments are suitable for topography mapping, including those from commercial LiDAR providers. There is currently no space-based LiDAR mission available for topographic mapping, but the Tandem-X InSAR mission is currently active and additional coverage should allow repeat DEM differentiation through time. As some participants noted, SAR sensors onboard previously active platforms (e.g., ALOS, ENVISAT, RADARSAT), could also be used for InSAR-based topographic change mapping (subject to various temporal decorrelation limitations). Data from IceSat-I can also be used for topographic mapping, although the large footprint
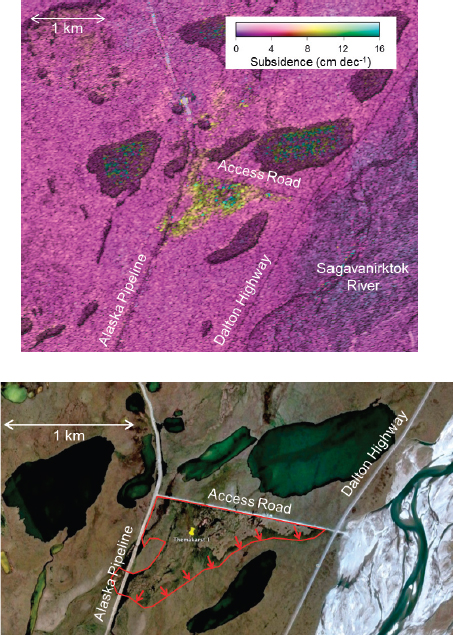
FIGURE 2.5 Thermokarst dynamics using InSAR. Anomaly in ALOS (Advanced Land Observing Satellite) subsidence trends near Deadhorse, Alaska (top). Google Earth image of thermokarst feature in Deadhorse, Alaska (bottom). Presented by Kevin Schaefer.
and wide spacing makes it of limited utility for many of the topographic changes taking place in the Arctic (e.g., thermokarst features).
Airborne and spaceborne photogrammetery is also being used to generate topographic maps using a computer vision technique called Structure from Motion and a new class of software. Some participants noted that the use of this technique is growing quickly
because the cost of acquisition is far less than airborne LiDAR, and, combined with ground control, errors are comparable to those from LiDAR or smaller. There also was mention of change detection software developed by both military and commercial interests that could facilitate change mapping of thermokarst features using various data sources (aircraft or satellite acquired).
The planned future sensors that could prove to be most useful for topographic mapping include the U.S. L-band InSAR mission (currently scheduled for a 2021 launch date) and the ICESat-2 ATLAS photon counting LiDAR mission (currently scheduled for a 2016 launch).
For developing regional maps of topography, many participants indicated that it would be desirable to have 1 to 10 m horizontal resolution; the higher resolution would be more applicable to local-scale studies of thermokarst features. At more global scales, topographic horizontal resolution would be beneficial at 30 m or less with a vertical accuracy less than 10 cm.
Geology and Soil
Surficial geology, as it relates to differentiating unconsolidated deposits with varying soil/sediment textures, depositional processes, and landscape age (Jorgenson et al., 2008; Kanevskiy et al., 2013; Kreig and Reger, 1982), is critical to assessing permafrost distribution and ground ice characteristics, said several workshop participants. Soil texture affects the moisture-holding capacity and development of segregated ice (Kreig and Reger, 1982), depositional history affects patterns of syngenetic and epigenetic5 permafrost formation (Shur and Jorgenson, 2007), and age affects the amount of time over which ice can aggrade or transition through complicated permafrost histories (French and Shur, 2010).
Surficial geology. Surficial geology and the related concepts of terrain units (Kreig, 1977), engineering geology (Carter and Galloway, 1985), landform soils (Kreig and Reger, 1982), and geomorphic units (Jorgenson et al., 1998) have traditionally been mapped through photo-interpretation of aerial photography, especially with stereo-pairs that enhance 3D recognition of terrain characteristics. The combination of photo-interpretation and borehole reference data allows the spatial extrapolation of many soil engineering properties, including ground ice characteristics, and has proven to be the most reliable mapping technique for large engineering projects (Jorgenson et al., 1998; Kreig, 1977). When used in conjunction with borehole information, ground-based geophysical surveys that included DC (direct current) resistivity,6 capacitive-coupled resistivity, and GPR have also proved useful for mapping surficial materials and permafrost (De Pascale et al., 2008; Moorman et al., 2003). AEM surveys also provide information on subsurface stratigraphy, but interpretation is dependent on adequate borehole reference data and surficial geology (Minsley et al., 2012; Van Dam, 2012). Progress has been made with airborne GPR for subsurface mapping (Catapano et al., 2012). While photo-interpretation and integrated-terrain-unit mapping remains a practical and effective approach for local-scale mapping, particularly for engineering projects, emerging approaches that integrate automated landform characterization of DEMs, satellite imagery, and airborne geophysics with spatial statistical techniques show good potential for mapping large areas (Ho et al., 2012; Pastick et al., 2013). Many workshop participants indicated that 1-5 m is desired for local scales, but 100-1,000 m is sufficient on the circumpolar scale.
Soil physical properties. In particular, mineral composition, bulk density, and texture are critical to active layer dynamics and permafrost characteristics because they affect moisture-holding capacities, thermal properties, ice segregation, heave, and thaw settlement characteristics (Farouki, 1981). Traditionally, aerial photography and optical satellite imagery have been used to manually delineate homogeneous soil-landscape units for which soil properties have been established through field sampling. Soil properties have been mapped indirectly with optical and microwave data using physically based and empirical methods, including mineralogy, texture, soil iron, soil moisture, soil organic carbon, soil salinity, and carbonate content (Anderson and
_______________
5 Epigenetic permafrost is formed in soils that have already been deposited by wind, water, and/or gravity.
6 Resistivity is a quantification of how strongly a specific material opposes the flow of electric current. A material that is considered to have low resistivity readily allows the movement of electric charge.
Croft, 2009; Barnes et al., 2003; Mulder et al., 2011). Most investigations have used optical imagery, such as SPOT HRV and AVIRIS hyperspectral data, for quantifying bare soil properties or inferring soil properties from vegetation spectral responses (Barnes et al., 2003). Digital mapping methods are being developed using remotely sensed imagery for spatial interpolation of sparsely sampled soil properties (Browning and Duniway, 2011; Morris et al., 2008). Recently, Pastick et al. (2013) have developed machine-learning regression tree models using Landsat imagery, AEM surveys, and more than 20 ancillary layers to map active layer thickness and permafrost distribution in central Alaska. Workshop participants said that 1-5 m is ideal for local scales, but 100-1,000 m is sufficient on the circumpolar scale.
Soil organic layer. Properties such as thickness, moisture content, density, and thermal conductivity are important to permafrost dynamics because of their strong controls on soil thermal properties, active layer dynamics, and permafrost stability (Farouki, 1981; Johnson et al., 2013). Peat thickness and stratigraphy have been quantified through ground-based electrical geophysics (Slater and Reeve, 2002) and GPR (Laamrani et al., 2013; Rosa et al., 2009). Organic thickness or carbon contents have been related to hyperspectral remote sensing and field spectroscopy (Gomez et al., 2008; Jarmer et al., 2010). Spatial modeling using numerous terrain attributes (e.g., gridded climate data, terrain attributes derived from a DEM, land cover derived from Landsat) has been used to predict organic-layer thickness across Alaska (Mishra and Riley, 2012). Use of AEM, induced polarization imaging from SAR, and spatial modeling techniques that incorporate a wider range of optical and microwave satellite imagery deserve more investigation. High-resolution LiDAR can be used for detecting change in organic layer thickness over time and could provide useful information, especially before and after fire, said some participants. Soil organic layer has also been successfully inferred from Landsat-based indices and regression of field measurements of peat depth in drained thermokarst basins, allowing extrapolation of basin age as well as peat depth to some degree (Jones et al., 2012).
Moss characteristics. Properties such as moss thickness, moisture content, and thermal conductivity are similar to organic layer properties in their importance to understanding permafrost distribution and dynamics. Spectral reflectance characteristics have been used to differentiate some moss species, or species groups, that can be used to infer differences in hydrology and carbon cycling (Bubier et al., 1997). In patchy moss environments in Antarctica, a UAV equipped with a high-resolution camera and 6-band multispectral sensor enabled integration of high-resolution DEMs with a spectral classification to map moss mats (Lucieer et al., 2012). The passive microwave radiometer AMSR E/2 may have some potential, but its large footprint sizes (down to 6 × 4 km) may restrict its application to highly variable moss mats. Remote sensing of moss thickness in boreal and arctic ecosystems, however, has not yet been adequately demonstrated. A number of workshop participants said that a vertical resolution of 5-10 cm would be ideal pre- and post-disturbance. Some participants noted that HyspIRI’s VSWIR (visible shortwave infrared) instrument will be useful for measuring moss characteristics, because it will provide a means for identification and classification of Arctic and subarctic vegetation.
Permafrost carbon. Organic matter preserved in frozen soils affects soil thermal properties and thaw settlement characteristics, and it is an important attribute of permafrost soils in which the large reservoir of frozen carbon can be released to the atmosphere after thawing, serving as a positive feedback loop to global climates (Jorgenson et al., 2013; McGuire et al., 2009; Schuur et al., 2008; Tarnocai et al., 2009). Traditionally, soil carbon contents have been associated with soil classification systems and related to terrain characteristics for mapping carbon stocks in the upper 1 m or more at coarse scales (Jones et al., 2010; Ping et al., 2011). Spatial modeling has been used to empirically model soil carbon distribution using geographic information systems (GIS) and thematic map inputs (Mishra and Riley, 2012; Zhou et al., 2008). Although some progress has been made in quantifying surface organics through field geophysical surveys (Laamrani et al., 2013), some workshop participants said that prospects for developing direct remote sensing techniques for
quantifying soil carbon deep in ice-rich permafrost are poor. Many workshop participants indicated that 1-5 m is desired for local scales, but 100-1,000 m is sufficient on the circumpolar scale.
Soil salinity. The effect of soil salinity on the unfrozen water content of permafrost is important for understanding the thermal and structural properties of permafrost (Farouki, 1981). Most progress in remote sensing and geophysical techniques, however, has focused on salinization in arid regions (Farifteh et al., 2006). Optical satellite imagery has long been used for mapping and monitoring salt-affected soils and has been most effective in severely saline areas (Farifteh et al., 2006). Spectral indices have been developed for mapping salinity levels using EO-1 Hyperion hyperspectral imagery (Weng et al., 2010). AEM has been successful for mapping areas where highly conductive saline water has infiltrated geologic materials that have naturally low conductivities (Corwin, 2008). Areas with sufficient salinity to substantially affect permafrost distribution are mostly restricted to coastal areas; thus, development of new technologies and methods may not be necessary in the near term.
Floating mats. Floating mats often occur around the margins of thermokarst lakes and in thermokarst fens, which can lead to inaccuracies in the quantification of permafrost degradation associated with thermokarst lake development (Jones et al., 2011; Jorgenson et al., 2012). Floating mats or shore fens are easily mapped through photo-interpretation (Jorgenson et al., 2012). Remote sensing of spectral characteristics has been used to map floating mats and submergent vegetation (Cho et al., 2008). GPR has been used to determine the thickness and lateral expansion of floating mats and peat (Loisel et al., 2013; Parsekian et al., 2011). Given the restricted distribution of floating mats, many participants considered advancement of mapping technologies for these features not to be essential, although a horizontal resolution of 1-5 m is desirable.
Hydrology
Surface water bodies. Many workshop participants noted that thermokarst lakes and ponds are important indicators of permafrost degradation. They cover very large regions and have a significant impact on hydrology, geomorphology, and biogeochemical cycling in permafrost lowlands (Grosse et al., 2012). Several studies have used Landsat imagery (~15-80 m spatial resolution) to investigate changes in thermokarst lake/pond areas and relate these to either permafrost degradation or changes in precipitation/evapotranspiration regimes (e.g., Arp et al., 2011; Hinkel et al., 2007; Kravtsova and Bystrova, 2009; Labrecque et al., 2009). Although Landsat data are demonstrated to be useful for general change detection of lakes, they are not as effective for studying shore-erosion rates, which are usually too small for Landsat pixel size. SAR satellite imagery have been successfully used to map the extent of open water and, if available over an extended time period, can be useful for monitoring the extent and changes of surface water (Whitcomb et al., 2009). Aerial photographs and high-resolution satellite time series (~2.5 m spatial resolution or better; e.g., SPOT panchromatic, Ikonos-2, GeoEye-1, QuickBird, WorldView-1 and -2) are more suitable and commonly used to assess local and regional changes in thermokarst lakes/ponds in greater detail, including lake disappearance from drainage or drying and lake expansion by thermal erosion (Jones et al., 2011; Westermann et al., in press). Satellite measurements of water depth from green LiDAR7 (e.g., Gao, 2009; Paine et al., 2013) and water level from near-IR LiDAR and radar altimeters (e.g., Crétaux et al., 2005; Paine et al., 2013) complement optical (Figure 2.6) and SAR observations of surface extent of lakes/ponds, but these have not been well explored to date. Workshop participants said that the future SWOT mission, to be launched in 2020, will provide invaluable data in this respect (e.g., Lee et al., 2010). The mission8 will produce a water mask able to resolve lakes of 250 m2 in size and will be able to retrieve water-level elevations with an accuracy of 10 cm.
In addition to water depth and water level, satellite imagery provides valuable information on shallow lakes (i.e., ~3 m or less) that freeze partially (i.e., sections) or entirely to their bed in winter. SAR data can be used to determine the areal extent and seasonal (i.e., wintertime) evolution of bedfast ice. Heat transferred
_______________
7 LIDARs designed for mapping underwater use a blue-green laser that can penetrate water and provide returns of underwater objects or the bottom.
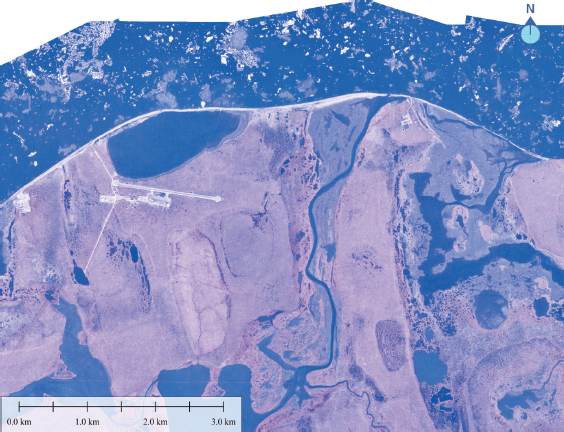
FIGURE 2.6 Historical optical data sets provide means for monitoring changing lakes near Lonely Air Force Station, Alaska. The source of the imagery is the Alaska High Altitude Aerial Photography (AHAP) program. The data were collected in July of 1979. SOURCE: Scott Arko, University of Alaska, Fairbanks.
from floating-ice lakes creates taliks. A shift from a bedfast-ice (i.e., frozen to bed) to a floating-ice regime can initiate talik development under the lake and potentially release large stocks of carbon previously frozen in permafrost in the form of methane (Arp et al., 2012). With Arctic climate warming, it is anticipated that a smaller number of lakes will freeze to their bed in winter because of a decrease in ice thickness (Surdu et al., 2013). Many workshop participants said that SAR data acquired at spatial resolutions of ~3-100 m and at weekly to monthly time scales are suitable for monitoring the evolution of floating ice and bedfast ice for lakes of various sizes.
Soil moisture. A significant terrestrial factor for controlling the surface energy balance after the presence or absence of snow cover is soil moisture. It is a major factor in permafrost aggradation and degradation because of the thermal properties of water and ice (Farouki, 1981). Soil moisture information is important for estimating the thermal properties of the ground needed for permafrost modeling. Information provided by SAR sensors is ideal for the spatial estimation or modeling of soil moisture at a range of different spatial scales. In contrast to passive microwave radiometers and scatterometers that provide surface soil moisture information at low spatial resolution (i.e., tens of km), some participants noted that SAR instruments (i.e., C, L, and P band; ~3-100 m resolution) are useful for medium- and large-scale analysis of soil moisture levels. However, there has been limited research to date on the estimation of relative or absolute surface soil moisture
and its spatial distribution from SAR in permafrost regions. At subcatchment and finer scales in particular, the spatial patterns (e.g., heterogeneity, or relative spatial variations) of soil moisture become as or more important than the absolute value of the soil moisture at every point.
Many participants indicated that spaceborne or airborne microwave instruments that provide weekly acquisitions at spatial resolutions of 100 m or better and have a vertical sensitivity to the top 10 cm of the soil moisture profile (i.e., vertical resolution) would meet most user requirements. However, determination of soil moisture to greater depths (i.e., ~1 m into the ground; the top of the permafrost table) would be of even greater value to the permafrost community. SAR instruments operating at L-band and higher frequencies are best suited for the retrieval of surface soil moisture down to about 5 cm (Ulaby et al., 2013); those at P band or lower have the capability to penetrate deeper and allow retrievals of the soil moisture profile to depths of tens of centimeters or even more than 1 m, depending on soil texture composition and moisture content (Ulaby et al., 2013). No available P-band SAR instruments are operating from space, and the higher frequency spaceborne SARs have only sporadically been used for soil moisture retrievals. The upcoming NASA Soil Moisture Active/Passive (SMAP) mission (Entekhabi et al., 2010) is the first combined radar-radiometer spaceborne instrument set with the primary goal of mapping global distributions of soil moisture, including those in permafrost ecosystems (Figure 2.7). The SMAP soil moisture products will be at 3-, 9-, and 36-km scales, necessitating further disaggregation to arrive at higher resolution products. Airborne P-band radars, such as the AirMOSS system, are demonstrating the strong utility of such sensors for the retrieval of soil moisture profiles over a wide range of biomes at high resolutions (i.e., 90 m or better) and are expected to be highly suitable for doing the same over permafrost regions (Figure 2.8).
Some participants also indicated that the TIR (thermal infrared) instrument, which is planned as part of NASA’s HyspIRI mission, would be useful for mapping surface soil moisture at medium resolution.
Subsurface water (storage and flow). Several recent studies have shown a relationship between mass change as detected by the Gravity Recovery and Climate Experiment (GRACE) satellite mission and changes in terrestrial water storage (TWS) in the catchments of large Arctic rivers (Muskett and Romanovsky, 2009, 2011). In the Lena River basin, for example, observed TWS increase has been attributed to an increase in subsurface water storage between 2002 and 2010 (Velicogna et al., 2012). Missions such as GRACE may therefore allow a direct quantification of large-scale changes of the water balance triggered by permafrost thaw (Westermann et al., in press).
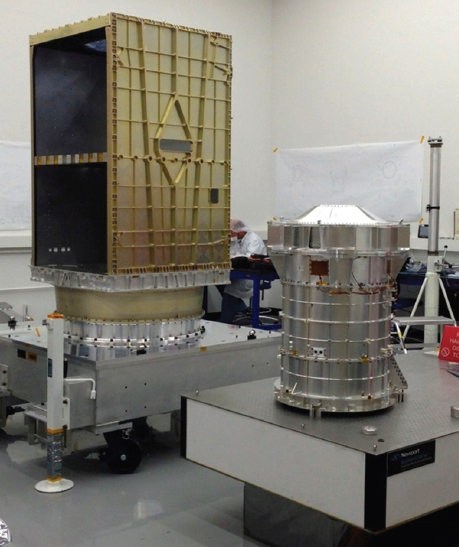
FIGURE 2.7 Image of the SMAP spacecraft structure. SOURCE: Presented by Dara Entekhabi.
Water temperature. Lake water temperature influences talik development, thermal erosion, and ultimately surface permafrost degradation (Arp et al., 2010). Water temperature can be measured in situ with a radiometer that records “skin” temperature or, as done more frequently, using either a temperature sensor deployed just below the water surface or a set of temperature sensors installed on a chain for temperature measurements along a depth profile. Thermal sensors aboard airborne and satellite platforms provide measurements of surface
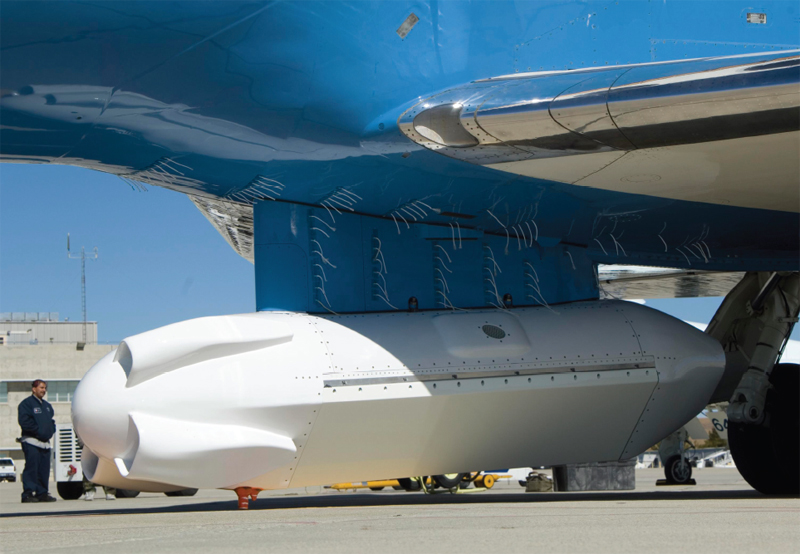
FIGURE 2.8 The AirMOSS sensor is located within the pod under the NASA Gulfstream III. SOURCE: Mahta Moghaddam, Principal Investigator, on behalf of AirMOSS EV-1 mission team.
“skin” water temperature or ice/snow temperature when ice cover is present on a lake. Current satellite sensors such as AVHRR and MODIS offer wide spatial coverage and high temporal resolution (twice daily or better) but sacrifice spatial resolution (~1 km), which allows the surface water temperature of only the largest lakes to be monitored. Landsat and the ASTER thermal sensors provide a better spatial resolution (i.e., ~100 m) than MODIS and AVHRR, but they have much reduced temporal sampling (e.g., Landsat only about once a week at best at high latitudes under clear sky conditions). In order to monitor the temperature of water bodies in permafrost regions (e.g., thermokarst lakes), satellite acquisitions with spatial resolutions of the order of ~30-100 m and daily revisits would be optimum. Participants discussed the Japanese satellite GCOM-C, which will be launched in the near future (2014) and will provide surface water temperature observations at 500 m spatial resolution that will allow for monitoring of lakes smaller than currently possible with AVHRR and MODIS.
Vegetation and Land Cover
Vegetation properties (e.g., cover, composition, structure, biomass) and processes (e.g., productivity) are important for permafrost research and mapping applications as indicated by several participants, because they provide essential indicators of permafrost presence (or absence), surface hydrology, and other key variables (e.g., surface temperature, snow cover and depth, active layer dynamics). The properties discussed below are useful for permafrost mapping applications.
Land cover. Vegetation characteristics and land cover are critical to assessing active layer and permafrost dynamics because they affect the surface energy budget, soil organic matter and thermal properties, evapotranspiration and water balance, and snow cover (Jorgenson et al., 2010). Numerous vegetation properties and processes have been remotely sensed using optical, radar, and LiDAR approaches, and there is extensive literature on sensors and methods (Belshe et al., 2013; Jones and Vaughan, 2010). Many aircraft instruments are suitable for vegetation mapping, including LiDAR, radar instruments, and even multifrequency digital camera mapping systems. Similarly, several space-based satellite missions are relevant to vegetation mapping, ranging from multiresolution optical sensors on a wide range of platforms (e.g., QuickBird, SPOT, Landsat, MODIS, AVHRR) to various radar missions (e.g., ALOS, ENVISAT, RADARSAT). Although participants noted that there is no single best system to map vegetation, a great deal has been accomplished in support of vegetation classification schemes relevant to permafrost landscapes using optical imagery alone, from simple classification schemes focused on structure (Selkowitz and Stehman, 2011) to ecologically diverse schemes (Jorgenson et al., 2009). Landsat and higher resolution imagery are particularly useful in this regard. The synergistic use of optical, radar, and optical remote sensing can provide a range of advantages in measuring some of the other desired vegetation variables (Selkowitz et al., 2012).
Vegetation structure and composition. Vegetation structure and composition are measured by height, species or lifeform density, leaf area index, and species biomass or cover, and they are important both to the surface energy balance and as indicators of permafrost degradation (Trucco et al., 2012). Optical imagery has been frequently used to produce vegetation indices related to productivity, particularly the Normalized Difference Vegetation Index (NDVI), to assess areas of change in Arctic and boreal regions (Beck et al., 2011b; Verbyla, 2008). Higher resolution time series of systematic vegetation indices would be useful for linking productivity changes to variability in permafrost properties decoupled from more regional-scale climate change, including those induced by fire disturbance. Coupling these higher resolution image series with LiDAR would be particularly useful for observing changes in vegetation structure and composition (e.g., Goetz et al., 2012; Wulder et al., 2007). Many workshop participants indicated that a vertical resolution of 5 cm and a horizontal resolution of 10-30 m are desirable.
Biomass. Biomass affects energy balance and soil carbon dynamics that are important to permafrost, and techniques for remotely sensing biomass are well developed (Frolking et al., 2009). Biomass has been estimated in permafrost environments with Landsat imagery (Ji et al., 2012), MODIS (Blackard et al., 2008), AVHRR (Raynolds et al., 2012), SAR (Thurner et al., 2013), InSAR (Solberg et al., 2013), and airborne and spaceborne LiDAR (Neigh et al., 2013). Estimation using multisensor approaches synergistically helps to overcome the limitations of each of these systems used independently (whether due to inadequate LiDAR sampling, surface moisture effects in radar backscatter, or pervasive cloudiness in optical imagery). Biomass indices in particular have proven to be significant factors in spatial modeling of permafrost properties (Pastick et al., 2013).
Disturbance. Fire, geomorphic processes, and human activities affect active layer and permafrost dynamics by altering the surface microclimate related to vegetation, the organic-layer properties, and surface hydrology (Brown and Grave, 1979; Yoshikawa and Hinzman, 2003). Fire is of particular importance because it is widespread in boreal ecosystems and becoming more frequent, even in tundra ecosystems (Kasischke et al., 2010). Fire severity, which affects recovery patterns and depth of organic-layer combustion, is critical to assessing permafrost response (Harden et al., 2006; Nossov et al., 2013). A number of remote sensing indices using Landsat imagery have been used to quantify fire severity (Hoy et al., 2008). Recently, fire boundaries were used in spatial modeling to map active layer depths and permafrost distribution in central Alaska (Pastick et al., 2013). Landsat imagery, which now includes the operational Landsat 8, provides adequate resolution, coverage, and frequency to assess the relationship of fire disturbance and permafrost stability.
The primary planned future sensors that will be useful for vegetation mapping include the U.S.
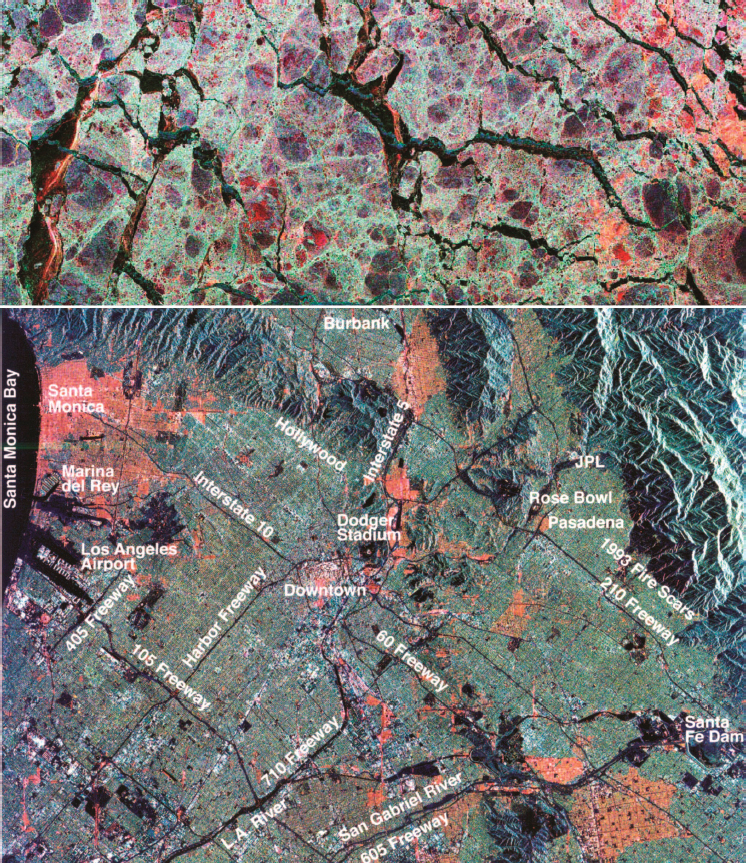
FIGURE 2.9 Images of the Weddell Sea, Antarctica (top) and Los Angeles (bottom), were acquired by the Spaceborne Imaging Radar-C/X-Band Synthetic Aperture Radar (SIR-C/X-SAR) onboard the space shuttle Endeavour. These images highlight the potential benefits of future L-band and S-band sensors for advancing permafrost research. For example, a combination of simultaneous S-band and L-band data would be extremely powerful for discriminating differential scales. Greater available bandwidth at S-band than at L-band could enable focus on some areas at finer resolution. Colors are assigned to different radar frequencies and polarizations as follows: red is L-band horizontally transmitted, horizontally received; green is L-band horizontally transmitted, vertically received; and blue is C-band horizontally transmitted, vertically received. SOURCE: NASA.
L-band InSAR mission (Figure 2.9), the series of European Sentinel missions, and the Japanese ALOS-2 PALSAR and GCOM-C missions, among others. The utility of the photo counting ATLAS sensor planned for ICESat-2 for vegetation mapping is currently uncertain because of the very few photons returned within any given fine-scale grid cell. A future LiDAR mission to provide coincident vegetation cover, structure, and other high-resolution surface variables, such as subcanopy topography, is considered desirable by many workshop participants.
Greenhouse Gases
In the climate research community, much of the concern about changes in permafrost actually relate to its role in the global carbon cycle, including uncertainty about whether permafrost-dominated regions will become net sinks or sources of greenhouse gases as permafrost thaws. A number of workshop participants said that the importance of these issues means that satellite measurements of carbon dioxide (CO2), methane, and water vapor should be a top priority. Measurements of CO2 and/or methane have been made with the JAXA GOSAT (still flying as of November 2013) and the ESA SCIAMACHY (mission now over) satellites/sensors, as well as via aircraft (NASA’s CARVE and other programs; Zulueta et al., 2011) and ground-based towers. A number of future carbon sensors are proposed by NASA and other agencies that, if built, will have the appropriate resolution to detect changes in carbon fluxes from thawing permafrost (100 m to 1 km).
Methane fluxes. Methane fluxes in surface water bodies can also be inferred from bubbles trapped in lake ice covers, which can be detected by C- and L-band SAR from satellite or aircraft (Engram et al., 2012; Walter et al., 2008). U.S. researchers, however, have limited access to RADARSAT-2 data, the only current C-band SAR in orbit. Historical data from RADARSAT-1, ERS-1 and -2, Envisat ASAR, and ALOS-1 are still valuable for research. As discussed at the workshop, ALOS-2 may provide useful L-band data for methane detection in lake ice after it is successfully launched.
Water vapor. Another important greenhouse gas related to permafrost is water vapor. Clouds are ubiquitous in Arctic imagery and are monitored in detail by the meteorological satellites in the GOES and POES series. Passive microwave sensing is used to detect water in its vapor form before it has condensed into clouds. The origin of water vapor can, like carbon, be traced to some extent using isotopes. Deuterium is measured by the Tropospheric Emissions Spectrometer onboard the Aura satellite and can be used to trace the large-scale movement of water vapor parcels, globally. Water vapor isotopes have also been successfully measured in situ from aircraft and towers. Current product resolutions probably suffice for remote sensing of large-scale water vapor; however, estimates of water vapor fluxes between permafrost-dominated landscapes and the atmosphere in the form of evapotranspiration are limited to a few in situ measurements.
Carbon storage. Indications of changes in carbon storage can include vegetation change leading to “greening” and “browning” trends, as seen in measures such as NDVI. The pixel resolution for NDVI depends on the sensor that is being used: derived from Landsat it is tens of meters and from MODIS 500 m. Changes in vegetation type that may affect carbon budgets (such as shrub expansion) are likely occurring on scales of 1-10 m per decade, suggesting that Landsat ETM may be a better source for NDVI for this application. On the other hand, MODIS’s daily repeat cycle makes it better for looking at seasonal shifts in larger-scale NDVI. Workshop participants indicated that an ideal sensor would have a daily repeat cycle with 1-10 m horizontal resolution.
13C and 14C. The question of carbon source region and age are best answered by 13C and 14C isotopes, which are currently not measured by satellite but more typically through lab analysis of in situ samples. This would be a useful measurement from remote sensing, but according to many workshop participants would be less so than carbon flux measurements.
The workshop discussion focused on analysis of existing sensors or those on the horizon rather than the development of new analytical methods utilizing existing data. However, assimilation of multiple
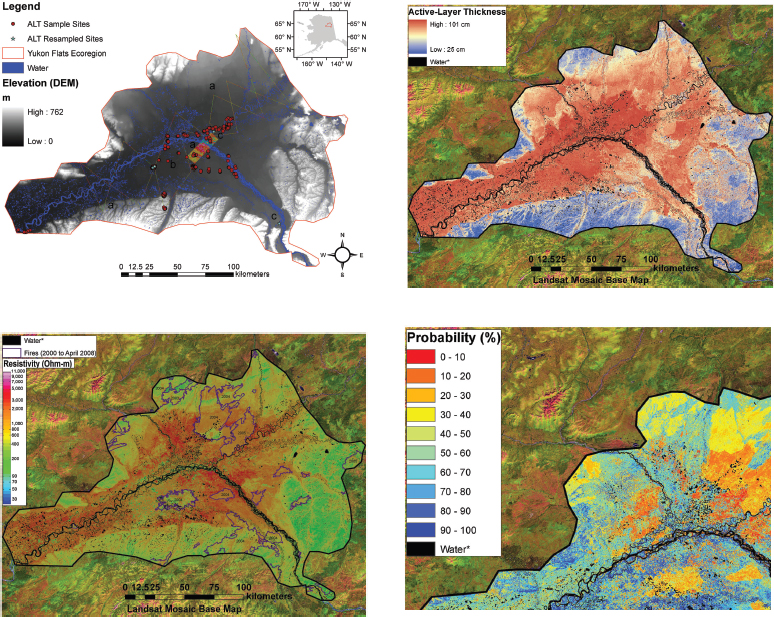
FIGURE 2.10 Shallow AEM data (top left) combined with satellite and auxiliary data sets to extrapolate near-surface resistivity (top right); predict ALT (bottom left); and estimate probability of shallow permafrost (bottom right). SOURCE: Pastick et al., 2013.
data sources for creation of new products could help to address some of the information gaps. Several participants noted that the fusion of remotely sensed data from multiple sensors, field measurements, and improved temporal and spatial modeling is essential to making progress in mapping permafrost and detecting change (Figure 2.10). Because permafrost responds to a wide range of ecological factors and is covered by surface vegetation and by soil within the active layer, it is increasingly apparent that no single sensor is capable of reliably mapping permafrost properties.
Although AEM shows substantial capabilities and ongoing innovations are promising, data acquisition and processing are intensive and costly, thereby limiting their use to local-scale mapping projects (Minsley et al., 2012). AEM data can be spatially extrapolated through multiparameter data fusion approaches incorporating Landsat imagery, DEM and terrain modeling, and surficial geology (Pastick et al., 2013). Approaches using large data stacks and multiparameter fusion, said some participants, should be extended to include remotely sensed field-calibrated SAR-derived surface soil moisture and active layer freeze thaw, SAR and optically derived snow properties, optically derived vegetation indices and vegetation classification, LiDAR-derived vegetation structure and topographic-moisture indices,
spatial extrapolation of soil surface-organic-matter field data, and optically derived fire indices. The data can be fused through both empirical multivariate analyses (Mishra and Riley, 2012; Panda et al., 2012; Pastick et al., 2013) and processes modeling ground thermal regimes (Jafarov et al., 2012; Marchenko et al., 2008). Many workshop participants noted that incorporation of field and remotely sensed data to parameterize the process models will improve the temporal response and spatial resolution of input variables.
However, numerous participants indicated that a critical gap remains in landscape- to local-scale mapping of surficial geology, because substantial areas are mapped at only small regional scales, and most of the mapping is outdated with poor spatial accuracy that is incompatible with remotely sensed data. This mapping of subsurface materials and stratigraphic relations is critical for modeling subsurface thermal characteristics (Jafarov et al., 2012), mapping the distribution of ground ice (Jorgenson et al., 2008; Kanevskiy et al., 2011; Kreig, 1977), and understanding the patterns and processes of thermokarst (French and Shur, 2010; Jorgenson et al., 2013). Because remote sensing and automated mapping of surficial geology currently is not possible, it will require a substantial effort to compile field data from surficial geology investigations, compile and digitize existing mapping with updated concepts, and create new maps for extensive unmapped regions.
TABLES 2.1 AND 2.2 APPEAR ON THE FOLLOWING PAGES.
TABLE 2.1 Direct and Indirect Remote Sensing of Permafrost Properties and Processes
|
|
|||||||
| What variables need to be measured to study permafrost? | What remote sensing techniques can make these measurements? | ||||||
|
|
|||||||
| Permafrost properties and processes | Ecological indicators of this property | Current systems that can measure this property | Current systems that can measure ecological indicators | Prototype sensors and future possibilities | What spatial and temporal resolutions are available (including coverage) | What spatial and temporal resolutions are needed (including coverage) | Relevant references |
|
|
|||||||
| PERMAFROST | |||||||
|
|
|||||||
| Active layer thickness | Seasonal heave/subsidence Physical changes within the active layer (including seasonal thawing and seasonal freezing) | AirMOSS (P-band SAR) UAVSAR (L-band InSAR) Airborne-EM OIB low-frequency radars | AirMOSS (P-band SAR) UAVSAR (L-band InSAR) | Multiband InSAR with LiDAR (as a correlate) Surface and airborne GPRs AirMOSS (P-band SAR) in InSAR mode; simultaneous AirMOSS+UAVSAR (P- and L-band SAR) SPOT 1, HRV, MLA, AVHRR | LVIS airborne LiDAR: 3 m horizontal resolution UAVSAR: 10 m horizontal resolution and cm-level subsidence sensitivity AirMOSS: 30 m horizontal resolution and 5-10 cm vertical sensitivity AVHRR: 1 km | Vertical resolution: 5 cm Horizontal resolution 30 m Biweekly (except in winter) Current is adequate, especially if used in combination | Hubbard et al., 2013; McGuire et al., 2002; Minsley et al., 2012; Pastick et al., 2013; Peddle and Franklin, 1993 |
| Ground ice (volume and morphology) |
Thermokarst landforms Surface topography/subsidence Dynamics of thermokarst lake margins Lakes bathymetry Surficial geology/landforms | GPR | Quickbird, IKONOS, CORONA Airborne and space-based LiDAR High-resolution optical and SAR Declassified imagery | Direct detection of ground ice, remote sensing GPR, OIB Radars Some sort of fusion sensor system; e.g., resistivity and hyperspecral AEM EM modeling OIB Radars Airborne InSAR | 1-10 m (commercial satellite) up to daily demand <1 m airborne SAR and GPR on demand | 1-10 m is sufficient Vertical: <0.5 m 1 m with InSAR is achievable and would be useful Annually Need to clearly define the application (e.g., engineering, ecological) | Grosse et al., 2005; Jones et al., 2011; Kreig, 1977; Sannel and Brown, 2010; Yoshikawa et al., 2006 |
| Subsurface soil temperature |
Land cover type (weakly linked) | None | None | Something that provides profile temperature, subsurface sampling down to depth of 0 annual amplitude Low-frequency radiometers | N/A | N/A | |
| Permafrost presence/ absence |
Land surface temperature Vegetation Landform | EM AEM | Thermal and passive microwave Various optical | Space and airborne radars | Annually | Local 1-10 m Circumpolar 100 m Annually | Minsley et al., 2012; Panda et al., 2010 |
| Depth to top of permafrost | Poorly understood | AEM EM modeling Multifrequency airborne low-frequency radars (OIB) | None | Low-frequency ultra-wideband radars | None | Local 1-10 m Circumpolar 100 m Annually | Annan and Davis, 1976; Arcone et al., 1998; Brosten et al., 2006; Rodriguez-Morales et al., 2013 |
| Near-surface seasonal freeze/thaw state | Presence/absence of liquid water Seasonal heave/subsidence Plant phenology Presence of snow | InSAR, repeat LiDAR, RADARSAT Tomographic SAR AEM GPR Times series of radar/radiometer SMAPa | NASA aircraft SARs UAVSAR, AirMOSS Spatial extrapolation based on vegetation coverage Higher frequency passive and active | High-frequency repeat satellite LiDAR. InSAR ALOS2, NASA L-band SAR (former DESDynI)b space based & airborne GPR & EM multifrequency active passive microwave sensors | UAVSAR: 10 m AirMOSS: 30 m SMAP: 3 km to 36 km (3-day repeat) ALOS2: 15-30 m (~2-3-week repeat) | 10 min in every 10 days Vertical: 5-10 cm Subsidence < 1cm Local: 1 m Circumpolar: 100 m | Park et al., 2010 |
| Permafrost thickness and 3D geometry | Lakes Land cover type (weakly linked) | AEM GPR(VHF and UHF) Tomographic SAR in VHF and P-band | Any optical sensors | Satellite-based EM GPR P-band SAR OIB VHF and UHF radars | Horizontal: 50-300 m Vertical: 2-20 m | Improved <2 m near-surface resolution Vertical: 10 m Horizontal: 10 m | Minsley et al., 2012 |
|
|
|||||||
a Proposed launch date for late 2014 (NRC, 2012).
b No proposed launch date, but the NRC recommended a 2010-2013 launch time frame (NRC, 2012).
TABLE 2.2 Direct and Indirect Remote Sensing of Permafrost-Related Ecological Variables
|
|
|||||||
| What variables need to be measured to study permafrost? | What remote sensing techniques can make these measurements? | ||||||
|
|
|||||||
| Permafrost-related ecological variables | Ecological indicators of this variable | Current systems that can measure this variable | Current systems that can measure ecological indicators | Prototype sensors and future possibilities | What spatial and temporal resolutions are available (including coverage) | What spatial and temporal resolutions are needed (including coverage) | Relevant references |
|
|
|||||||
| CLIMATE | |||||||
|
|
|||||||
| Snow characteristics (extent, water equivalent, depth density, conductivity) | Vegetation structure Topography Climatic parameters Land cover type (weakly linked) | High-frequency (Ku) SAR backscatter Passive microwave (e.g., AMSR, SSM/I) GRACE, optical (extent) or optical/microwave combined InSAR, LiDAR Snowradar GPR | LiDAR Stereoimages D-InSAR, extrapolation GPS (signal delay), optical/microwave combined Spatial extrapolation SNOTEL | Ultra wideband radar High-frequency/multifrequency SAR (e.g., CoReH2O) GRACE-FOa New optical sensors (extent) | Airborne ~1 m Passive microwave ~25 km Daily | Horizontal: 1-50 m Daily | Derksen et al., 2003; Hall and Riggs, 2007; Hancock et al., 2013; Kelly et al., 2003 |
| Land surface temperature | Snow Plant phenology (longer time scales) | AMSR and SSM/I (snow-free conditions) MODIS SNPP Aircraft AVHRR Landsat ASTER airborne HyspIRI | Landsat AVHRR and MODIS continuation Sentinel-3 GCOM-C HyspIRI satelliteb | Horizontal resolution: 90 m ASTER 100 m Landsat-8 1 km MODIS/AVHRR 25 km AMSR and SSM/I Twice monthly to daily | Horizontal: 30-100 m Daily | Hachem et al., 2009; Jones et al., 2010; Kimball et al., 2009 |
|
| Meteorology (including air temperature, precipitation, winds) | Land cover Topography (longer time scales) | GOES POES AIRS on Aqua CrIS on SNPP AMSR | N/A | Continuation of meteorological satellite constellations Improve measurement of solid precipitation | Horizontal: 500 m to 100 km Hourly to daily | Horizontal: 50 m to 1 km Hourly to daily | Liu et al., 2006; Revercomb et al., 2013 |
| Global Precipitation Measurement (GPM) mission (2014) | |||||||
|
|
|||||||
| TOPOGRAPHY | |||||||
|
|
|||||||
| Surface topography (static, macro-, and micro-) | Land cover type Drainage patterns Water bodies Landforms Patterned ground | LiDAR Tandem-X (World DEM) LiDAR/SAR synergy | Various/multisensor | US L-band SAR DLR-JAXA Tandem-L (proposed) ICESatc-ATLAS | Vertical: <15 cm Horizontal: 1 m | Horizontal: <1 m Vertical: 5-10 cm Snow free: yearly | Bowen and Waltermire, 2002; Jones et al., 2013 |
| Longer-term surface subsidence | Land cover type Drainage patterns Water bodies Landforms Patterned ground | LiDAR Tandem-X (World DEM) LiDAR/SAR synergy | Various/multisensor | US L-band SAR DLR-JAXA Tandem-L (proposed) ICESat-ATLAS | Vertical: <15 cm Horizontal: 1 m | Horizontal: 1 m Vertical: 1-10 cm Snow free: yearly | Chen et al., 2013; Liu et al., 2012 |
| Thermokarst distribution | Long-term surface subsidence Thermokarst landforms Thermo-erosional features and slope failures Land cover type, water bodies Drainage patterns Patterned ground | Airborne LiDAR High-resolution optical Time series of SAR and InSAR images AEM | Various/multisensor | US L-band SAR DLR-JAXA Tandem-L (proposed) ICESat-ATLAS | Vertical: <15 cm Horizontal: 1 m | Horizontal: 1 m Vertical: 1-10 cm Snow free: yearly | Jones et al., 2012 |
| Seasonal heave/subsidence | Patterned ground Infrastructure damage | LiDAR InSAR | Various/multisensor | US L-band SAR ESA Tandem-L ICESat-ATLAS | Vertical: <15 cm (airborne) Horizontal: 1 m | Vertical: 5-10 cm Subsidence < 1cm Local scale: 1 m Circumpolar: 100 m per decade | Short et al., 2011 |
|
|
|||||||
|
|
|||||||
| What variables need to be measured to study permafrost? | What remote sensing techniques can make these measurements? | ||||||
|
|
|||||||
| Permafrost-related ecological variables | Ecological indicators of this variable | Current systems that can measure this variable | Current systems that can measure ecological indicators | Prototype sensors and future possibilities | What spatial and temporal resolutions are available (including coverage) | What spatial and temporal resolutions are needed (including coverage) | Relevant references |
|
|
|||||||
| GEOLOGY AND SOIL | |||||||
|
|
|||||||
| Surficial geology-terrain units (including lithology, bedrock) | Topography Vegetation Drainage patterns Landforms | AEM GPR | Photo-interpretation of stereo airphotos and satellite imagery (e.g., Quickbird, Ikonos) Stereo-photogrammetry LiDAR | ALOS-2 Stereo capability Color CIR, Airborne GPR | <1 m for airphotos <1 m panchromatic and color satellite Horizontal: ~50-300 m Vertical: ~2-20 m | Local scale: 1-5 m Circumpolar: 100-1000 m | Catapano et al., 2012; Kreig and Reger, 1982; Minsley et al., 2012; Moorman et al., 2003; Mulder et al., 2011; Rawlinson, 1993; Siemon, 2006 |
| Soil organic layer (thickness, moisture, conductivity) | Topography Vegetation Drainage patterns landforms | GPR EM resistivity Induced Polarization Imaging | Spatial extrapolation from soil cores (data fusion Landsat, ASTER, DEM etc.) LiDAR | Space borne, airborne sensor (like GPR) | <1 m for GPR 30-250 m resolution for optical satellites | Vertical: 5-10 cm pre- and post- disturbance | Gomez et al., 2008; Jarmer et al., 2010; Johnson et al., 2013; Laamrani et al., 2013; Mishra, 2013; Rosa et al., 2009; Slater and Reeve, 2002 |
| Moss layer (thickness moisture content, thermal conductivity) | Vegetation type Topography Drainage patterns Landforms | N/A | AVIRIS CASI AMSR E/2 LiDAR | HYspIRI | 1-5 m airborne | Vertical: 5-10 cm pre- and post- disturbance (LiDAR, InSAR) | Bubier et al., 1997; Lucieer et al., 2012 |
| Permafrost carbon (deep frozen organic matter) | Surficial geology Landforms Vegetation Carbon isotopes | N/A | Spatial extrapolation from soil cores (data fusion Landsat, ASTER, DEM etc.) | Not discussed | 100-1000 m | 1-5 m local scale, 100-1000 m circumpolar | Jorgenson et al., 2013; Mishra, 2013; Ping et al., 2011; Tarnocai et al., 2009 |
| Soil physical characteristics (composition, structure, density, texture) | Surficial geology Topography Vegetation Drainage patterns | AEM | Spatial extrapolation from soil cores (data fusion Landsat, ASTER, DEM etc.) Hyperspectral AVIRIS | Not discussed | 1-5 m (airborne) | Local scale: 1-5 m, Circumpolar: 100-1000 m | Anderson and Croft, 2009; Barnes et al., 2003; Browning and Duniway, 2011; Hively et al., 2011; Morris et al., 2008; Mulder et al., 2011 |
| Unfrozen/saline water mapping | Vegetation Topography | AEM | Optical spectral mapping of salt tolerant vegetation (Landsat, Ikonos) | Not discussed | Horizontal: 50-300 m Vertical: 2-20 m (for AEM) | Improved <2 m near-surface resolution | Corwin, 2008; Farifteh et al., 2006; Fitterman and Deszcz-Pan, 1998; Paine and Minty, 2005 |
| Floating mats in water bodies (depth, width) | Water bodies Topography Vegetation type | Ground GPR | High-resolution optical satellite sensors Airphotos Hyperspectral | HYspIRI | 1-5 m | Local scale: 1-5 m not applicable to circumpolar scale | Cho et al., 2008; Jorgenson et al., 2012; Loisel et al., 2013; Parsekian et al., 2011 |
|
|
|||||||
| HYDROLOGY | |||||||
|
|
|||||||
| Surface water bodies (including dynamics, redistribution) | Lake/ponds ice thickness Change in depth and extent of the water bodies on the land surface (lakes, other bodies) Lake drainage Changes in wetlands distribution | High to low resolution optical (e.g., GeoEye/IKONO, QuickBird, WorldView, Landsat, SPOT, MODIS) SAR, green LiDAR (water depth), NIR, LiDAR , and radar altimetry (wáter level) SRTM (lake drainage) | High to low resolution optical (e.g., GeoEye/IKONOS, QuickBird, WorldView, Landsat, SPOT, MODIS) SAR, green LiDAR (water depth), LiDAR SRTM (lake drainage) | Continuation of high-resolution optical and SAR, SWOT,d Air-SWOT, HyspIRI | Horizontal: 0.5 m to 1 km Daily to monthly | Horizontal: Current spatial is sufficient Weekly | Arp et al., 2011; Hinkel et al., 2007; Kravtsova and Bystrova, 2009; Labrecque et al., 2009; Lee et al., 2010; Paine et al., 2013 Continued |
|
|
|||||||
| What variables need to be measured to study permafrost? | What remote sensing techniques can make these measurements? | ||||||
|
|
|||||||
| Permafrost-related ecological variables | Ecological indicators of this variable | Current systems that can measure this variable | Current systems that can measure ecological indicators | Prototype sensors and future possibilities | What spatial and temporal resolutions are available (including coverage) | What spatial and temporal resolutions are needed (including coverage) | Relevant references |
|
|
|||||||
| Soil moisture | Surface soil moisture dynamics Soil moisture profile dynamics Depth of thawed layer Vegetation for spatial patterns DEM topographic indices for broad patterns | AirMOSS, AIRSAR (P- and L-band SAR, but obsolete) AMSR-E/2 C-band SAR Landsat SMOS PALS ASCAT, ASAR, SAR backscatter, microwave emission | UAVSAR, AirMOSS AirMOSS LST and NDVI |
AirMOSS Combination of AirMOSS and UAVSAR (simultaneous P- and L-band SAR) Multifrequency radiometer NASA L-band SAR Mission (former DESDynI) GCOM-W (Global Change Observation Mission-Water) L-Band sensor SWOT HYspIRI | Potentially 3 m to 30-100 m resolution Airborne instrument, so any temporal resolution is possible Depth of sensing is expected to reach 50-100 cm with P-band SAR (AirMOSS) Pan-arctic 25 km MODIS NDVI daily ~500 m, Worldview2 NDVI, 1-10 m daily on demand, NASA aircraft SARs L-Band is coming on-line (limited penetration) | Local to regional scale: 1 m horizontal, daily Circumpolar: 100 m horizontal, weekly Vertical: 10 cm depth minimum; ideally to top of permafrost | Moghaddam et al., 2000; Liu et al., 2011; Tabatabaeenejad et al., in review; Tabatabaeenejad and Moghaddam, 2011 |
| Subsurface water (storage and flow) | Drainage patterns Vegetation | GRACE GPS | GRACE-FO | Horizontal: : ~400 km Every 10 days | Muskett and Romanovsky, 2009, 2011; Velicogna et al., 2012 | ||
| Water temperature | Water bloom Ice cover | MODIS SNPP Aircraft AVHRR Landsat ASTE airborne HYspIRI | AMSR and SSM/I (snow-free conditions) MODIS SNPP Aircraft AVHRR Landsat ASTE airborne HYspIRI | Landsat AVHRR and MODIS continuation Sentinel-3, GCOM-C HYspIRI satellite | Horizontal: 90 m (ASTER); 100 m (Landsat-8) 1 km (MODIS/AVHRR) Twice monthly to daily | Horizontal: 30-100 m Daily | Arp et al., 2010; Kheyrollah Pour et al., 2012 |
|
|
|||||||
| VEGETATION AND LAND COVER | |||||||
|
|
|||||||
| Land cover (including spectral vegetation indices) | Vegetation type Water bodies Land use Dying forests NDVI (incl. dynamics ) | Multispectral SAR Optical | Multispectral SAR Optical | Hyperspectral sensor High-resolution optical and SAR imagers | 0.5 m (panchromatic) and above (WorldView2) | Current spatial is sufficient | Jones and Vaughan, 2010; Jorgenson et al., 2009; Selkowitz and Stehman, 2011 |
| Vegetation structure and composition | Height Density LAI Species type | Aircraft LiDAR; SAR Optical (composition) | Hyperspectral | US L-band SAR DLR-JAXA Tandem-L (proposed) GCOM-C (composition) | Vertical: 15 cm (airborne) Horizontal: 1 m | Vertical: 5 cm Horizontal: <1 m; 10-30 m annual | Beck et al., 2011a; Goetz et al., 2010 |
| Biomass (above ground) | Woody biomass Surface vegetation | Aircraft LiDAR SAR | Aircraft LiDAR SAR optical | US L-band SAR DLR-JAXA Tandem-L (proposed) | <1 m airborne <30 m satellite | Current spatial is sufficient seasonal | Blackard et al., 2008; Ji et al., 2012; Neigh et al., 2013; Raynolds et al., 2012 |
| Disturbance (including history) | Metrics (e.g., severity) Fire, humans, flooding, insects | Optical Aircraft LiDAR SAR | Aircraft LiDAR SAR optical | Hyperspectral sensor High-resolution optical and SAR imagers | 0.5 m (panchromatic) and above (WorldView2) | Current spatial is sufficient annual | Epting et al., 2005; Goetz et al., 2007; Hoy et al., 2008; Kasischke et al., 2010 |
|
|
|||||||
| GREENHOUSE GASES | |||||||
|
|
|||||||
| Methane (flux or concentration) | Vegetation Water bodies Lake ice | Airborne measurements (FTS) GOSAT SCIAMACHY (no longer in use) C-band SAR (methane trapped in ice) | C- and L-band SAR (bubbles) | OCO-2, OCO-3 FLEX (proposed) CarbonSat (proposed) Sentinel 5 precursor (proposed) | C-band SAR (30 m); L-band SAR (10 m); GOSAT, SCIAMACHY, OCO (>100 m ) | 100 m to 10 km | Engram et al., 2012; Walter et al., 2008 |
| Water vapor flux | Vegetation Water bodies | Concentrations currently measured by satellite Water vapor isotopes | Concentrations currently measured by MODIS, GOES, POES, SNPP in infrared and isotopes by TES | Probably need product development rather than new sensors, need follow on to TES | 10 km (model output) | 10 m to 1 km | Groves and Francis, 2002a, b |
|
|
|||||||
| What variables need to be measured to study permafrost? | What remote sensing techniques can make these measurements? | ||||||
|
|
|||||||
| Permafrost-related ecological variables | Ecological indicators of this variable | Current systems that can measure this variable | Current systems that can measure ecological indicators | Prototype sensors and future possibilities | What spatial and temporal resolutions are available (including coverage) | What spatial and temporal resolutions are needed (including coverage) | Relevant references |
|
|
|||||||
| CO2 (flux or concentration) | Vegetation Water bodies NDVI | Airborne measurements (FTS) GOSAT | Chlorophyll, NPP inferred from multispectral, Landsat, MODIS | OCO-2, OCO-3 FLEX (proposed) CarbonSat (proposed) Sentinel 5 precursor (proposed) | 1-100 m (imagery) 1-10 km (spectrometry) | 1-100 m (imagery) 100 m to 10 km (spectrometry) | Zulueta et al., 2011 |
| 13C and 14C isotopes | Surficial geology (from landforms, vegetation) | None | RGB (MODIS, Landsat, SNPP) | Spectrometer | 1-500 m (imagery only) | 100 m to 10 km | |
|
|
|||||||
a No planned launch date; NRC recommended a 2016-2020 launch time frame (NRC, 2012).
b Currently in the study stage; the NRC recommended a 2013-2016 launch time frame (NRC, 2012).
c Proposed launch date for 2016.
d No proposed launch date; NRC recommended a 2013-2016 launch time frame (NRC, 2012).


