
5
Project Descriptions: 21st Century Data
Many of the SciSIP researchers have found new ways to collect and analyze data. Technological innovations have made it possible for them to examine questions that may have been difficult to study previously, for example, by mining large bodies of data for patterns and trends and using maps and other visual displays to illuminate relationships. Researchers have also expanded the kinds of data that can be collected to permit adequate evaluation of policy initiatives.
DATA MINING AND INFORMATION EXTRACTION
Lee Giles, Pennsylvania State University
Lee Giles observed that a significant portion of the data being generated today is in the form of text documents, but these data are unstructured and difficult to mine. This material may include business and government reports, blogs, web pages, news, scientific literature, online reviews, and more. If it is to be managed, searched, mined, stored, and used, it must be extracted and given structure. Information extraction has become an active area of research, Giles explained, and software development companies have begun to focus on it.
Giles and his colleagues have worked on an open source online tool, called SeerSuite, that digital libraries and search engines can use to index and extract information.47 The tool uses algorithms to mine the Internet on a large scale and a variety of specific tools to improve the quality of information extraction. SeerSuite programs support research and are also used to train students in search and software systems. SeerSuite has been the basis for developing numerous additional Seers programs focused in particular areas. These include CiteSeer, ChemXSeer, ArchSeer, and CollabSeer, and others are under development or have been proposed. CiteSeer, which provides autonomous citation indexing, reference linking, full text indexing, and other features, has approximately 800,000 users, Giles noted, and covers approximately 3 million documents. CollabSeer recommends potential research collaborators based on characteristics of their previous work, and approximately 400,000 authors have participated. RefSeer recommends possible citations for a document related to a particular topic.
SeerSuite has tackled several key challenges in information extraction, Giles explained. A primary challenge is termed “disambiguation”—the difficulty of creating an automated system that can correctly deal both with multiple versions of the same name and with the prevalence of certain names. Part of the solution was the development of
________________
47See http://sourceforge.net/projects/citeseerx/ for more information [January 2014].
EthnicSeer, which uses sequences of characters and phonetic sounds to classify name ethnicity. ChemXSeer was developed to perform a similar function with respect to chemical names, and programs have also been developed to deal with tables, figures, and other data structures. Another challenge has been taking the programs to scale, and Giles explained that they have been beta tested and brought to scale with the collaboration of many researchers. The result is an infrastructure for the creation of academic and scientific specialty search engines and digital libraries that is easy to use and to apply to new domains.
THE U.S. PATENT INVENTOR DATABASE
Lee Fleming, University of California, Berkeley
Lee Fleming used an example to illustrate the problem his research has been designed to solve, showing examples of three separate U.S. patents that had been issued in the same name. The patent information indicates that these are three separate individuals, but such data overlap makes searching for and identifying needed information much more difficult. He and a group of colleagues from diverse fields have used a set of algorithms to develop a search engine that can efficiently extract information from the U.S. patent database. They have used a range of resources, including public databases, Google, and the National Bureau of Economic Research, to collect primary datasets to test their disambiguation engine.
Fleming and his colleagues have tested the engine’s capacity to learn in a variety of ways. Fleming closed with a few thoughts about the implications of this work for science and innovation policy. Non-compete rules tend to decrease the diffusion of people and ideas within regions, in his view. They drive the best people and ideas to regions that do not enforce them. Technology firms may favor them on the grounds that they provide a “hiring shield,” he noted, but ultimately they may fall behind because it is difficult for them to hire new workers with fresh ideas. There is active controversy about these rules, Fleming added: China has just weakened these rules, the state of Massachusetts is considering weakening them, and the state of Georgia has just strengthened them. He suggested that a cohesive and productive research community can best be supported by policies that:
- Preserve precedence while providing both ongoing and intermediate results;
- Build community assets, including source code, data, and published results; and
- Support high standards in code development.
Amy Pienta, University of Michigan
Amy Pienta and her colleagues used data on research awards in the social and behavioral sciences made by NSF and NIH to explore the influence of institutional
policies on data sharing for the value of investments in science. The database was developed under the auspices of the Inter-university Consortium for Political and Social Research (ICPSR) and allowed Pienta and her colleagues to review thousands of records. They also conducted a national survey of 1,499 principal investigators in the social sciences, achieving a 27.4 percent response rate.
They categorized the grants awarded in the social sciences by NSF and NIH between 1985 and 2001 in terms of the degree of data sharing involved, flagging them as having used archived data, having informally shared data, or not having shared data. Combining this information with data about researchers’ characteristics allowed Pienta and her colleagues to draw observations. For example, they found that there was variety across disciplines and institution types in willingness to share data. Economists and political scientists reported the most data sharing, while psychologists shared the least, Pienta noted. Tenured faculty members were more likely than others to archive their data, but non-tenured faculty did more informal sharing. Other individual characteristics showed fewer significant differences, she added, but investigators at private research organizations were the most successful at sharing data, especially informally.
The researchers who responded to the survey reported perceiving a variety of barriers to sharing their own data. The most frequently cited reasons were not having adequate time to prepare the data, finding it difficult to prepare documentation, and concern about protecting the confidentiality of research subjects. They also cited concern about the possibility that others would misinterpret the data or publish work based on it before they did. Some also thought others would not be interested in the topic. The two least frequently cited reasons were that language in their informed consent documentation prevented sharing, or that their institutional review board would not allow it.48
Catherine Eckel, Texas A&M University
Catherine Eckel and her colleagues explored the practical application of a policy tool by collecting data on the implementation of a federal policy, the Weatherization Assistance Program (WAP), in one Texas site.49 WAP is designed to help low-income families improve the energy efficiency of their homes; it provides funds to states, which distribute them to a network of local governments, agencies, and organizations. The program supports activities such as an audit of a home’s energy efficiency, installation of approved weatherization measures (e.g., caulking and insulation), and repair or replacement of inefficient heating or cooling systems.
Eckel and her colleagues used WAP data from Fair Park, a community in Dallas that is 70 percent African American and 26 percent Hispanic. The median annual household income is near the federal poverty line, and 50 percent of households that participated in the study have income below the poverty line.
Eckel and her colleagues collected baseline data on energy usage before the program was initiated in Fair Park. They also conducted a built environment survey, a survey of stores and food sources, and assessments of residents’ physical activity and
________________
48For more details on this research, see Pienta, Alter, and Lyle (2011).
49For more information about WAP, see http://www1.eere.energy.gov/wip/wap.html [January 2014].
other characteristics of the neighborhood. They built an experimentation station in the neighborhood that included a meeting room where the researchers could provide instructions and carry out associated activities. The data collection included a household survey covering demographics, time usage, crime and safety, housing, and expenditures. Household respondents were also asked about their participation in “green” activities, such as recycling, reducing car use, and composting. Participants were asked to play games designed to elicit their preferences with respect to such attitudes as risk tolerance, patience, and attitudes about conservation. The researchers obtained permission to collect energy usage data from local utilities. The data were also geocoded so that they could be linked to information about the physical attributes of buildings and neighborhoods in the study site, as well as data on WAP participation.
Only 16 of 233 homeowners in the study who were eligible for WAP took advantage of it, Eckel reported. They tended to be older than the sample and were more likely to have participated in local utility programs that suggest they were “paying attention.” In Eckel’s view, these results suggest the importance of considering indicators of a population’s likeliness to take advantage of a policy such as WAP. Many people who are living in poverty, she suggested, are “just trying to get through tomorrow, and are not the people who are ‘paying attention’ to what is going on [with respect to] policy.” Thus, in her view, it is important to include stakeholders from the beginning in designing policies so that they will reflect the needs of the communities they are intended to serve.
RETRACTIONS AND SCIENTIFIC COMMUNITIES
Jeff Furman, Boston University
Scientists make mistakes, and Jeff Furman noted the “perception that there is now more false science than there had been.” His research examined scientific work that was retracted after having been reviewed by peers and published, and the role of institutions in the accumulation and regulation of accurate scientific knowledge. Economic growth requires new ideas that are easily accessible, he noted, and current research will be vital to future generations, just as contemporary scientists rely on what was learned in the past. Institutions, whether public or private, play an important role in establishing the policies that govern the generation of knowledge as well as how it is diffused and accumulated.
“Science must wrestle with the question of how much wrong information we are willing to tolerate,” Furman explained. If the certification process—peer review and publication—were to eliminate everything about which there is some doubt, “we would likely be censoring material that is truly important,” he added, but it is hard to measure the impact of published findings that are wrong. He noted that more than half of retractions take place within the first two years after publication, but he and his colleagues wondered whether retraction occurs in time. “We worry not about whether the [retracted] article is terrible, but about the amount of time spent building on it,” he said.
Furman and his colleagues have conducted several studies of this process designed to support recommendations to industry and government. Their goal was to understand the drivers and implications of “false science.” They used citation analysis of publications in the biomedical field to track what Furman called knowledge flaws. The
PubMed50 database notes when a retraction occurs, so they were able to track retractions and explore the features associated with them. Unfortunately, he noted in response to a question, it is more difficult to track the reason for the retraction (whether error or fraud).
Furman and his colleagues found that retractions are becoming more common, that they usually happen swiftly, and that citations of articles that have been retracted decline by 50 to 80 percent. Papers that have the highest number of citations in the first year after publication have a higher probability of being retracted than those with fewer citations, and papers published by scholars at elite institutions have a higher probability of being retracted than those of other researchers. Publication of false information can have damaging effects, noted Furman. For example, a paper falsely demonstrating a connection between the MMR vaccine and autism led to a substantial decrease in vaccination rates in Europe, which in turn gave rise to outbreaks of measles. High incidences of retractions may also influence the reputation of a field, Furman concluded.
Alan Porter, Georgia Institute of Technology
Ismael Rafols, Georgia Institute of Technology
Interdisciplinary collaboration is regarded as important to innovation and beneficial in many other ways, but it is not easy to measure. Alan Porter, Ismael Rafols, and colleagues explored ways to measure and map integration and specialization and to assess the effects of interdisciplinary collaboration. In particular, they were interested in understanding the effects on the scientific output of interdisciplinary work and comparing national and international interdisciplinarity. Their approach was to track the transfer of knowledge across time, using measures of interdisciplinarity, and mapping the results. They began with metrics devised for the National Academies Keck Futures Initiative,51 which was designed to spur interdisciplinary research in the United States. For the research publications covered by this program, they extracted cited references and used the Web of Science subject categories to classify them. With these data they created a matrix to show the interrelationships, and then calculated measures of integration (the breadth of subject categories referenced), specialization (the degree of concentration of publication activity), and diffusion (the diversity of citations).
Porter and his colleagues identified several approaches to mapping interdisciplinary work. Science overlay maps show the diversity of a body of work, while research network maps show how coherent it is. For example, Figure 5-1 shows a “meta overlay” map of citations in four areas of science. To complement the science overlay mapping, Porter, Rafols, and colleagues also used data on patents and data from the MEDLINE database52 to produce visual representation of interdisciplinarity. For research network mapping, they used data on co-author collaborations, citations, and bibliographies.
________________
50See http://www.ncbi.nlm.nih.gov/pubmed [January 2014].
51For more information, see http://www.keckfutures.org [January 2014].
52For more information, see http://www.nlm.nih.gov/bsd/pmresources.html [January 2014].
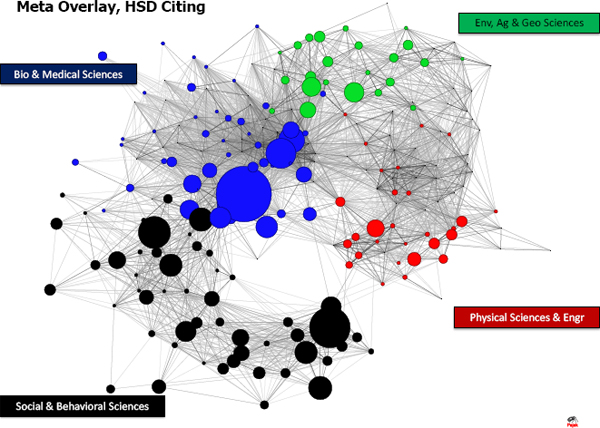
FIGURE 5-1 Meta-overlay map of citations in four areas of science.
NOTE: Green circles are environmental, agricultural, and geological sciences; blue circles are biological and medical sciences; red circles are physical sciences and engineering; black circles are social and behavioral sciences.
SOURCE: Presentation to SciSIP Principal Investigators’ Conference by Alan Porter and Ismael Rafols, 2012.
Tim Sturgeon, Massachusetts Institute of Technology
Tim Sturgeon used findings from a 2010 National Organizations Survey (NOS), supplemented with other data, to explore links between globalization and jobs in the United States. He and his colleagues obtained data on business functions (such as a firm’s primary output, research and development, sales and marketing, transport and logistics, etc.), employment and wages, and sourcing practices (the costs of goods and services by business function and type of offshore location).
Their data covered 333 firms altogether, 198 of which had more than 500 employees, and 121 of which had fewer. For this sample, about two-thirds of employees are engaged in the firm’s primary business function. More than half of the firms have at least one employee devoted to research and development. The survey finds that almost one-half (48%) of full-time employees work at organizations that have some domestic
outsourcing, and almost one-quarter (23%) work at organizations that source internationally. International sourcing is concentrated in organizations in the goods producing and trade industry groupings. It is spread across all functions, including R&D, and is mainly carried out by large firms through foreign affiliates. Most international sourcing is to high cost locations, and secondarily to very low cost locations. Non-goods-producing organizations are more likely to source to low cost locations. Domestic outsourcing is concentrated in transport, IT services, and facilities maintenance business functions, and no consistent relationships between domestic outsourcing and employment or wages were found. However, international sourcing does appear to undermine low wage employment at home; it is related to relatively more high-wage employment and less low-wage employment by U.S. organizations.
In addition to these preliminary observations, the survey provides proof-of-concept, in the context of the United States, for the efficacy and usefulness of the data collection using a business function approach, an approach that has been used successfully by official data agencies in Europe and Canada.53
A QUALITY-ADJUSTED PRICE INDEX FOR CLINICAL TRIALS RESEARCH
Iain Cockburn, Boston University
Iain Cockburn and his colleagues analyzed trends in the costs of doing clinical trials. They focused on payments to clinicians by trial sponsors, and used “hedonic” price index methods to estimate the rate of inflation in commercial clinical trials from 1989 to 2009, controlling for trial characteristics. They looked at differences in the growth of cost rates across therapeutic areas, phases of clinical development, and degrees of demand in terms of time and resources. They also compared costs in the United States and other countries. It is difficult to understand trends in research productivity given the general inflation in the cost of doing research, which has been significant since the early 1980s, Cockburn noted. It could be that costs have gone up because researchers are tackling more difficult problems that require more resources, or it could be that costs have increased because of increases in the costs of salaries, facilities, instrumentation, and other resources. It would also be useful to compare trends in publicly and privately funded research, he added.
Cockburn and his colleagues used data on investigator grants from the MediData Solutions, Inc., database,54 which included 225,000 records derived from contracts between sponsors and investigators. They coded the data for date, location, number of patients involved, therapeutic class, phase of development, and site work effort (a measure of complexity and difficulty of the research protocols). They found that the mean grant cost per patient grew fourfold from 1989 to 2009, while the site work effort grew threefold. In comparison to this sample, the costs of NIH-funded projects doubled. They used statistical procedures to analyze the data.
Cockburn offered a few findings about the increases they found. First, increases in “site work effort” had a large impact on overall cost increases. Inflation rates varied
________________
53For more details on this research, see Brown, Sturgeon, and Cole (2013); Brown, Lane, and Sturgeon (2013); and Sturgeon et al. (2011).
54See http://www.mdsol.com [January 2014].
across different sorts of trials and sites, and the inflation rates were highest for the later stages of clinical work, when trials typically involve smaller numbers of patients per site. He noted that increases in overall expenditures reflect both the fact that more trials are being done and that substantial inflation has occurred in the average unit costs of this activity (which reflect both increases in quality and effort and increases in the prices of inputs such as wages, materials, and instruments). Cockburn ended by noting that it would be possible to use this type of data to construct a “constant quality” price index for private sector clinical research.
MAPPING ACADEMIC PATENTS TO PAPERS
Zhen Lei, Pennsylvania State University
Zhen Lei and his colleagues studied the influence of different sources of funding and licensure and patenting rules on the ultimate utilization and diffusion of inventions that are developed in a university setting. They focused on the chemical sciences and used two types of data. The first data set came from the University of California (UC) Office of Technology Transfer, which was able to provide data on invention disclosures and patents and licenses for the entire UC system. The second data set resulted from the researchers’ work to scan publications in the chemical sciences by University of California researchers from 1975 to 2005.
The first step in the analysis, Lei explained, was to map patents granted to UC researchers to their publications. One might expect that each invention for which a patent application was filed would also have resulted in a published paper. In practice, however, a single patent application may be the result of multiple papers covering different aspects of the necessary research. Moreover, researchers whose first applications are rejected may publish numerous papers as they pursue ultimate approval. Lei and his colleagues used paper abstracts to identify content of inventions. They looked at the time relationship between publications and patents granted and traced the role of the lead researchers and their collaborators, as well as their university affiliations, in the utilization and diffusion of patented inventions.
Lei and his colleagues used statistical methods to review a set of patents, and developed an algorithm that identified links among publications, university policies, funding sources, and the ultimate influence of the inventions. The algorithm, Lei concluded, is a useful tool for studying the ways in which university inventions are put to use both within academia and industry, as well as the impacts of university patenting and licensing policies and government funding.55
________________
55For more details on this research, see Oh et al. (2014); Oh et al. (2013); Drivas, Lei, and Wright (2013a, 2013b).
Leah Nichols, National Science Foundation
Leah Nichols explained Portfolio Explorer as a suite of automated tools, developed as part of the STAR METRICS Program,56 that can track such features as topics, award data, the expertise of principal investigators, patents awarded, and geographic representation. NSF developed and piloted the Portfolio Explorer as a potential tool for planning and evaluation purposes. For planning, the Portfolio Explorer can help identify what research is needed to meet national goals, as well as what science is missing, emerging topics where new science needs support, and areas where interdisciplinary collaborations—between disciplines and across programs and directorates within NSF—can be valuable. The Explorer can also be used for evaluation of how well the portfolio has met past goals, and where its strengths and weaknesses lie. It can reveal the diversity of a portfolio and answer questions about how well a particular topic terrain is being covered.
This sort of portfolio analysis can be done in different ways, Nichols noted. If new projects are coded by topic, it is straightforward to analyze coverage for different areas, for example, but this sort of analysis cannot be done retroactively on projects that were not coded. In that case, the project abstracts can provide data on topic coverage, but reviewing the abstracts is labor intensive and limits the number of projects that can be covered.
A statistical text-mining algorithm was used to analyze and identify topics covered by the titles and project descriptions of all proposals submitted to the NSF between 2000 and 2011. In the Portfolio Explorer, all proposals were tagged with up to four topics each and also linked to other data, so that “you can use the topics to get at the awards and all the associated information, like award amounts, funding programs, PIs, PI institutions, and so forth,” Nichols observed.
Nichols has used the Explorer tools to assess cognitive and neuroscience research at NSF. She was asked to quantify how much of such research was being funded by NSF, what kinds of research, and which programs were funding that science. She and her colleagues identified 30 of the 1,000 topics in the topic model that were most relevant to cognitive and neuroscience research and used the topics to flag 3,000 of the approximately 100,000 awards funded in the past 5 years. The topics included, for example, stimulus and response, functional magnetic resonance imaging (fMRI), human vision, sleep, human motion, hormones, and many more. They cleaned the list for false positives—projects that were not actually relevant—and then tracked the selected projects to see which directorates contributed to their funding. They also mapped the topic-relationships of the projects and identified cross-directorate research themes.
In Nichols’ view, the topic model approach is valuable for several reasons, though she acknowledged that further validation work is needed. It allows for content-based characterization of funding portfolios that circumvents reliance on the institutional structure. It allows for rapid assessment of very large portfolios, and for retroactive assessment. (See the Measuring Interdisciplinarity project description below for more discussion of the topic model tool.)
______________
56See https://www.starmetrics.nih.gov/ [January 2014].
David Newman, Google
David Newman explained that interdisciplinarity, or collaboration across disciplines, has been measured in a variety of ways. For example, researchers have tracked citations and mapped them to identify the diversity and coherence of a particular portfolio of work. This kind of work has been helpful in demonstrating how interdisciplinary collaboration is rewarded, or not, in academia. It can also be used to trace the extent to which novel disciplinary collaborations can be found.
Another approach is topic modeling as discussed by Nichols above. Its advantage, in Newman’s view, is that its algorithm uses data drawn from the research itself, rather than from institutional structures through which the research was produced, to produce categories and a picture of a body of work. “Topic modeling learns from bottom up,” he noted. “It learns using the discourse of the investigators themselves.”
The tool also can produce an interdisciplinarity score, Newman explained. The topic model identifies the top four topics for particular research and can assess how semantically different those topics are and how novel the interdisciplinary collaboration was, expressed numerically. These scores can be plotted to show the patterns for a particular body of work. This analysis revealed patterns in the work funded by NSF. For example, such programs as Antarctic Earth Sciences, the Continental Dynamics Program, and Sedimentary Geology and Paleontology ranked very high for interdisciplinarity, while Human Cognition and Perception, and General Age Related Disabilities Engineering ranked on the low end. The NSF has programs designed specifically to support interdisciplinary work, and the analysis showed that these programs did indeed produce work that scored high for interdisciplinarity.
The topic-modeling tool can be used to assess a body of proposals or grants awarded, by awarding entity, topic, publication etc., Newman noted. It complements citation analysis and helps investigators avoid pre-defined subject categories that may obscure interdisciplinary collaborations.


