
2
Current Epidemiology of Obesity in the United States
Key Points Highlighted by Individual Speakers
- Obesity has plateaued among women and girls regardless of ethnicity, although it continues to increase among men and boys. Obesity rates among low-income children aged 2-5 have decreased significantly in 18 states. (Dietz)
- Changes in tobacco consumption are a potential model for the plateaus in the prevalence of obesity in the United States. Awareness of the adverse health effects of tobacco was associated with a plateau in consumption before any major policy efforts were initiated. (Dietz)
- Rates of severe obesity have continued to increase in the United States, necessitating the addition of clinical approaches to initiatives aimed at prevention. (Dietz)
William Dietz, former director of the Division of Nutrition, Physical Activity, and Obesity at the Centers for Disease Control and Prevention (CDC), presented an overview of the current epidemiology of obesity in the United States. He reviewed, in turn, adult and child obesity rates, similarities between the tobacco and obesity epidemics, the prevalence of severe obesity, the costs of obesity, and policy interventions.
Recent data on the status of obesity in U.S. adults and children reveal a mix of good and bad news, said Dietz. Some populations have achieved a plateau in obesity rates. According to data from the National Health and Nutrition Examination Survey (NHANES), which conducts continuous surveys and groups the data in 2-year increments, obesity appears to have plateaued among women and girls regardless of ethnicity, although it continues to increase among men and boys. In adult men, obesity increased by 7 percent from 1999-2000 to 2009-2010 and continues to increase (see Figure 2-1).
However, these summary data obscure persistent disparities. Obesity continues to increase among African American and Hispanic women. Among women, the highest prevalence of obesity occurs among African Americans: more than 50 percent of African American women are obese. About 40 percent of Hispanic women are obese. By comparison, about 30 percent of Caucasian women are obese. Among men, in contrast, obesity rates are similar across all major ethnic groups.
The summary data also can contribute to a common misunderstanding of the relationship between poverty and obesity, Dietz said. Despite the
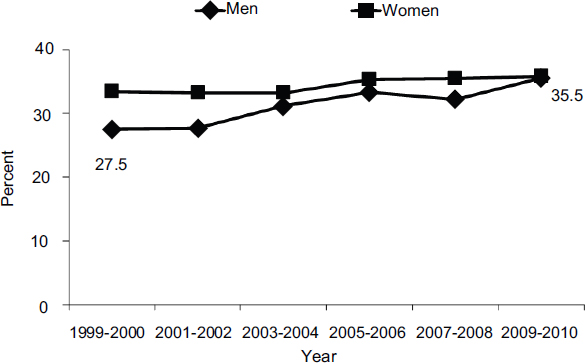
FIGURE 2-1 The prevalence of obesity in women has plateaued in recent years, while the rate among men has continued to increase.
SOURCE: Ogden et al., 2012.
widespread belief that poverty is correlated with obesity, that is true only among certain groups. Among African American and Hispanic men, higher-income groups have a higher prevalence of obesity relative to lower-income groups. In white women, the reverse is true.
Among children, the same general trends of a plateau for girls and continued increases for boys can be seen, but if African American boys are removed from the analysis, the prevalence in boys also is flat. Higher-income white children have lower obesity rates than their lower-income counterparts, but no significant socioeconomic relationship with obesity is seen in African American boys or girls. Among children, as with adults, Dietz pointed out, ethnic disparities will continue to widen if the incidence of obesity continues to differ by group.
A more detailed look at the data for young children and for children in high-risk populations, primarily those served by the Special Supplemental Nutrition Program for Women, Infants, and Children (WIC), reveals a flattening of the epidemic for many but not all groups (see Figure 2-2). Obesity rates among children aged 2-5 have undergone significant decreases in 18 states and in one territory, the Virgin Islands (see Figure 2-3). Thirteen communities also have reported significant decreases in the prevalence of childhood obesity. Statistically significant increases in obesity have occurred in only three states: Colorado, Pennsylvania, and Tennessee, the first of which
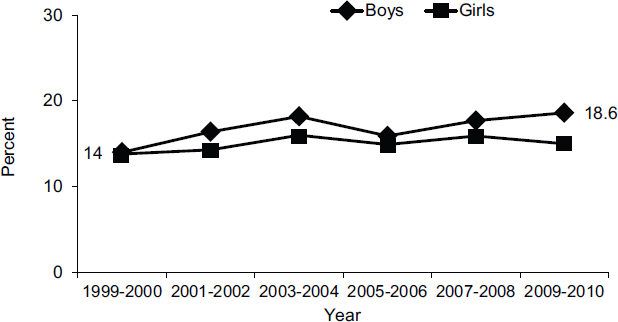
FIGURE 2-2 The prevalence of obesity among girls aged 2-19 has plateaued in recent years, while the rate among boys has continued to increase.
SOURCE: Ogden et al., 2012.
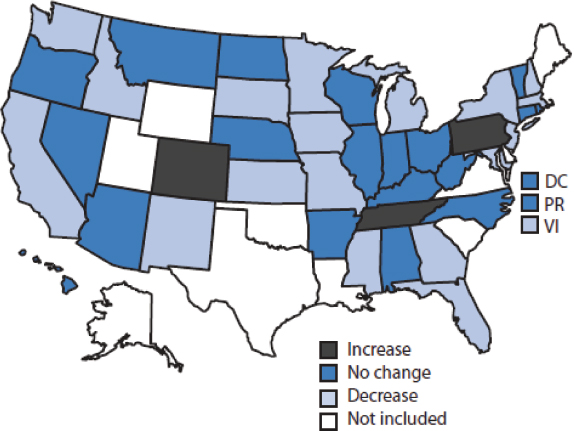
FIGURE 2-3 The prevalence of obesity among low-income preschool-aged children fell in most states from 2008 to 2011.
NOTE: DC = Washington, DC; PR = Puerto Rico; VI = Virgin Islands. SOURCE: CDC, 2011.
has historically had relatively low adult obesity rates. The decreases in obesity rates have not yet been analyzed across income and ethnic groups.
Many questions continue to surround these data, said Dietz. How valid were the data collections? How replicable are the data? In areas that demonstrate a decrease, what drove that change? How does one assess the dose of the public health interventions that have been implemented in these states and communities? What factors are responsible for the differing trends among ethnic and income groups? The answers to all of these questions offer potential opportunities to target interventions in productive ways.
Dietz pointed to the tobacco epidemic as a model for understanding obesity trends. Per capita cigarette consumption began to increase in 1900 and continued to increase until the 1950s, when the first report linking smoking and cancer appeared (see Figure 2-4). Tobacco use peaked at the time of the first surgeon general’s report in 1964 and then plateaued for a number of years.
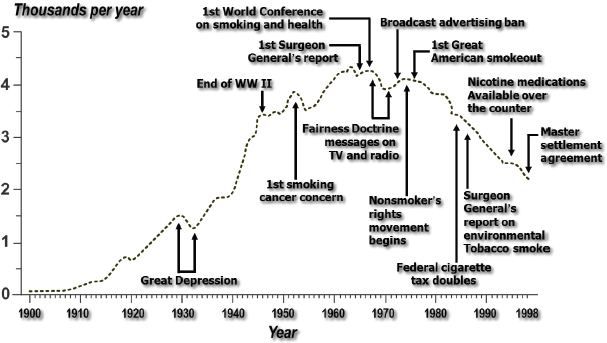
FIGURE 2-4 Annual adult per capita cigarette consumption plateaued in the 1960s and began to decline in the 1970s. SOURCE: CDC, 1999.
The plateau occurred before a variety of policy and environmental initiatives were undertaken, Dietz observed. As people became increasingly aware of the adverse effects of tobacco use, they may have begun to change their habits in much the same way that people are beginning to change their food and beverage consumption habits. For example, the consumption of pizza—the second most important contributor to caloric intake in children and adolescents—has declined. Consumption of fast food and soda also is decreasing. Thus far the decreases have been modest, but they may be contributing to the observed plateaus in obesity rates, Dietz said.
Another important lesson from the tobacco epidemic is that changes did not begin at the federal level. They began at the local or state level in much the same way that changes at the local and state level may be affecting the prevalence of obesity.
Despite the optimistic observations noted above, the prevalence of severe obesity in children and adolescents—defined as body mass index (BMI) more than 120 percent of the 95th percentile—is increasing. Approximately 6 to 7 percent of girls have severe obesity (see Figure 2-5). Rates are especially high among African American and Hispanic girls, but the rates
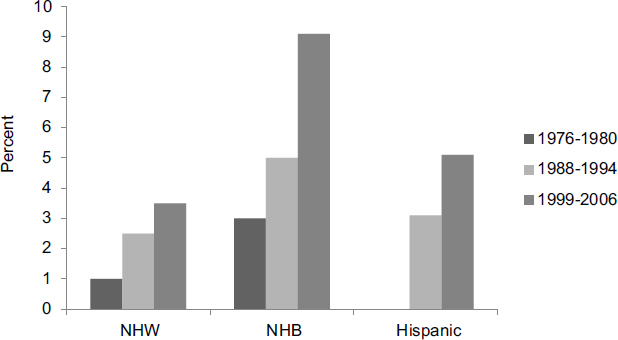
FIGURE 2-5 Severe obesity among girls rose in all ethnic groups from 1976-1980 through 1999-2006.
NOTE: NHB = non-Hispanic black; NHW = non-Hispanic white. SOURCE: Wang et al., 2011.
for all ethnic groups have more than doubled over the past three decades, and boys show similar trends and disparities (see Figure 2-6).
Severe obesity remains a serious and increasing problem in adults as well. During the 12-year period covered by the most recent NHANES data, severe obesity increased by about 30 percent in both men and women (see Figure 2-7), with disparities particularly notable in African American women (see Figure 2-8).
Dietz asserted that the problem of severe obesity cannot be eliminated through the kinds of policy and environmental initiatives being pursued today. Rather, it requires a clinical approach in addition to initiatives aimed at the relatively small calorie changes needed for prevention.
The costs of obesity are substantial. According to conservative estimates, obesity accounted for $147 billion in health care costs in 2008, or 9 percent of the national health care budget, up from 6.5 percent of the budget in 1998 (Finkelstein et al., 2009). Medicare and Medicaid incurred 42 percent of these costs.
The majority of these costs are being generated by people with more
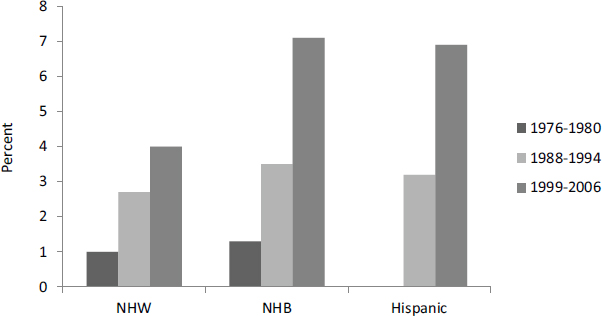
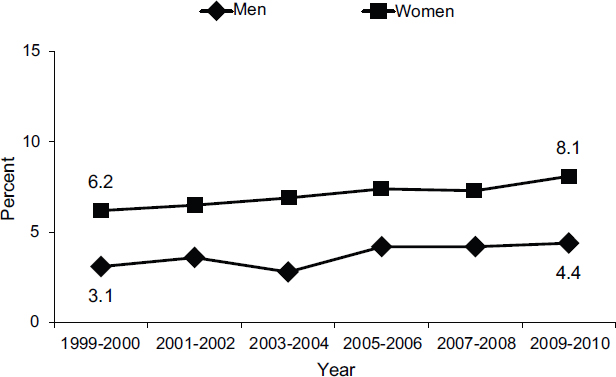
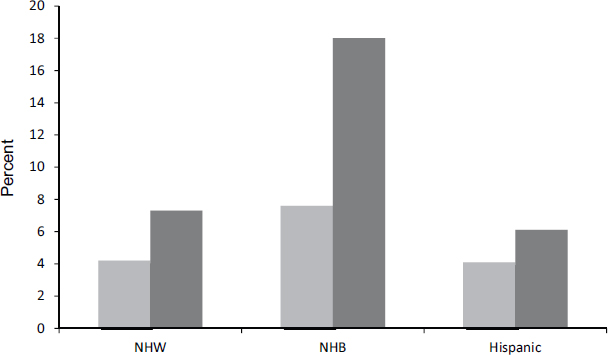
FIGURE 2-8 The prevalence of severe obesity is higher in women than in men and higher in non-Hispanic blacks (NHBs) than in non-Hispanic whites (NHWs) and Hispanics.
SOURCE: Flegal et al., 2012.
severe obesity According to a study by Arterburn and colleagues (2005), grade II and grade III obesity, defined as a BMI of 35 to 39 and 40 or greater, respectively, account for only 8 percent of the population but 40 percent of the cost. Yet the intensity of therapies currently is not aligned with the severity of obesity in either adults or children, Dietz said.
The advent of the Patient Protection and Affordable Care Act provides an opportunity to think about different ways of delivering care for people who are obese. Care extenders, group care, education for providers, and joint clinical and public health approaches all are possible ways of dealing with the problem that have not seen widespread use in the past. For example, Dietz observed that very few medical, nursing, or dietetic schools teach providers how to initiate discussion of obesity in ways and using terms that are not offensive. Nor are institutions addressing the biased attitudes toward overweight and obese people that affect the quality of care.
Efforts to stem the use of tobacco were successful because they did not focus solely on individual change, Dietz said. According to the social-ecological model of public health, interventions can encompass the knowledge, attitudes, beliefs, and behaviors of individuals; the interpersonal influence of family, peers, and social networks; policies, regulations, and informal structures in institutions; policies, standards, and social networks at the community level; and federal, state, and local policies designed to regulate and support healthy actions. A multilayered and multisectoral approach will be needed to accelerate progress against the obesity crisis.
Interventions are needed both to prevent obesity in the first place and to implement better strategies for those who are already overweight. Regarding prevention, a recent study by Wang and colleagues (2012) may provide an explanation for recent shifts in the prevalence of obesity among young children. According to this model, the energy deficits needed to achieve the Healthy People 2010 goal of an obesity prevalence of 5 percent by 2020 through prevention are just 33 calories a day for children aged 2-5, 149 calories a day for children aged 6-11, and 177 calories a day for adolescents through age 19. These are much smaller deficits than those necessary to achieve weight loss in children and adolescents who are already obese. For adults, the deficit needed to return to an obesity prevalence of 10 percent through prevention is about 220 calories per day. These goals are achievable with the strategies being implemented today, said Dietz.
Multiple strategies can reduce energy intake and increase physical activity. According to Dietz and research conducted by Wang and colleagues (2013), sound strategies for reducing calories are to apply the current standards in California to competitive foods,1 eliminate sugar-sweetened drinks or switch from whole to low-fat milk in early care and education centers, and decrease fast food consumption. These three strategies could reduce consumption by an average of 78 calories, 80 calories, and 125 to 310 calories per day, respectively—more than enough to meet the Healthy People 2020 goals. Similarly, according to Bassett and colleagues (2013), strategies for increasing physical activity that have the greatest impact are mandatory physical education, classroom activity breaks, and walking or biking to school for the 20 percent of the student population who can do so. These three strategies could increase moderate to vigorous physical activity by as much as 23 minutes, 19 minutes, and 16 minutes per day, respectively.
__________
1Competitive foods are defined as foods and beverages offered at schools other than meals and snacks served through the federally reimbursed school lunch, breakfast, and after-school snack programs. Competitive foods include food and beverages sold through a la carte lines, snack bars, student stores, vending machines, and school fundraisers (IOM, 2012a).
Data such as these can help narrow the target for obesity prevention efforts by providing estimates of the caloric impact of policy interventions, Dietz observed. Calculations of the costs and benefits of policy interventions may also influence the choice of strategies. For example, the Childhood Obesity Intervention Cost Effectiveness Study (CHOICES), analyzes the reach, the cost, the BMI unit decrease, and the cost per BMI unit decrease of four strategies. This study has found that the estimated costs per unit of decrease in BMI among youth aged 2-19 are $191 for active physical education in school (which is relatively high because of the required investment in teachers and infrastructure), $6.44 for an excise tax on sugar-sweetened drinks of a penny per ounce (which also generates revenues), $6.07 for implementing multiple early care and education policies, and $.08 for eliminating the tax deduction for television advertising. This analysis currently is being extended to 40 possible policy interventions.2
In each of the seven areas examined in the workshop (and discussed in Chapters 3-9), signs of progress can be found, Dietz concluded, even though much more remains to be done. As Winston Churchill said, “This is not the end. It is not even the beginning of the end. But it is, perhaps, the end of the beginning.”
__________
2For more information about the CHOICES program, see http://www.hsph.harvard.edu/prc/projects/choices-childhood-obesity-intervention-cost-effectiveness-study (accessed April 29, 2014).


