Epidemiology of Serious Illness and High Utilization of Health Care
Melissa D. Aldridge, Ph.D., M.B.A.
Amy S. Kelley, M.D., M.S.H.S.
Prior to the adoption and implementation of programs aimed at reducing health care costs while providing high-quality care for patients, it is critical to have a comprehensive sense of the drivers of health care costs and the variability across different populations in annual health care spending. Health care reform debate in the United States is focused largely on the highly concentrated health care costs among a small proportion of the population and policy proposals to identify and target this “high-cost” group. The objective of this appendix is to characterize the population of individuals with the highest total health care costs using analyses of existing national datasets, peer-reviewed literature, and published reports. One of the greatest gaps in terms of the research we reviewed for this appendix is the lack of evidence regarding the impact of interventions or models of care on total health care costs. Most of the analyses we reviewed focused on only one payor—generally Medicare. Although such studies are informative, the focus on Medicare costs alone has led to the misperception that older adults and those at the end of life are the primary drivers of health care costs, and yet when one evaluates total health care costs, as we do in this appendix, that perception is not supported by the evidence.
We synthesize and augment existing evidence regarding individuals with high health care costs and describe this group in terms of demographics, clinical characteristics, and patterns of health care use. Based on existing evidence, we focus on individuals with chronic conditions and functional limitations. We then examine the costs and intensity of care for individuals at the end of life and present new findings regarding the overlap between the high-cost and end-of-life populations. We present results of our analy-
ses identifying three patterns within the high-cost group: individuals who experience a discrete high-cost event in one year but who return to normal health and lower costs; individuals who persistently generate high annual health care costs due to chronic conditions, functional limitations, or other conditions; and individuals who have high health care costs because it is their last year of life. We conclude with a discussion of existing models of care that target high-cost populations and of future research to improve understanding of the population with highest health care costs. A critical next step in research is to evaluate the impact of various interventions on reducing total health care costs so that programs and policies implemented across the health care system truly reduce total costs rather than merely shifting costs from payor to payor.
CHARACTERIZING THE POPULATION WITH THE HIGHEST HEALTH CARE COSTS
Distribution and Trends in Total Health Care Costs
In 2011, the United States spent $2.7 trillion on health care, more than double what was spent in 2000 (CMS, 2014). It is projected that by 2040, 1 of every 3 dollars spent in the United States will be spent on health care (CBO, 2007; Emanuel, 2012). In evaluating these estimates and their relevance to health policy reform, however, it is important to understand the definition of health care costs that is used to calculate these estimates. The National Health Expenditure estimates (CMS, 2014) published annually by the Centers for Medicare & Medicaid Services (the source of the $2.7 trillion estimate for 2011) include a number of expenditure categories unrelated to direct patient care (see Figure E-1). Specifically, they include expenditures for government administration of health care programs; federal public health initiatives; investments in health care research, structures, and equipment; and non–patient care revenue, including revenue from gift shops and hospital cafeterias. Our analysis in this appendix focuses exclusively on the $1.6 trillion of patient care–related expenditures (shown in Figure E-1), with the goal of identifying policy solutions for addressing costs specifically related to patient care.
Health care reform debates that focus on health care costs generally fall into three major categories: (1) discussion of high total health care costs and reform proposals targeting how to decrease total costs, (2) discussion of the growth in health care costs over the past decade and reform proposals aimed at how to “bend” the cost curve, and (3) discussion of the highly concentrated health care costs among a small proportion of the population and policy proposals for identifying this “high-cost” group and significantly reducing their costs. The focus of this section of this appendix is on this
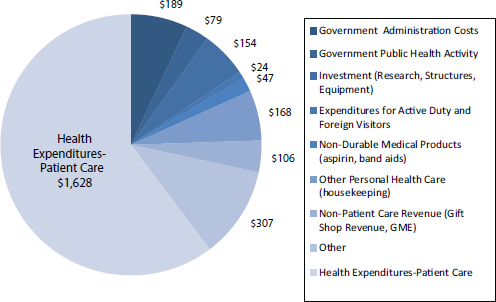
FIGURE E-1 Components of the $2.7 trillion of national health care expenditures, 2011.
NOTES: Expenditures are in billions of dollars; expenditure components were estimated based on the Centers for Medicare & Medicaid Services 2011 National Health Expenditure report (CMS, 2014), with adjustments based on estimates from Sing and colleagues (2006) and the 2011 Medical Expenditure Panel Survey data (AHRQ and HHS, 2011). GME = graduate medical education.
third category—characterizing the subpopulation with the highest health care costs.
The distribution of health care costs for the U.S. population consistently exhibits a significant “tail” segment of the population with extremely high costs. As of 2011, the top 5 percent of health care spenders (18.2 million people) accounted for an estimated 60 percent of all health care costs ($976 billion) (see Figure E-2). In this high-cost subgroup, total annual costs ranged from approximately $17,500 to more than $2,000,000 per person based on our analyses of the 2011 Medical Expenditure Panel Survey (MEPS) data (AHRQ and HHS, 2011), adjusted to include the nursing home population (National Center for Health Statistics, 2013).
Population with the Highest Health Care Costs
In an attempt to design policy solutions that target those individuals with exceptionally high health care costs, it is critical to understand the
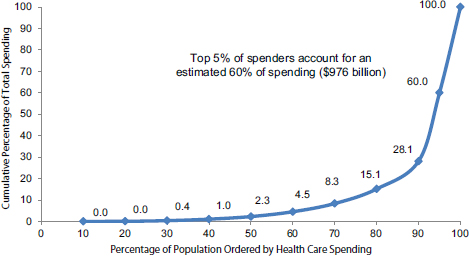
FIGURE E-2 Cumulative distribution of personal health care spending, 2011.
SOURCE: Total population and health care costs were obtained from the 2011 Medical Expenditure Panel Survey data (AHRQ and HHS, 2011), adjusted to include the nursing home population (National Center for Health Statistics, 2013). The entire nursing home population is estimated to be in the top 5 percent of total health care spending (see the section below on the nursing home population for details).
characteristics that define this population and thus potentially how and why they incur such high costs. Using our own analyses of the 2011 MEPS data combined with cost and population estimates for the nursing home population, we present findings regarding this high-cost population in terms of clinical characteristics and demographics.
The MEPS is a set of large-scale surveys of families and individuals, their medical providers (for example, doctors, hospitals, pharmacies), and employers across the United States (AHRQ and HHS, 2011). The households included in the survey are drawn from a nationally representative subsample of households. The MEPS collects data on the specific health services that Americans use, how frequently they use them, the cost of these services, and how they are paid for, as well as data on the cost, scope, and breadth of health insurance held by and available to U.S. workers.
The MEPS is considered the most complete source of data on the cost and use of health care and health insurance coverage for the U.S. population. The MEPS sample, however, does not include the population of individuals residing in nursing homes, and therefore we augmented our analyses of the MEPS data with estimates of the nursing home population sourced from the National Health Expenditure Accounts (CMS, 2014) and
the Centers for Disease Control and Prevention (CDC) (Jones et al., 2009; National Center for Health Statistics, 2013; Sing et al., 2006).
To reiterate, unlike the National Health Expenditure estimate of $2.7 trillion of total costs—which includes expenditures for government administration of health care programs; federal public health initiatives; investments in health care research, structures, and equipment; and non–patient care revenue—our analyses in this section focus on the $1.6 trillion total costs for patient health care services.
Chronic Conditions and Functional Limitations
A substantial and growing body of work suggests that a key factor distinguishing individuals with the highest health care costs is the existence of both chronic conditions and functional limitations. Analyses of data on chronic conditions and health care costs have found that, of the population with the highest health care costs, greater than 75 percent have one or more of seven chronic conditions, including 42 percent with coronary artery disease, 30 percent with congestive heart failure, and 30 percent with diabetes (Emanuel, 2012). The U.S. Department of Health and Human Services (HHS) launched an initiative to both prevent and better manage care for multiple chronic conditions given their high prevalence and high associated health care costs. HHS reports that more than 25 percent of individuals in the United States have multiple chronic conditions, and the care of these individuals accounts for 66 percent of total health care spending (HHS, 2014). An analysis of U.S. health care spending recently reported in the Journal of the American Medical Association finds that chronic illnesses account for 84 percent of total health care costs (Moses et al., 2013).
A report to HHS by The Lewin Group (2010) takes this research a step further and evaluates the combination of chronic conditions and functional limitations as a way to identify the subgroup with the highest health care costs within the population with chronic conditions. This report concludes that the combination of chronic conditions and functional limitations is a better predictor of high health care costs than the number of chronic conditions alone. It finds that although nearly one-half of people living in the community have at least one chronic condition, fewer than one-third of those with chronic conditions have any functional limitation. Thus, the combination better pinpoints those with the greatest demand for health care and supportive services.
Throughout this analysis, we define a chronic condition as one that lasts or is expected to last 12 months or longer and either places limitations on normal function or requires ongoing care (The Lewin Group, 2010). A functional limitation is defined as having limitation in at least one of the following: physical activity (for example, walking, bending, stooping);
TABLE E-1 Population and Health Care Costs by Existence of Chronic Conditions and Functional Limitations
| No. of People | % | Health Care Costs | % | |
| Total Population | 312,514,999 | $1,627,372,719,765 | ||
|
No chronic conditions or functional limitations |
149,340,364 | 48 | 186,301,532,393 | 11 |
|
Chronic conditions only |
112,005,273 | 36 | 505,675,587,925 | 31 |
|
Functional limitations only |
6,222,515 | 2 | 26,614,504,628 | 2 |
|
Chronic conditions and functional limitations |
44,946,847 | 14 | 908,781,094,819 | 56 |
SOURCE: The percentage distribution of population and costs by chronic condition/functional limitation category was obtained from The Lewin Group (2010); total population and health care costs were obtained from the 2011 Medical Expenditure Panel Survey data (AHRQ and HHS, 2011), adjusted to include the nursing home population (CMS, 2014; National Center for Health Statistics, 2013; Sing et al., 2006).
normal life activity (for example, work, housework, school); an activity of daily living (ADL); or an instrumental activity of daily living (IADL) (The Lewin Group, 2010).
The impact of the combination of chronic conditions and functional limitations on health care costs is shown in Table E-1. Of the $1.6 trillion spent on health care in 2011, 56 percent ($909 billion) was for the 14 percent of the population who suffered from both chronic conditions and functional limitations. The second highest category of health care spenders was those with chronic conditions only. This population incurred 31 percent ($506 billion) of total costs and made up 36 percent of the population. It is clear from these analyses that although the presence of chronic conditions is a key driver of health care costs, the addition of functional limitations appears to differentiate a high-cost group within those with chronic conditions.
Consistent with the distribution of health care costs by chronic conditions and functional limitations shown in Table E-1, the population with both chronic conditions and functional limitations is disproportionately represented in the top 5 percent of health care spenders. Figure E-3 shows that those with both chronic conditions and functional limitations make up 72 percent of the top 5 percent of health care spenders while making up only 12 percent of the rest of the population. Not surprisingly, 50 percent of the lower-spending population has no chronic conditions or functional limitations, while only 5 percent of the high-cost population has neither of these characteristics.
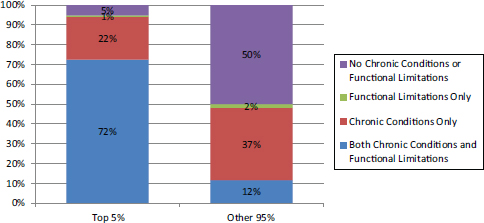
FIGURE E-3 Total health care costs for the top 5 percent and other 95 percent of spenders by existence of chronic conditions and functional limitations.
SOURCE: The percentage distribution of costs by chronic condition/functional limitation category and top 5%/other 95% categories was obtained from the National Institute for Health Care Management (NIHCM) Foundation (2012) analysis of 2009 Medical Expenditure Panel Survey data; these percentages were applied to health care costs from the 2011 Medical Expenditure Panel Survey data (AHRQ and HHS, 2011), adjusted to include the nursing home population (CMS, 2014; National Center for Health Statistics, 2013; Sing et al., 2006).
The combination of chronic conditions and functional limitations may be associated with higher health care costs for many reasons. The association may relate to the complexity of care coordination across multiple providers and settings, including duplication of test and procedures. It may also relate to increased use of specialists or increased likelihood of being hospitalized. A recent commentary in the Journal of the American Medical Association (Emanuel, 2012) suggests that an estimated 22 percent of health care expenditures are related to potentially avoidable complications, such as hospital admission for patients with diabetes with ketoacidosis or amputation of gangrenous limbs, or for patients with congestive heart failure for shortness of breath due to fluid overload (de Brantes et al., 2009; Emanuel, 2012). Reducing these potentially avoidable complications by only 10 percent would save more than $40 billion/year (Emanuel, 2012). Furthermore, the disproportionally higher costs for this group may reflect a lack of adequate community-based care and supportive services for those with functional limitations, which leaves patients with no alternative but to access the acute care hospital system by calling 911 or presenting to the emergency department.
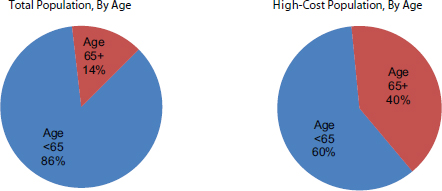
FIGURE E-4 Proportion of the total and high-cost populations by age.
SOURCE: 2011 Medical Expenditure Panel Survey data (AHRQ and HHS, 2011), adjusted to include the nursing home population (CMS, 2012, 2014; National Center for Health Statistics, 2013).
Age and Health Care Costs
Our analyses of the association between older age and higher health care costs suggests that although individuals aged 65 and over are disproportionately in the top 5 percent of the population in terms of total health care spending (see Figure E-4), almost two-thirds of the top 5 percent spenders are younger than age 65. Although older age may be a risk factor for higher health care costs, older adults make up the minority of the high-cost spenders. Furthermore, the proportion of total annual health care spending for the population aged 65 or over (32 percent) has not changed in a decade despite the growth in the size of that population (AHRQ and HHS, 2011).
The pattern we have highlighted of individuals with both chronic conditions and functional limitations generating disproportionately higher health care costs is evident in both the population under age 65 and those aged 65 and older (see Table E-2). Specifically, those with chronic conditions and functional limitations in both groups incur more than 20 percent of the nation’s total annual health care expenditures (and together account for more than half of total spending), yet each group makes up less than 10 percent of the total population.
Race and Health Care Costs
The proportion of individuals who are nonwhite in the top 5 percent of spenders compared with the bottom 95 percent is approximately the
TABLE E-2 Health Care Costs by Age, Chronic Conditions, and Functional Limitations
| Percentage of Population | Percentage of Health Care Costs | |
| Age: Below 65 | ||
|
No chronic conditions or functional limitations |
46.2 | 11.5 |
|
Chronic conditions only |
30.0 | 24.5 |
|
Functional limitations only |
1.7 | 1.1 |
|
Chronic conditions and functional limitations |
7.8 | 22.0 |
| Age: 65 and Older | ||
|
No chronic conditions or functional limitations |
1.1 | 0.4 |
|
Chronic conditions only |
5.9 | 6.9 |
|
Functional limitations only |
0.3 | 0.4 |
|
Chronic conditions and functional limitations |
7.1 | 33.4 |
SOURCE: The percent distribution of population and costs by age and chronic condition/functional limitation category was obtained from The Lewin Group (2010); total population and health care costs were obtained from the 2011 Medical Expenditure Panel Survey data (AHRQ and HHS, 2011), adjusted to include the nursing home population (CMS, 2012, 2014; National Center for Health Statistics, 2013; Sing et al., 2006).
same (14.1 percent versus 20.5 percent) (see Figure E-5). The only notable difference is that the Asian population makes up only 2.0 percent of the top spenders and 5.2 percent of the lower spenders. Similarly, our analysis of the population with the top 5 percent of health care costs by both age and race (see Figure E-6) demonstrates that minority populations do not appear to account for a differential proportion of health care costs by age.
There is significant variation by race in terms of per person costs and payor (see Table E-3). The non-Hispanic white population has almost double the median per person cost of the non-Hispanic black population ($1,660 versus $878). For all races, private insurance is the largest payor. For the non-Hispanic white population, the proportion paid by private insurance is almost half, and the proportion paid by Medicaid is less than 10 percent. In contrast, for the non-Hispanic black and Hispanic populations, the proportion paid by private insurance is approximately one-third, and the proportion paid by Medicaid is roughly one-quarter.
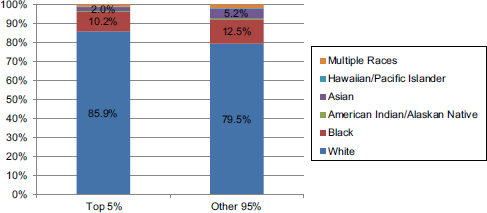
FIGURE E-5 Proportion of the top 5 percent and other 95 percent of spenders by race.
SOURCE: 2011 Medical Expenditure Panel Survey data (AHRQ and HHS, 2011), adjusted to include the nursing home population (CMS, 2014; Jones et al., 2009; National Center for Health Statistics, 2013; Sing et al., 2006).
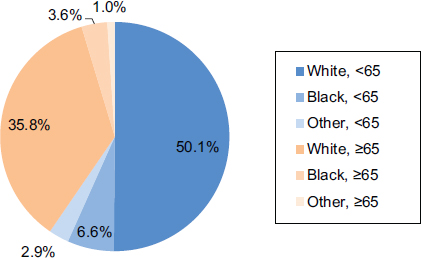
FIGURE E-6 Proportion of the high-cost population by age and race.
SOURCE: 2011 Medical Expenditure Panel Survey data (AHRQ and HHS, 2011), adjusted to include the nursing home population (CMS, 2014; Jones et al., 2009; National Center for Health Statistics, 2013; Sing et al., 2006).
TABLE E-3 Proportion of Health Care Costs by Race and Payor
| Race/ Ethnicity | Population (1,000s) | Per Person Cost | Total Cost (in millions) | Percentage by Payor | ||||||||
| Median | Mean | OOP | Private | Medicare | Medicaid | Other | ||||||
| White, NH | 198,127 | 1,660 | 5,604 | 991,244 | 14.9 | 46.7 | 25.9 | 6.0 | 6.5 | |||
| Black, NH | 37,322 | 878 | 4,677 | 138,138 | 8.8 | 31.2 | 23.6 | 24.6 | 11.8 | |||
| Hispanic | 52,717 | 637 | 3,289 | 126,189 | 13.0 | 34.5 | 19.1 | 23.1 | 10.3 | |||
| Asian/Hawaiian/PI, NH | 16,814 | 792 | 4,355 | 56,675 | 11.2 | 37.8 | 14.1 | 31.0 | 6.0 | |||
| AI/AK Native/Multi, NH | 6,146 | 1,157 | 3,430 | 18,479 | 15.1 | 36.1 | 15.4 | 18.1 | 15.4 | |||
NOTES: This table does not include the nursing home population. AI = American Indian; AK = Alaska; NH = non-Hispanic; OOP = out of pocket; PI = Pacific Islander.
SOURCE: 2011 Medical Expenditure Panel Survey data (AHRQ and HHS, 2011).
Health Care Costs by Payor
There has been very little change in the share of total health care costs paid by major payors in the past decade. In both 2000 and 2011, approximately 40 percent of all health care costs were paid by private insurance, followed by approximately 24 percent paid by Medicare (see Figure E-7). A slightly smaller share of health care costs was paid out of pocket by patients in 2011 (13.9 percent) compared with 2000 (19.4 percent). For the 5 percent of people with the highest health care costs in 2011, a similar proportion of their costs was paid by private insurance and Medicaid compared with the proportion of total costs for 2011, but a larger share (31.4 percent) of the costs of the high-cost population was paid for by Medicare, and a lower share (6.6 percent) was paid out of pocket by patients (see Figure E-7).
Not surprisingly, payor distribution differs by age because most people enroll in Medicare at age 65. The primary difference in payor by age group is a shift from private insurance as payor for those younger than 65 to Medicare as payor for those 65 and older (see Figure E-8).
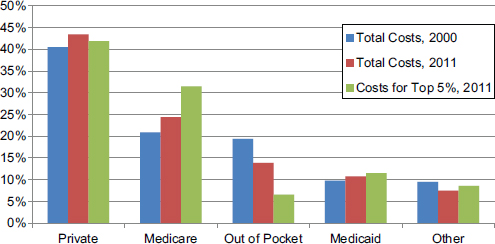
FIGURE E-7 Proportion of health care costs by payor, 2000 and 2011.
NOTE: This figure does not include the nursing home population because data on this population for 2000 were not available.
SOURCE: 2011 Medical Expenditure Panel Survey data (AHRQ and HHS, 2011).
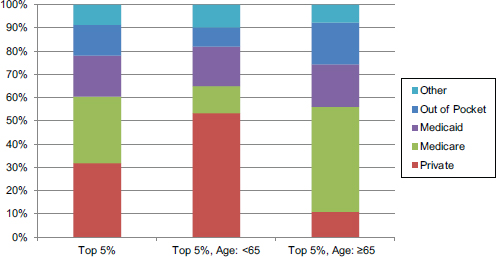
FIGURE E-8 Proportion of health care costs by payor for those younger than 65 and 65 and older.
SOURCE: 2011 Medical Expenditure Panel Survey data (AHRQ and HHS, 2011), adjusted to include the nursing home population (CMS, 2012, 2014; National Center for Health Statistics, 2013; Sing et al., 2006); payor data for the nursing home population were obtained from Moses et al. (2013) and assumed to be the same for the younger than 65 and 65 and older nursing home populations.
Epidemiology of Chronic Conditions
Overall, individuals aged 65 and older have a higher prevalence of chronic conditions and functional limitations (48 percent) compared with those younger than 65 (9 percent). Because of the large size of the population younger than 65, however, that population has a greater absolute number of individuals with chronic conditions and functional limitations (24 million, as compared with 22 million aged 65 or older).
For community-dwelling individuals with both chronic conditions and functional limitations, the most prevalent chronic conditions are hypertension, lipid metabolism disorder, arthritis disorders, and depressive disorders (The Lewin Group, 2010). The chronic conditions of allergies, chronic sinusitis, and asthma are more frequent among those with chronic conditions only than among those with both chronic conditions and functional limitations (The Lewin Group, 2010).
To best understand groups of chronic conditions, CDC has used the National Health Interview Survey to report the most common chronic condition triads among civilian, noninstitutionalized U.S. adults with at least three chronic conditions (Ward and Schiller, 2013) (see Table E-4).
TABLE E-4 Most Prevalent Chronic Condition Triads Among U.S. Adults, 2010
| Sex, Age, and Triad | % (95% Confidence Interval) | |
| Men | ||
| Ages 18-44 | ||
|
Arthritis/diabetes/hypertension |
26.1 (16.70-38.45) 15.5 (7.73-28.73) 14.6 (7.17-27.31) 12.2 (6.47-21.79) 7.3 (3.23-15.83) |
|
| Ages 45-64 | ||
|
Arthritis/diabetes/hypertension |
28.3 (24.34-32.66) 17.9 (14.52-21.86) 14.5 (11.37-18.22) 11.2 (8.61-14.53) 10.6 (8.03-13.91) |
|
| Ages ≥65 | ||
|
Arthritis/diabetes/hypertension |
28.2 (24.67-32.06) 27.5 (23.97-31.31) 27.2 (23.43-31.26) 17.8 (14.66-21.48) 14.6 (11.82-18.01) |
|
| Women | ||
| Ages 18-44 | ||
|
Arthritis/asthma/COPD Arthritis/asthma/hypertension |
24.7 (17.68-33.50) 21.3 (15.09-29.09) 19.8 (13.64-27.89) 19.7 (13.82-27.32) 14.4 (9.65-21.03) |
|
| Ages 45-64 | ||
|
Arthritis/diabetes/hypertension |
30.5 (27.24-34.02) 22.0 (19.00-25.35) 18.4 (15.59-21.52) 16.7 (13.80-20.09) 14.4 (12.08-17.16) |
|
| Ages ≥65 | ||
|
Arthritis/diabetes/hypertension |
32.6 (29.36-35.95) 26.9 (23.95-30.13) 19.3 (16.44-22.41) 16.8 (14.19-19.84) 16.5 (13.95-19.38) |
|
NOTES: This table does not include the nursing home population. CHD = coronary heart disease; COPD = chronic obstructive pulmonary disease.
SOURCE: CDC, National Health Interview Survey, 2010 (Ward and Schiller, 2013).
The most prevalent triads of conditions were found to vary by both gender and age.
The Nursing Home Population
We estimate that in 2011, total health care costs related to residents of nursing facilities and continuing care retirement communities accounted for $296 billion, or 11 percent of the $2.7 trillion in total national health care expenditures and 18 percent of the $1.6 trillion in patient care–related expenditures analyzed in this report. This estimate is based on information from the National Health Expenditure Accounts (CMS, 2014), which report expenditures from nursing facilities for the care of their residents, in addition to estimates of the care of nursing home residents received outside of nursing facilities, such as during hospital stays (Sing et al., 2006). As of 2011, there were 1.4 million Americans residing in nursing facilities (National Center for Health Statistics, 2013). Thus, we estimate that the average annual health expenditure per nursing home resident is more than $200,000, which is significantly higher than the $17,500 minimum average annual health expenditure required to be in the top 5 percent of health care spenders based on MEPS data (AHRQ and HHS, 2011). Given that we do not have access to data on the distribution of health care expenditures for nursing home residents, we categorized the entire nursing home population as being in the top 5 percent of spenders in all analyses in this appendix. Further, given estimates that nearly all nursing home residents have at least one chronic condition and require assistance with one or more ADLs (Hing, 1989), we categorized the entire nursing home resident population as having both chronic conditions and functional limitations in this appendix.
In 2006, the most recent year for which data are available, 2.2 million (6 percent)
of the Medicare population spent some portion of the year residing in a nursing home, and half of these individuals resided there for the full year. Nursing home residence is concentrated near the end of life and approaches 40 percent at the time of death (based on our analyses of the Health and Retirement Study [HRS] Medicare population). Much of this end-of-life nursing home care is provided under the skilled nursing facility (SNF)
Medicare benefit, with nearly one in three Medicare beneficiaries using this benefit at some point during the last 6 months of life (Aragon et al., 2012). In addition, Medicare beneficiaries residing in nursing homes incur high costs related to hospitalizations (see Figure E-9). It is estimated that approximately 24 percent of these hospitalizations are related to ambulatory care–sensitive conditions and are therefore potentially preventable. This rate is even higher (30 percent) during a beneficiary’s first 6 months following nursing home admission (Jacobson et al., 2010).
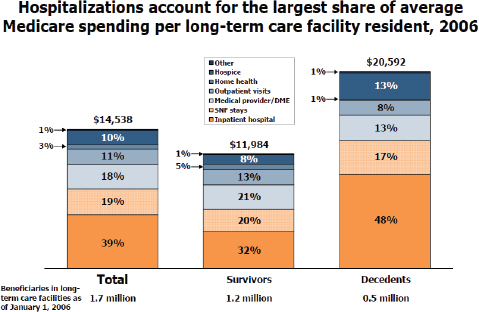
FIGURE E-9 Proportion of Medicare spending on hospital services among nursing home residents.
NOTE: Includes beneficiaries who were in long-term care facilities as of January 1, 2006, including those who died before the end of 2006. Excludes Medicare Advantage enrollees’ spending. Excludes Medicare prescription of drug spending. DME = durable medical equipment; SNF = skilled nursing facility.
SOURCE: Jacobson et al., 2010. Reprinted with permission from The Henry J. Kaiser Family Foundation.
COST OF CARE AT THE END OF LIFE
Magnitude and Proportion of U.S. Health Care Spending on Decedents
We estimate that approximately 13 percent of the $1.6 trillion in health care costs is for the care of individuals in their last year of life (see Figure E-10). We computed this estimate using information from the HRS regarding the cost of care for individuals in the last year of life paid by Medicare, adjusted to account for the fact that 39 percent of costs in the last year of life are paid by sources other than Medicare, including Medicaid (10 percent), out of pocket (18 percent, primarily for nursing home care), and other sources (including private payers) (11 percent) (Hogan et
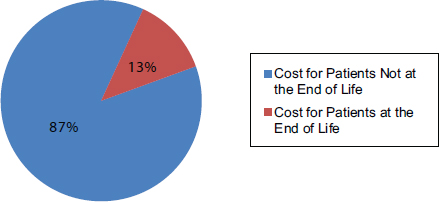
FIGURE E-10 Proportion of total health care costs for patients at the end of life.
SOURCE: Numerator: Health and Retirement Study and linked Medicare data, decedents 2000-2008; adjusted to include non-Medicare payors (Hogan et al., 2001), and adjusted to 2011 dollars using the Bureau of Labor Statistics Consumer Price Index. Denominator: CMS 2011 National Health Expenditure report (CMS, 2014), with adjustments based on estimates from Sing and colleagues (2006) and the 2011 Medical Expenditure Panel Survey data (AHRQ and HHS, 2011) (see Figure E-1).
al., 2001), and adjusted to 2011 dollars using the Bureau of Labor Statistics Consumer Price Index. We then applied this estimated per person cost of care in the last year of life to the total number of deaths in 2011 to obtain the numerator of the 13 percent estimate shown in Figure E-10. As noted, the majority of costs in the last year of life (61 percent) are paid for by Medicare. Because of this, as well as the fact that Medicare is a readily available dataset for analysis, many analyses of the health care costs for decedents use estimates derived only from Medicare claims data. We consider this a limitation of the existing evidence regarding health care costs of decedents and have refined these analyses to estimate total health care costs in this appendix.
During 2012, enrollment in Medicare averaged about 50 million people. Net spending for the program was $466 billion. The Congressional Budget Office (CBO) expects Medicare spending to climb rapidly over the next decade, in part as a result of the retirement of the baby boomers (CBO, undated). This rate of spending is widely believed to be unsustainable, and the high rate of spending near the end of life is often cited as an area to examine for potential cost savings. Each year approximately 5 percent of fee-for-service (FFS) elderly Medicare beneficiaries die (Riley and Lubitz, 2010).
Change in Spending on Decedents Over Time
Medicare expenditures in the last year of life average 5 times greater than those in nonterminal years, and in recent years this end-of-life spending has accounted for approximately one-quarter of overall Medicare expenditures (see Figure E-11) (CMS, 2011; Hogan et al., 2001; Hoover et al., 2002; Lubitz and Riley, 1993; Riley and Lubitz, 2010). Over the past 30 years, overall health care costs have been climbing, but the proportion of spending by Medicare for decedents has been stable. The share of Medicare payments going to persons in their last year of life declined slightly from 28.3 percent in 1978 to 25.1 percent in 2006. After adjustment for age, sex, and death rates, however, there was no significant trend (see Figure E-12).
Variation in Spending Among Decedents
It is important to note that not all deaths result in high spending, and not all high spending occurs near death. For example, based upon data from the Medicare FFS population within the nationally representative HRS cohort adjusted to 2011 dollars, we find that while mean Medicare spending in the last year of life is $50,576 (median $37,152), 25 percent of beneficiaries incur $15,895 or less in Medicare spending in the final year of
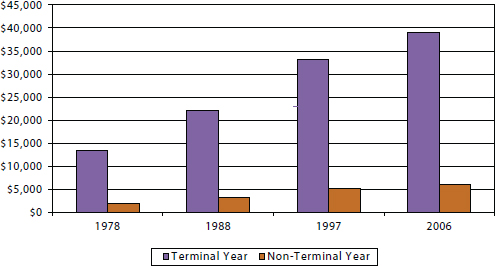
FIGURE E-11 Average per person spending on health care among decedents, 1978-2006.
SOURCE: Riley and Lubitz, 2010.
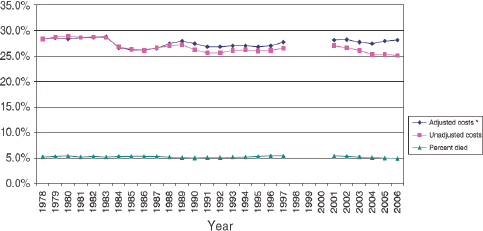
FIGURE E-12 Percentage dying and percentage of Medicare payments spent in the last 12 months of life among fee-for-service Medicare beneficiaries aged 65 and older, 1978-2006.
NOTES: Payment data not available for years 1998-2000.
*Costs adjusted for age, sex, and survival status of the 1978 sample.
SOURCE: Riley and Lubitz, 2010. Reprinted with permission from John Wiley and Sons. © Health Research and Educational Trust.
life. As Medicare spending accounts for approximately 60 percent of total health care spending (Hogan et al., 2001), we estimate that mean total health care spending in the last year of life is $82,911 (median $60,904), and 25 percent of beneficiaries incur $26,057 or less in spending in the final year of life (see Figure E-13).
Characteristics Associated with Increased Spending
Prior research has revealed significant variation in end-of-life health care spending across patient groups, hospitals, and geographic regions. The following subsections highlight several characteristics that have consistently been shown to be associated with variations in spending at the end of life. As previously mentioned, most existing analyses highlight only the characteristics of the Medicare population rather than the population of decedents as a whole.
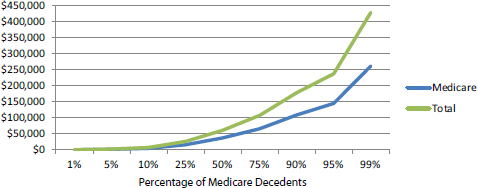
FIGURE E-13 Distribution of total health care and total Medicare spending in the last year of life among Medicare beneficiaries.
SOURCE: Health and Retirement Study and linked Medicare data, decedents 2000-2008, adjusted to 2011 dollar value using the Bureau of Labor Statistics Consumer Price Index.
Demographic Characteristics
Medicare expenditures in the last year of life decrease with age, especially for those aged 85 or older (see Figure E-14). This is in large part because the intensity of medical care in the last year of life decreases with increasing age (Levinsky et al., 2001; Kelley et al., 2011, 2012; Tschirhart et al., 2013). Race and ethnicity have also consistently demonstrated strong associations with costs of end-of-life health care. Hanchate and colleagues (2009), as one example, found that in the final 6 months of life, Medicare costs for non-Hispanic white patients averaged $20,166, while costs among black patients averaged $26,704 (32 percent higher) and among Hispanics, $31,702 (57 percent higher) (see Figure E-15) (Hanchate et al., 2009). The higher costs for Hispanics and blacks were attributed to greater use of hospital-based, life-sustaining interventions, including being more likely to be admitted to the intensive care unit (ICU) (39.6 for Hispanics, 32.5 percent for blacks, and 27.0 percent for whites); more intensive procedures, such as resuscitation and cardiac conversion (4.0 percent of Hispanics, 4.4 percent of blacks, and 2.7 percent of whites); mechanical ventilation (21.0 percent for Hispanics, 18.0 percent for blacks, and 11.6 percent for whites); and gastrostomy for artificial nutrition (9.1 percent for Hispanics, 10.5 percent for blacks, and 4.1 percent for whites) (Hanchate et al., 2009).
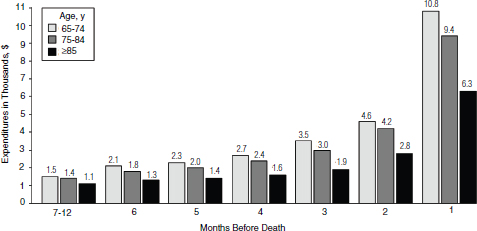
FIGURE E-14 Medicare spending in the last 12 months of life by age.
SOURCE: Levinsky et al., 2001. Reprinted with permission from the American Medical Association. Copyright © (2001) American Medical Association. All rights reserved.
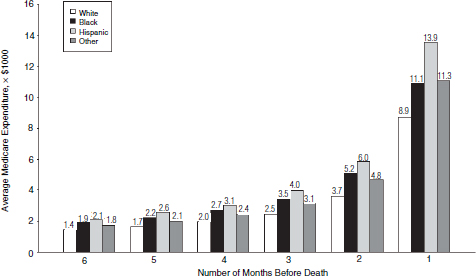
FIGURE E-15 Medicare spending in the last 6 months of life by race and ethnicity.
SOURCE: Hanchate et al., 2009. Reprinted with permission from the American Medical Association. Copyright © (2009) American Medical Association. All rights reserved.
Health Characteristics: Medical Conditions, Physical Function, and Debility
As described above, chronic conditions and functional limitations are associated with high health care spending. These relationships are also observed among decedents (see Table E-5).
In addition to chronic conditions and functional limitations, a few life-limiting conditions and catastrophic health events, such as advanced cancer or stroke, are also associated with higher costs at the end of life. Specific conditions and the different trajectories of functional decline seen with them are associated with different spending patterns prior to death. For example, functional decline may be due to progression of a chronic disease, such as chronic obstructive pulmonary disease (COPD), or the accumulation of multimorbidity or frailty, and in such cases this decline typically results in a steadily increasing pattern of health care spending (Chan et al., 2002; Lunney et al., 2002, 2003). Alternatively, people dying from single organ failure, such as congestive heart failure, may experience gradually diminishing physical function with periodic exacerbations of their illness, thus incurring very high episodic spending before death. Others who die suddenly, possibly from a stroke or motor vehicle accident, may incur little health care spending in their last year of life (Lunney et al., 2002, 2003). One recent study examined the impact of medical conditions and functional
TABLE E-5 Health Care Costs Among Medicare Fee-for-Service Beneficiaries by Chronic Conditions and by Functional Limitations in the Last Year of Life
| No. of People | % | Total Health Care Costs | % | |
| Age: 65 or older, FFS Medicare beneficiaries | ||||
|
No chronic conditions or functional limitations |
15,484 | 1 | $39,771,569 | 0 |
|
Chronic conditions only |
411,774 | 28 | 28,271,965,777 | 23 |
|
Functional limitations only |
20,323 | 1 | 613,233,917 | 0.5 |
|
Chronic conditions and functional limitations |
1,037,419 | 70 | 94,197,646,891 | 77 |
NOTES: Functional limitation defined as needing help with any activities of daily living. Medicare costs represent on average 61 percent of total health care costs (Hogan et al., 2001). FFS = fee for service.
SOURCE: Health and Retirement Study and linked Medicare data, decedents 2000-2008, scaled to the full Medicare population and costs adjusted to 2011 dollars using the Bureau of Labor Statistics Consumer Price Index.
TABLE E-6 Association of Functional Status and Medical Conditions with Medicare Costs in the Last 6 Months of Life
| Patient Characteristics | Adjusted Rate Ratio | 95% Confidence Interval |
| Functional status (reference: independent in activities of daily living) | ||
|
Stable moderate impairment |
1.12 | 0.92-1.36 |
|
Stable severe impairment |
1.20 | 1.04-1.39 |
|
Decline from independent to moderate impairment |
1.34 | 1.15-1.56 |
|
Decline from moderate to severe impairment |
1.42 | 1.23-1.64 |
|
Decline from independent to severe impairment |
1.64 | 1.46-1.84 |
| Dementia/Alzheimer’s disease | 0.78 | 0.70-0.86 |
| Diabetes | 1.14 | 1.04-1.24 |
| Chronic kidney disease | 1.24 | 1.11-1.38 |
| Stroke/transient ischemic attack | 1.15 | 1.04-1.28 |
| Congestive heart failure | 1.08 | 0.98-1.18 |
| Cancer | 1.06 | 0.95-1.19 |
| Chronic obstructive pulmonary disease | 1.03 | 0.95-1.13 |
| Depression | 1.03 | 0.92-1.15 |
SOURCE: Health and Retirement Study and linked Medicare data, decedents 2000-2008. Adjusted for age, race, ethnicity, education, net worth, Medicaid, Medigap, nursing home residence, relative nearby, religiosity, Self Reported Health, three other chronic conditions, advance directive, regional hospital beds, and local pattern of end-of-life spending (Kelley et al., 2011).
decline simultaneously on end-of-life Medicare costs and demonstrated an independent and dose effect–like association between functional decline and increasing health care costs (Kelley et al., 2011). For example, a person experiencing a decline from functional independence to needing assistance with one ADL incurred 34 percent higher Medicare costs, all other factors being held equal, while a decline from independence to needing help with four or more ADLs was associated with 64 percent higher costs (see Table E-6).
Notably, this study found a negative association between dementia and total end-of-life Medicare costs, after adjusting for functional status, nursing home residence, and other characteristics. Patients suffering with dementia typically experience a long, slowly debilitating course of illness. A large portion of their health care expenses is focused on custodial and supportive care services, which are not covered by Medicare and therefore
not represented in this study. A recent analysis of total health care costs associated with dementia found that the yearly costs per person attributable to dementia were approximately $50,000 (2010 U.S. dollars) (Hurd et al., 2013).
Advance Care Planning, Personal Preferences, and Goals of Care Discussions
Evidence is mixed regarding the impact of patient preferences on health care costs and treatment received. Many studies reveal a poor correlation. In the Study to Understand Prognoses and Preferences for Outcomes and Risks of Treatments (SUPPORT) trial, 35 percent of patients reported care conflicting with preferences, and such discord was associated with higher costs (Teno et al., 2002). In the same study, investigators found that the risk of in-hospital death, a marker of high end-of-life health care costs, was associated with greater hospital bed availability and not associated with patient preferences (Pritchard et al., 1998). Similarly, a prospective study of patient preferences for life-sustaining treatment found no relationship with treatment received (Danis et al., 1996).
However, conflicting evidence does exist. A study of the association between treatment-limiting advance directives and Medicare costs revealed a significant correlation with lower costs, but only within regions with patterns of high end-of-life health care spending (p = 0.04) (Nicholas et al., 2011). Zhang and colleagues (2009) found that among patients with advanced cancer, the cost of health care in the last week of life was 35.7 percent lower among patients who had reported discussions of end-of-life care preferences (p = 0.002).
Regional Variation
The wide variation in health care spending by geographic region has been the focus of extensive research and policy debate over the past three decades. The Dartmouth Atlas of Health Care, a leading contributor to this research, has focused primarily on Medicare spending, with particular interest in spending and patterns of utilization at the end of life. This work has highlighted a four-fold difference in Medicare end-of-life spending across geographic regions (see Figure E-16) (Fisher et al., 2003a).
Policy makers have seized upon these findings and suggested reform measures that would penalize high-spending and reward low-spending regions. An Institute of Medicine (2013) report, Variation in Health Care Spending: Target Decision Making, Not Geography, also notes wide regional variation in Medicare spending, but identifies the greatest variation in the use of post-acute services as opposed to hospital services. In addition,
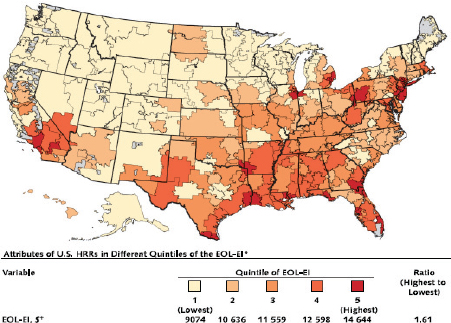
FIGURE E-16 Quintiles of Medicare spending in the last 2 years of life by region.
SOURCE: Fisher et al., 2003a. Reprinted with permission from Annals of Internal Medicine.
the report cites wide regional variation in spending among private insurers; however, these patterns are not congruent with the patterns observed in Medicare and are more strongly related to differences in pricing. In sum, the report recommends against a geography-based value index or adjustment for Medicare services and instead suggests policies to promote high-value, patient-centered care.
Personal and Regional Factors Examined Simultaneously
A notable weakness in prior studies of regional variation is the inability to control adequately for severity of illness by studying claims or administrative data alone. This method also fails to assess and adjust for many of the other patient factors, such as function, that are known to be associated with spending. A recent examination of determinants of Medicare expenditures in the last 6 months of life aimed to consider simultaneously the influence of patients’ social, medical, and functional characteristics while also adjusting for regional practice patterns and sup-
ply of medical resources, such as hospital beds and medical subspecialists. As hypothesized, this analysis revealed a strong, independent association of functional debility and decline with higher Medicare expenditures, and the same for selected medical conditions. In addition, after controlling for an extensive group of personal and health characteristics, regional factors continued to be significantly associated with Medicare costs. For example, a person in a region within the second quintile of practice pattern intensity, as measured by Dartmouth’s End-of-Life Expenditure Index, incurs 10 percent more Medicare expenditures in the last 6 months of life than a person in a region within the lowest quintile, holding all other characteristics equal. Furthermore, each additional hospital bed per 10,000 residents was found to increase Medicare expenditures in the last 6 months of life by 1 percent if all other factors were held equal (Kelley et al., 2011). These findings support an independent effect of regional characteristics on health care spending, beyond the effect of patient-level factors.
Model or Settings of Care: Hospital Use
Hospital use accounts for the largest portion of Medicare expenditures near the end of life (CBO, undated; CMS, 2011). Over the past 30 years, overall use of hospital and ICU services has increased, while proportionally this use among decedents has remained stable (see Table E-7) (Riley and Lubitz, 2010). Wide variation in use of these services has also been noted
TABLE E-7 Measures of Inpatient Hospital Use Among Medicare Beneficiaries Aged 65 and Older by Survival Status, 1978-2006
| Utilization Measure and Survival Status | 1978 | 1988 | 1997 | 2002 | 2006 |
| Percentage Hospitalized | |||||
|
March decedents |
64.5 | 63.7 | 62.6 | 62.8 | 62.5 |
|
Survivors |
18.5 | 16.1 | 16.5 | 17.0 | 16.7 |
| Percentage Undergoing Multiple | |||||
| Hospitalizations | |||||
|
March decedents |
20.3 | 22.2 | 24.5 | 25.6 | 27.0 |
|
Survivors |
5.2 | 4.8 | 5.6 | 5.9 | 5.6 |
| Percentage Using ICU/CCU | |||||
| Services | |||||
|
March decedents |
N/A | 27.7 | 28.7 | 30.7 | 33.1 |
|
Survivors |
N/A | 4.6 | 5.6 | 6.1 | 6.3 |
NOTES: p <0.05 for positive linear trend in multiple hospitalizations for decedents and in ICU use for both decedents and survivors. Trends in multiple hospitalizations for survivors and percentage hospitalized for decedents and survivors were not statistically significant (Riley and Lubitz, 2010). CCU = critical care unit; ICU = intensive care unit.
SOURCE: Medicare Continuous History Sample, Fee-for-Service Medicare beneficiaries.
across beneficiaries and geographic regions. Among the decedent Medicare beneficiaries within the HRS cohort, one-quarter had no hospital days within the last 6 months of life, while 40 percent had 10 or more days. In an examination of the personal and regional factors associated with greater hospital use, one study found higher hospital use among all subjects with functional decline and those with stable severe functional disability compared with those functionally independent in their ADLs. For example, those declining from independence to severe debility experienced more than 9 additional hospital days in the last 6 months of life, other factors being held equal (Kelley et al., 2012). This study also revealed greater hospital use among blacks (6 more days on average) and Hispanics (5 more days).
PUTTING IT TOGETHER: THE INTERSECTION OF THE HIGH-COST AND END-OF-LIFE POPULATIONS
Estimating the Overlap in Population
Using our analyses of the population with the highest annual health care costs and the population at the end of life, we have generated an estimate of the overlap between these two groups. Specifically, of the estimated 18.2 million individuals annually who are in the 5 percent of the population with the highest health care costs, 11 percent (2.0 million) are in their last year of life (see Figure E-17). Further, of the 2.5 million annual deaths in the United States, 80 percent (2.0 million) were among individuals who incurred health care costs in their last year of life that place them in the top 5 percent of all spenders, while 20 percent (0.5 million) did not incur high health care costs in their last year of life.
Identifying Illness Trajectories
Given the relatively small proportion of the population with the highest health care costs who are at the end of life (11 percent), it is critical to gain a deeper understanding of the likely illness trajectories of the other 89 percent. We estimate that the population with the highest annual health care costs can be divided into three potential illness trajectories (see Figure E-18):
- individuals who have high health care costs because it is their last year of life (population at the end of life);
- individuals who persistently generate high annual health care costs due to chronic conditions, functional limitations, or other conditions who are not in their last year of life and who live for many
- years, generating high health care expenses (population with persistently high costs); and
- individuals who experience a significant health event in one year but who return to normal health (population with a discrete high-cost event).
We estimate that the largest proportion of the population with the highest annual health care expenditures are individuals who experience a
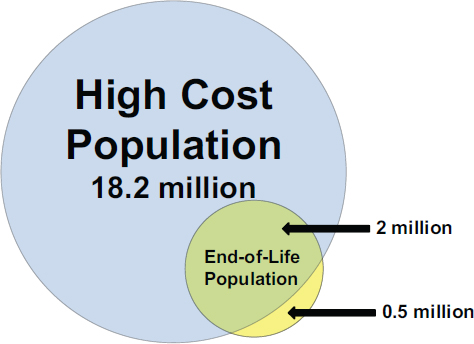
FIGURE E-17 Estimated overlap between the population with the highest health care costs and the population at the end of life.
NOTE: The entire nursing home population is estimated to be in the top 5 percent of total health care spending (see the earlier section on the nursing home population for details).
SOURCE: Total population and health care costs were obtained from the 2011 Medical Expenditure Panel Survey data (AHRQ and HHS, 2011), adjusted to include the nursing home population (National Center for Health Statistics, 2013). The distribution of total costs for the end-of-life population was estimated from the Health and Retirement Study and linked Medicare data, decedents 2000-2008, adjusted to include non-Medicare payors (Hogan et al., 2001) and adjusted to 2011 dollars using the Bureau of Labor Statistics Consumer Price Index.
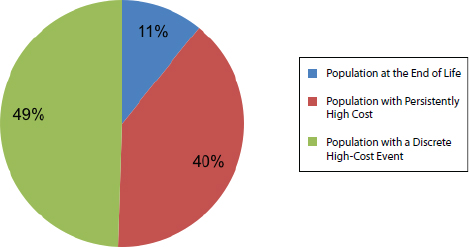
FIGURE E-18 Population with the highest health care costs (top 5 percent) by illness trajectory.
NOTES: The entire nursing home population is estimated to be in the top 5 percent of total health care spending (see the earlier section on the nursing home population for details). For a description of the calculation of illness trajectory groupings, see the discussion below.
SOURCE: 2011 Medical Expenditure Panel Survey data (AHRQ and HHS, 2011), adjusted to include the nursing home population (National Center for Health Statistics, 2013).
discrete event generating significant health care costs in a given year. We used evidence from a recent study (NIHCM Foundation, 2012) regarding the persistence of spending patterns over time. This study found that of individuals in the top 5 percent of health care spending in a given year, 62 percent were no longer in the top 5 percent of spending the next year. A portion of these individuals died; the rest transitioned to the bottom 95th percentile in health care spending the following year. Some examples of this illness trajectory might include people who have a myocardial infarction, undergo coronary bypass graft surgery, and return to stable good health after a period of rehabilitation; individuals who are diagnosed with early-stage cancer, complete surgical resection and other first-line therapies, and achieve complete remission; or people who are waiting for a kidney transplant on frequent hemodialysis and then receive a transplant and return to stable health. There may be relatively less opportunity for cost reductions in this population because many high-cost events may be unavoidable. Furthermore, given that most of these individuals return to better health (or at
least return to the lower-cost population) within 1 year, health care dollars may already be well spent for them.
Population with Persistently High Costs (40 percent)
The second largest proportion of the high-cost population is those with persistently high health care costs. This subgroup is most likely characterized by the chronic conditions and functional limitations described earlier. Evidence suggests that this population tends to be older. A recent study (Cohen and Yu, 2012; NIHCM Foundation, 2012) revealed that among the population in the top 10 percent of health care spending persistently over a 2-year period, 42.9 percent were aged 65 or older, compared with only 19.2 percent of individuals who shifted from the top 10 percent to the bottom 75 percent in the following year. The existence of a subgroup of individuals with persistently high spending was also evident in an analysis of Medicare beneficiaries in which it was found that nearly half of beneficiaries who were high cost in 1997 were also high cost in 1996, and more than 25 percent were also high cost 4 years previously (CBO, 2005). Furthermore, 44 percent of those individuals remained high cost in 1998, and 25 percent were high cost in 2001 (see Figure E-19). This may be a key population for targeted interventions to reduce costs because such interventions may enable cost reductions across multiple years.
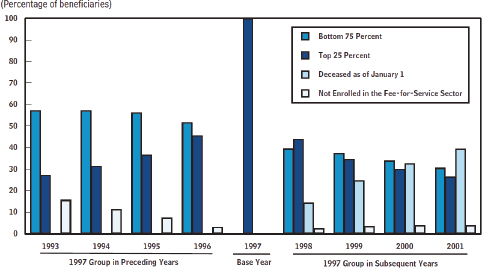
FIGURE E-19 Expenditure history of Medicare beneficiaries who constituted the top 25 percent of spending in 1997.
SOURCE: CBO, 2005.
Population at the End of Life (11 percent)
As described earlier, 80 percent of those in the last year of life are among the high-cost population. Functional debility and decline are strongly correlated with being among the highest spenders. In addition, some chronic illnesses, including diabetes, chronic kidney disease, dementia, and others, are associated with high health care costs, particularly in the setting of functional decline. Race and ethnicity are also noted to be consistent predictors of higher costs, although the reason for this association remains unclear, and it may be an artifact of poor-quality care or limited access to care over the life span (IOM, 2002). Finally, regional differences in spending and use of specific health care services, including hospital and ICU care, persist in studies controlling for patient factors.
Limitations and Gaps in the Evidence
Throughout this analysis, we have aggregated existing statistics and evidence and combined them with our own analyses and estimates. In a number of areas, the evidence presented here is limited by incomplete data. Studies of hospital and regional variation using only administrative claims do not adjust sufficiently for patient risk factors (i.e., health, function, and socioeconomic status) or patient preferences. Additionally, most prior studies have focused on single diseases or a single predictive factor in isolation, and thus are not generalizable to the broader population of seriously ill older adults with multiple chronic illnesses or advanced organ failure (Emanuel et al., 2003; Hamel et al., 1999; Shugarman et al., 2007; Zhang et al., 2003).
Additionally, measurement of diagnoses within administrative data does not adequately measure severity of illness. Variation exists in regional practice patterns in the use of diagnostic testing and billing codes, creating the potential for bias in analyses based on the measurement of chronic disease or total disease burden (Song et al., 2010; Welch et al., 2011). Many studies of the costs of care at the end of life have been retrospective mortality follow-back studies of decedents and are subject to selection bias because they cannot account for those who survived despite a high risk of death (Bach et al., 2004). These data, therefore, are particularly difficult to translate to policy or service design given the prognostic uncertainty associated with serious illness in real clinical settings.
Finally, as described earlier, we have made a number of assumptions regarding health care expenditures for nursing home residents given a lack of detailed data on this population. Further, our cost analyses do not include estimates for costs such as informal caregiving and lost wages. Consideration of these costs must be included in the context of any new or reformed
design of health services because the economic implications of these costs for the aging population are potentially profound.
CONCLUSIONS AND RECOMMENDATIONS
Conclusions
Our analyses lead to the following conclusions:
- Although many proposals to reduce health care costs target the high cost of end-of-life care, on a population level, the cost of caring for individuals in their last year of life represents 13 percent of total annual health care spending, and these individuals make up just over 10 percent of the high-cost population.
- The population with both chronic conditions and functional limitations is a key driver of high health care costs. The addition of functional limitations appears to differentiate a high-cost group within those with chronic conditions and may characterize those who are persistently in the high-cost group.
- Instead of a focus on chronic conditions alone, a clinical indicator of one’s potential to accrue high health care costs may be the onset of need for help with daily activities (functional limitations) in an individual with chronic conditions.
- Although older age may be a risk factor for higher health care costs, older adults make up the minority of the high-cost spenders. The proportion of total annual health care spending for the population aged 65 or older has not changed materially in a decade.
- Current data indicate that increased health care spending is not associated with higher-quality care, as measured by longevity, quality of life, and satisfaction (Fisher et al., 2003a,b; Mittler et al., 2010; Skinner et al., 2009; Wennberg et al., 2009; Yasaitis et al., 2009). Other studies of adults with serious illness suggest high-cost hospital-based treatment is often inconsistent with patient preferences and may contribute to patient suffering (Pritchard et al., 1998; Teno et al., 2002, 2007; Yasaitis et al., 2009; Zhang et al., 2009).
Maximizing value (i.e., increasing quality while reducing costs) in the care of the highest-cost, seriously ill individuals is a major challenge facing the nation’s health care system and economy. The greatest strides in improving the quality and containing the costs of health care for the highest-cost population will be achieved by focusing research and clinical interventions
on those with functional debility, chronic illnesses, and patterns of high health care utilization.
Recommendations
Our recommendations encompass expanding programs that already work to address high-cost populations; developing new programs or policies that better match patient needs with services; and considering the most appropriate target population for interventions based on population size, health care costs, and potential for health care savings.
Models That Currently Work to Align Patient Goals with Treatment and Lower Costs
Palliative care A recent study examined the effect on hospital costs of palliative care team consultations for patients enrolled in Medicaid at four New York State hospitals and found that, on average, patients who received palliative care incurred $6,900 less in hospital costs during a given admission than a matched group of patients who received usual care. These reductions included $4,098 in hospital costs per admission for patients discharged alive and $7,563 for patients who died in the hospital. In addition, palliative care recipients spent less time in intensive care, were less likely to die in ICUs, and were more likely to receive hospice referrals than the matched usual care patients (Morrison et al., 2011). Similarly, a randomized controlled trial of palliative care in addition to usual care among patients newly diagnosed with stage IV non-small-cell lung cancer found that those in the intervention (palliative care) group had lower rates of emergency department visits and hospital admissions within the last 30 days of life, and they were less likely to receive chemotherapy within the last 14 days and more likely to be referred to hospice 4 days or longer prior to death. All measures are indicative of higher-quality and lower-cost end-of-life care (Temel et al., 2010).
Hospice Unlike palliative care, which is appropriate at any stage of serious illness, hospice is specific to care at the end of life. Hospice enrollment is restricted to patients with an estimated prognosis of 6 months or less and requires that patients forgo “curative” or disease-directed treatments. While extensive data support the high quality of hospice care, the impact of hospice enrollment on health care costs has been debated. A study (Kelley et al., 2013) using the HRS cohort decedent sample examined the impact on Medicare expenditures of hospice enrollment 1-7, 8-14, 15-30, and 53-105
days prior to death. Within all periods studied, hospice patients had significantly lower Medicare costs and lower rates of hospital and intensive care use, hospital readmission, and in-hospital death compared with propensity score-matched nonhospice controls. For example, patients being enrolled in hospice for 15-30 days resulted in $6,430 in savings to Medicare on average (see Figure E-20); patients enrolled in hospice for 53-105 days had 9 fewer hospital and 5 fewer ICU days compared with patients receiving usual care; and patients enrolled in hospice for 53-105 days had 15 percent fewer hospital readmissions and 40 percent fewer in-hospital deaths compared with patients receiving usual care.
Similarly, a study (Carlson et al., 2010) that followed more than 90,000 individuals with cancer found that total Medicare costs were significantly lower for those who remained continuously enrolled in hospice until death compared with those who disenrolled from hospice. The 11 percent of patients who disenrolled from hospice were more likely to be hospitalized (39.8 percent versus 1.6 percent), more likely to be admitted to the emergency department (33.9 percent versus 3.1 percent) or ICU (5.7 percent versus 0.1 percent), and more likely to die in the hospital (9.6 percent versus 0.2 percent). Patients who disenrolled from hospice died a median of 24 days following disenrollment, suggesting that the reason for hospice disenrollment was not improved health. Hospice disenrollees incurred higher
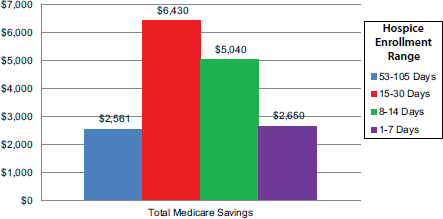
FIGURE E-20 Incremental effect of hospice enrollment on Medicare costs.
SOURCE: A version of this figure appears in Kelley et al., 2013. Reprinted with permission from Project HOPE/Health Affairs.
TABLE E-8 Hospice Enrollment Policies Potentially Restricting Access to Hospice Care, National Hospice Survey Data, 2008-2009
| Policy | Percentage of Hospices (N = 591) |
| Patient cannot be receiving chemotherapy | 61 |
| Patient cannot be receiving total parenteral nutrition | 55 |
| Patient cannot be receiving transfusions | 40 |
| Patient cannot need an intrathecal catheter | 32 |
| Patient cannot continue to receive palliative radiation | 30 |
| Patient must have a caregiver at home | 12 |
| Patient cannot be receiving tube feeding | 8 |
| Hospice has all restrictive enrollment policies | 0.8 |
| Hospice has no restrictive enrollment policies | 22 |
SOURCE: Aldridge et al., 2012.
per-day Medicare expenditures than patients who remained with hospice until death.
Despite the benefits of hospice for patients and families and the potential cost savings from greater hospice use, there are limitations in attempting to expand access to hospice care to a wider population. In addition to the eligibility criteria, which are considered a significant barrier to greater hospice use, hospices have been found to have varying enrollment policies aimed at restricting access to hospice care for potentially high-cost patients. A national survey of the enrollment policies of 591 U.S. hospices found that 78 percent of hospices had at least one enrollment policy that could restrict access to care for patients with potentially high-cost medical care needs, such as chemotherapy or total parenteral nutrition (see Table E-8) (Aldridge et al., 2012). This is particularly concerning given that the most complex patients and those with significant functional limitations may be those most in need of home-based palliative care, and yet hospices that could potentially provide such care may not be willing to take on such patients because of cost concerns. Smaller hospices, for-profit hospices, and hospices in certain regions of the country consistently reported more limited enrollment policies.
Programs aimed at improving health care services and reducing costs at the end of life will continue to be limited by physicians’ inability to predict mortality accurately. In addition, interventions focused only on those near death will have limited opportunity to impact costs given the limited time span following intervention. Identifying patients with serious illness—that is, functional limitations and progressive chronic disease or organ failure—
is the first step in recognizing individuals who may be at risk of high-cost treatment. The additional factors noted above—race/ethnicity and regional patterns of care—require further study, but are clearly factors to consider in deploying limited resources and targeted efforts to improve the quality of communication and health care decision making.
Program of All-inclusive Care for the Elderly Those individuals eligible for both Medicare and Medicaid, the “dual-eligibles,” are frequently among the highest-cost population. One program seeking to address both the care needs and the growing health care expenses of the dual-eligible population is the Program of All-inclusive Care for the Elderly (PACE). PACE is a long-term care delivery and financing program designed to provide comprehensive community-based care and prevent unnecessary use of hospital and nursing home care (Eng et al., 1997). Initial results from the PACE program in the 1990s demonstrated high-quality care with lower rates of hospitalization and lower costs. Yet expansion of the PACE model to other sites has been slow since 1997. Barriers cited include financial constraints, challenges with enrollment and referral sources, and model characteristics (Gross et al., 2004).
Open-access hospice programs Open-access hospice is an emerging model of care with the objective of providing hospice services to patients who need and want hospice care but may not be eligible under the Medicare eligibility criteria. Patients receive the medical symptom management and psychosocial support traditionally available through hospice while simultaneously retaining access to medical treatments designed to slow or halt their disease progression (Abelson, 2007). Although patients who receive care through open-access hospices may be covered by private insurance plans or may pay for their care out of pocket, initial reports (Abelson, 2007) indicate that the cost of caring for patients enrolled through open-access policies is generally absorbed by the hospice provider. Hospices may have financial incentives to provide care through open-access policies if these patients transition to hospice care earlier, which prolongs hospice length of stay and is therefore more profitable for the hospice provider.
The emergence of hospices with open-access policies signals the ability and willingness of some hospices to provide care outside of the Medicare hospice benefit and has the potential to improve access to hospice care. However, a recent study finds that only slightly more than one-quarter of hospices have such policies, and the majority of these hospice are nonprofit (Aldridge et al., 2012). This is concerning because it suggests that the open-access policy innovation may be unlikely to spread, given the substantial growth in the for-profit hospice sector during the past decade (Thompson et al., 2012). Between 2000 and 2009, four out of five hospice providers
that entered the U.S. market were for-profit, and more than 40 percent of hospices operating in 2000 had changed ownership during that same decade (Thompson et al., 2012).
Hospital at Home® The Hospital at Home program was originally developed at Johns Hopkins to improve care for individuals with selected acute illnesses by providing acute hospital-level care in a patient’s home instead of the hospital. Although the acute hospital is the standard venue for providing acute medical care for serious illness, it is expensive and may be hazardous for vulnerable older persons, who commonly experience functional decline, iatrogenic illness, and other adverse events during hospital admissions. Providing acute hospital-level care in a patient’s home for carefully selected patients via Hospital at Home has been shown to improve patient safety, enhance quality, increase efficiency, reduce variations in practice, and reduce the costs of providing acute care for medical illness for Medicare beneficiaries (Frick et al., 2009; Leff et al., 2005, 2006). A 2012 meta-analysis of 61 randomized controlled trials found that Hospital at Home care led to a 19 percent reduction in costs with similar or improved clinical outcomes, including a 25 percent reduction in readmission rates, better patient satisfaction, and lower caregiver burden (Cryer et al., 2012).
Dissemination of the Hospital at Home program has been limited, however, by the lack of a feasible payment model in Medicare. There currently exists no mechanism in fee-for-service Medicare for reimbursing for these services; the services do not fit the statutory definition of acute hospital care because they are delivered to a patient outside the physical plant of the acute care hospital and therefore are not “at hospital” services. In fact, negative financial incentives exist in that the hospital would not receive reimbursement for the acute hospital admission. Further, there is no mechanism for receiving appropriate reimbursement for Hospital at Home services provided because these acute hospital-level services are well beyond the scope and intensity of reimbursable Medicare home health care services.
Identification of Target Population for Health Care Interventions to Reduce Costs
Our findings suggest that identification of the appropriate target population for cost-saving interventions is critical given the substantial variation in the size of different target populations, the costs generated by different populations, and the proportion of the target population likely to be impacted by an intervention. Using the statistics we have estimated for this report, Table E-9 compares three potential target populations and two hypothetical interventions to highlight the differences in potential cost savings. We assume that the percentage of the eligible population
TABLE E-9 Projected Cost Savings of Hypothetical Interventions by Target Population
| Target Population* | Population Size | Total Costs ($bil) | Intervention | % of Population Impacted by Intervention | Potential Reduction in Health Care Costs (%) | Potential Reduction in Health Care Costs ($bil) |
| Age 65 or older with chronic conditions and functional limitations | 22,092,740 | $543 | A B |
50 50 |
10 5 |
$27 14 |
| All individuals with chronic conditions and functional limitations | 44,946,847 | $909 | A B |
50 50 |
10 5 |
45 23 |
| Individuals at the end of life | 2,468,435 | $200 | A B |
50 50 |
10 5 |
10 5 |
*Target populations are not mutually exclusive.
that will be impacted by each intervention is 50 percent in all cases and that the potential reduction in costs is either 10 percent or 5 percent. An intervention that targets all individuals with chronic conditions and functional limitations (45 million people), impacts half that population, and reduces costs by 10 percent will theoretically achieve double the reduction in health care costs compared with the same intervention that targets only older adults with chronic conditions and functional limitations ($45 billion versus $27 billion). Our estimates also highlight the fact that interventions aimed at individuals in their last year of life will generate smaller reductions in cost savings relative to interventions that target those with chronic conditions and functional limitations given the significantly smaller size of the end-of-life population and the limited time frame for cost reduction. In addition, given the complexity of identifying individuals in their last year of life relative to identifying individuals with chronic conditions and functional limitations, it is likely that an end-of-life intervention may have an even smaller effect on costs than shown in the table because it would likely impact less than 50 percent of the terminal population.
Standardized Identification of Seriously Ill and Potentially High-Cost Patients
Add a flag to administrative data to identify functional debility Administrative datasets, including Medicare, Medicaid, and private insurer claims, are key sources of data for health services research and for identifying individuals who may benefit from tailored services. As described above, however, these data are lacking elements critical to the identification of serious illness. In particular, functional limitations and debility are major predictors of high total health care spending, yet are not available in the majority of claims data (Kelley et al., 2011). Therefore, the Centers for Medicare & Medicaid Services and other major payors should require the collection of functional status data with all inpatient, SNF, home health, and hospice claims. Functional status measures are already collected for clinical purposes in all of these settings, and a flag or indicator of functional limitation could be added as a modifier to claims in these settings. This single addition to standardized claims requirements would create an opportunity to study the costs and quality of care for patients with serious illness and to identify this high-cost and vulnerable population for interventions designed to improve care.
Use a trigger for screening based on utilization patterns Prospectively identifying those seriously ill, high-cost patients who do not have functional limitations is an additional challenge for the deployment of targeted
interventions for this group. Therefore, we recommend using an algorithm based on the presence of selected chronic conditions and defined patterns of health care utilization to identify individuals for more thorough screening by a health care professional. For example, individuals with congestive heart failure who present to the emergency department two or more times within 1 year would be interviewed. Those with unmet need for health care and supportive services, uncontrolled symptoms, or excessive treatment or caregiver burden might qualify for an intervention program designed to improve care and avoid excessive or unnecessary costs.
Research Required
One of the greatest gaps in the research we have reviewed for this appendix is the lack of evidence regarding characteristics associated with high costs in total and the impact of interventions or models of care on total health care costs. Nearly all of the analyses we reviewed focused on only one payor—generally Medicare. Although such studies are informative, the focus on Medicare costs alone has led to the misperception that older adults and those at the end of life are the primary drivers of health care costs, and yet when one evaluates total health care costs, it is fairly clear that this is not the case. A critical next step in research is to evaluate the impact of various interventions on reducing total health care costs so that programs and policies implemented across the health care system truly reduce total costs rather than merely shift costs from payor to payor.
Second, comprehensive data for the study of high-cost, seriously ill patients are currently unavailable. The standardized collection of functional status measures and markers of high health care utilization recommended above would facilitate the study of “real-world” health care programs for this population. While this would be a critical step forward, rigorous, peer-reviewed research is also needed to promote high-value health care for this population. For example, a longitudinal prospective cohort study is needed to evaluate the current patterns of care for seriously ill and high-cost adults. Briefly, this study would recruit a large, diverse sample of adults with chronic illness, including those residing in nursing homes, from geographic regions that exhibit variability across a range of regional characteristics previously shown to be associated with treatment quality and intensity. Subjects would provide baseline data on a comprehensive range of demographic, psychosocial, functional, and medical characteristics, as well as pertinent measures of personal values and beliefs. They would also be asked to authorize access to their health care claims data from all relevant payors. The subjects would then be followed with brief yet frequent queries for signs of new serious illness or progressive debility. Those positively identified as possibly having serious illness would be interviewed regarding the
period surrounding the onset of the illness and followed with serial interviews throughout the course of their illness. This study would address many of the current knowledge gaps by enrolling subjects prior to the onset of serious illness and measuring pertinent factors and potential confounders a priori. The sample selection would not be dependent upon time of death or even prognosis, and thereby would capture the full range of serious illness experiences. The step-wise prospective design would minimize sampling bias and allow for focused data collection among those with serious illness when and if it developed while minimizing the study’s burden on subjects.
REFERENCES
Abelson, R. 2007. A chance to pick hospice. New York Times, February 10.
AHRQ (Agency for Healthcare Research and Quality) and HHS (U.S. Department of Health and Human Services). 2011. Medical Expenditure Panel Survey. http://meps.ahrq.gov/mepsweb (accessed September 2013).
Aldridge Carlson, M. D., C. L. Barry, E. J. Cherlin, R. McCorkle, and E. H. Bradley. 2012. Hospices’ enrollment policies may contribute to underuse of hospice care in the United States. Health Affairs (Millwood) 31:2690-2698.
Aragon, K., K. Covinsky, Y. Miao, W. J. Boscardin, L. Flint, and A. K. Smith. 2012. Use of the Medicare posthospitalization skilled nursing benefit in the last 6 months of life. Archives of Internal Medicine 172:1573-1579.
Bach, P. B., D. Schrag, and C. B. Begg. 2004. Resurrecting treatment histories of dead patients: A study design that should be laid to rest. Journal of the American Medical Association 292:2765-2770.
Carlson, M. D., J. Herrin, Q. Du, A. J. Epstein, C. L. Barry, R. S. Morrison, A. L. Back, and E. H. Bradley. 2010. Impact of hospice disenrollment on health care use and medicare expenditures for patients with cancer. Journal of Clinical Oncology 28:4371-4375.
CBO (Congressional Budget Office). 2005. High-cost Medicare beneficiaries. http://www.cbo.gov/sites/default/files/cbofiles/ftpdocs/63xx/doc6332/05-03-medispending.pdf (accessed August 15, 2014).
CBO. 2007. The long-term outlook for health care spending. http://www.cbo.gov/ftpdocs/87xx/doc8758/MainText3.1.shtml (accessed September 2, 2013).
CBO. undated. Medicare. http://www.cbo.gov/topics/health-care/medicare (accessed September 6, 2013).
Chan, L., S. Beaver, R. F. Maclehose, A. Jha, M. Maciejewski, and J. N. Doctor. 2002. Disability and health care costs in the Medicare population. Archives of Physical Medicine and Rehabilitation 83:1196-1201.
CMS (Centers for Medicare & Medicaid Services). 2011. Medicare trustees report. https://www.cms.gov/Research-Statistics-Data-and-Systems/Statistics-Trends-and-Reports/ReportsTrustFunds/Downloads/TR2011.pdf (accessed September 6, 2013).
CMS. 2012. Nursing home data compendium. http://www.cms.gov/Medicare/Provider-Enrollment-and-Certification/CertificationandComplianc/downloads/nursinghomedatacompendium_508.pdf (accessed November 2013).
CMS. 2014. National health expenditure data. http://www.cms.gov/Research-Statistics-Data-and-Systems/Statistics-Trends-and-Reports/NationalHealthExpendData/index.html (accessed November 2013).
Cohen, S., and W. Yu. 2012. The concentration and persistence in the level of health expenditures over time: Estimates for the U.S. population, 2008-2009. AHRQ statistical brief #354. http://meps.ahrq.gov/mepsweb/data_files/publications/st354/stat354.pdf (accessed September 2013).
Cryer, L., S. B. Shannon, M. Van Amsterdam, and B. Leff. 2012. Costs for “hospital at home” patients were 19 percent lower, with equal or better outcomes compared to similar inpatients. Health Affairs (Millwood) 31:1237-1243.
Danis, M., E. Mutran, J. M. Garrett, S. C. Stearns, R. T. Slifkin, L. Hanson, J. F. Williams, and L. R. Churchill. 1996. A prospective study of the impact of patient preferences on life-sustaining treatment and hospital cost. Critical Care Medicine 24:1811-1817.
de Brantes, F., M. B. Rosenthal, and M. Painter. 2009. Building a bridge from fragmentation to accountability—the Prometheus Payment model. New England Journal of Medicine 361:1033-1036.
Emanuel, E. J. 2012. Where are the health care cost savings? Journal of the American Medical Association 307:39-40.
Emanuel, E. J., Y. Young-Xu, N. G. Levinsky, G. Gazelle, O. Saynina, and A. S. Ash. 2003. Chemotherapy use among Medicare beneficiaries at the end of life. Annals of Internal Medicine 138:639-643.
Eng, C., J. Pedulla, G. P. Eleazer, R. McCann, and N. Fox. 1997. Program of All-inclusive Care for the Elderly (PACE): An innovative model of integrated geriatric care and financing. Journal of the American Geriatrics Society 45:223-232.
Fisher, E. S., D. E. Wennberg, T. A. Stukel, D. J. Gottlieb, F. L. Lucas, and E. L. Pinder. 2003a. The implications of regional variations in Medicare spending. Part 1: The content, quality, and accessibility of care. Annals of Internal Medicine 138:273-287.
Fisher, E. S., D. E. Wennberg, T. A. Stukel, D. J. Gottlieb, F. L. Lucas, and E. L. Pinder. 2003b. The implications of regional variations in Medicare spending. Part 2: Health outcomes and satisfaction with care. Annals of Internal Medicine 138:288-298.
Frick, K. D., L. C. Burton, R. Clark, S. I. Mader, W. B. Naughton, J. B. Burl, W. B. Greenough, D. M. Steinwachs, and B. Leff. 2009. Substitutive Hospital at Home for older persons: Effects on costs. American Journal of Managed Care 15:49-56.
Gross, D. L., H. Temkin-Greener, S. Kunitz, and D. B. Mukamel. 2004. The growing pains of integrated health care for the elderly: Lessons from the expansion of PACE. Milbank Quarterly 82:257-282.
Hamel, M. B., R. B. Davis, J. M. Teno, W. A. Knaus, J. Lynn, F. Harrell, Jr., A. N. Galanos, A. W. Wu, and R. S. Phillips. 1999. Older age, aggressiveness of care, and survival for seriously ill, hospitalized adults. SUPPORT investigators. Study to understand prognoses and preferences for outcomes and risks of treatments. Annals of Internal Medicine 131:721-728.
Hanchate, A., A. C. Kronman, Y. Young-Xu, A. S. Ash, and E. Emanuel. 2009. Racial and ethnic differences in end-of-life costs: Why do minorities cost more than whites? Archives of Internal Medicine 169:493-501.
HHS (U.S. Department of Health and Human Services). 2014. HHS initiative on multiple chronic conditions. http://www.hhs.gov/ash/initiatives/mcc (accessed September 2013).
Hing, E. 1989. Nursing home utilization by current residents: United States, 1985. Vital and Health Statistics 13(102). http://www.cdc.gov/nchs/data/series/sr_13/sr13_102.pdf (accessed September 2013).
Hogan, C., J. Lunney, J. Gabel, and J. Lynn. 2001. Medicare beneficiaries’ costs of care in the last year of life. Health Affairs (Millwood) 20:188-195.
Hoover, D. R., S. Crystal, R. Kumar, U. Sambamoorthi, and J. C. Cantor. 2002. Medical expenditures during the last year of life: Findings from the 1992-1996 Medicare current beneficiary survey. Health Services Research 37:1625-1642.
Hurd, M. D., P. Martorell, A. Delavande, K. J. Mullen, and K. M. Langa. 2013. Monetary costs of dementia in the United States. New England Journal of Medicine 368:1326-1334.
IOM (Institute of Medicine). 2002. Unequal treatment: Confronting racial and ethnic disparities in health care. Washington, DC: The National Academies Press.
IOM. 2013. Variation in health care spending: Target decision making, not geography. Washington, DC: The National Academies Press.
Jacobson, G., T. Neuman, and A. Damico. 2010. Medicare spending and use of medical services for beneficiaries in nursing homes and other long-term care facilities: A potential for achieving medicare savings and improving the quality of care. http://kaiserfamilyfoundation.files.wordpress.com/2013/01/8109.pdf (accessed October 2013).
Jones, A. L., L. L. Dwyer, A. R. Bercovitz, and G. W. Strahan. 2009. The National Nursing Home Survey: 2004 overview. Vital Health Statistics 13.
Kelley, A. S., S. L. Ettner, R. S. Morrison, Q. Du, N. S. Wenger, and C. A. Sarkisian. 2011. Determinants of medical expenditures in the last 6 months of life. Annals of Internal Medicine 154:235-242.
Kelley, A. S., S. L. Ettner, R. S. Morrison, Q. Du, and C. A. Sarkisian. 2012. Disability and decline in physical function associated with hospital use at end of life. Journal of General Internal Medicine 27:794-800.
Kelley, A. S., P. Deb, Q. Du, M. D. Aldridge Carlson, and R. S. Morrison. 2013. Hospice enrollment saves money for Medicare and improves care quality across a number of different lengths-of-stay. Health Affairs (Millwood) 32:552-561.
Leff, B., L. Burton, S. L. Mader, B. Naughton, J. Burl, S. K. Inouye, W. B. Greenough III, S. Guido, C. Langston, K. D. Frick, D. Steinwachs, and J. R. Burton. 2005. Hospital at Home: Feasibility and outcomes of a program to provide hospital-level care at home for acutely ill older patients. Annals of Internal Medicine 143:798-808.
Leff, B., L. Burton, S. Mader, B. Naughton, J. Burl, R. Clark, W. B. Greenough III, S. Guido, D. Steinwachs, and J. R. Burton. 2006. Satisfaction with Hospital at Home care. Journal of the American Geriatrics Society 54:1355-1363.
Levinsky, N. G., W. Yu, A. Ash, M. Moskowitz, G. Gazelle, O. Saynina, and E. J. Emanuel. 2001. Influence of age on Medicare expenditures and medical care in the last year of life. Journal of the American Medical Association 286:1349-1355.
The Lewin Group. 2010. Individuals living in the community with chronic conditions and functional limitations: A closer look. http://www.aspe.hhs.gov/daltcp/reports/2010/closerlook.pdf (accessed September 2013).
Lubitz, J. D., and G. F. Riley. 1993. Trends in Medicare payments in the last year of life. New England Journal of Medicine 328:1092-1096.
Lunney, J. R., J. Lynn, and C. Hogan. 2002. Profiles of older medicare decedents. Journal of the American Geriatrics Society 50:1108-1112.
Lunney, J. R., J. Lynn, D. J. Foley, S. Lipson, and J. M. Guralnik. 2003. Patterns of functional decline at the end of life. Journal of the American Medical Association 289:2387-2392.
Mittler, J. N., B. E. Landon, E. S. Fisher, P. D. Cleary, and A. M. Zaslavsky. 2010. Market variations in intensity of Medicare service use and beneficiary experiences with care. Health Services Research 45:647-669.
Morrison, R. S., J. Dietrich, S. Ladwig, T. Quill, J. Sacco, J. Tangeman, and D. E. Meier. 2011. Palliative care consultation teams cut hospital costs for Medicaid beneficiaries. Health Affairs (Millwood) 30:454-463.
Moses III, H., D. H. Matheson, E. R. Dorsey, B. P. George, D. Sadoff, and S. Yoshimura. 2013. The anatomy of health care in the United States. Journal of the American Medical Association 310:1947-1963.
National Center for Health Statistics. 2013. Health, United States, 2012: With special feature on emergency care. http://www.cdc.gov/nchs/data/hus/hus12.pdf#109 (accessed November 2013).
Nicholas, L. H., K. M. Langa, T. J. Iwashyna, and D. R. Weir. 2011. Regional variation in the association between advance directives and end-of-life Medicare expenditures. Journal of the American Medical Association 306:1447-1453.
NIHCM (National Institute for Health Care Management) Foundation. 2012, July. The concentration of health care spending. Data brief. http://www.nihcm.org/pdf/DataBrief3%20Final.pdf (accessed September 2013).
Pritchard, R. S., E. S. Fisher, J. M. Teno, S. M. Sharp, D. J. Reding, W. A. Knaus, J. E. Wennberg, and J. Lynn J. 1998. Influence of patient preferences and local health system characteristics on the place of death. SUPPORT investigators. Study to understand prognoses and preferences for risks and outcomes of treatment. Journal of the American Geriatrics Society 46:1242-1250.
Riley, G. F., and J. D. Lubitz. 2010. Long-term trends in Medicare payments in the last year of life. Health Services Research 45:565-576.
Shugarman, L. R., C. E. Bird, C. R. Schuster, and J. Lynn. 2007. Age and gender differences in Medicare expenditures at the end of life for colorectal cancer decedents. Journal of Women’s Health 16:214-227.
Sing, M., J. S. Banthin, T. M. Selden, C. A. Cowan, and S. P. Keehan. 2006. Reconciling medical expenditure estimates from the MEPS and NHEA, 2002. Health Care Financing Review 28:25-40.
Skinner, J., A. Chandra, D. Goodman, and E. S. Fisher. 2009. The elusive connection between health care spending and quality. Health Affairs (Millwood) 28:w119-w123.
Song, Y., J. Skinner, J. Bynum, J. Sutherland, J. E. Wennberg, and E. S. Fisher. 2010. Regional variations in diagnostic practices. New England Journal of Medicine 363:45-53.
Temel, J. S., J. A. Greer, A. Muzikansky, E. R. Gallagher, S. Admane, V. A. Jackson, C. M. Dahlin, C. D. Blinderman, J. Jacobsen, W. F. Pirl, J. A. Billings, and T. J. Lynch. 2010. Early palliative care for patients with metastatic non-small-cell lung cancer. New England Journal of Medicine 363:733-742.
Teno, J. M., E. S. Fisher, M. B. Hamel, K. Coppola, and N. V. Dawson. 2002. Medical care inconsistent with patients’ treatment goals: Association with 1-year Medicare resource use and survival. Journal of the American Geriatrics Society 50:496-500.
Teno, J. M., A. Gruneir, Z. Schwartz, A. Nanda, and T. Wetle. 2007. Association between advance directives and quality of end-of-life care: A national study. Journal of the American Geriatrics Society 55:189-194.
Thompson, J. W., M. D. Carlson, and E. H. Bradley. 2012. US hospice industry experienced considerable turbulence from changes in ownership, growth, and shift to for-profit status. Health Affairs (Millwood) 31:1286-1293.
Tschirhart, E. C., Q. Du, and A. S. Kelley. In press. Factors influencing the use of intensive procedures in the last 6 months of life. Journal of the American Geriatrics Society.
Ward, B. W., and J. S. Schiller. 2013. Prevalence of multiple chronic conditions among US adults: Estimates from the National Health Interview Survey, 2010. Preventing Chronic Disease 10.
Welch, H. G., S. M. Sharp, D. J. Gottlieb, J. S. Skinner, and J. E. Wennberg. 2011. Geographic variation in diagnosis frequency and risk of death among Medicare beneficiaries. Journal of the American Medical Association 305:1113-1118.
Wennberg, J. E., K. Bronner, J. S. Skinner, E. S. Fisher, and D. C. Goodman. 2009. Inpatient care intensity and patients’ ratings of their hospital experiences. Health Affairs (Millwood) 28:103-112.
Yasaitis, L., E. S. Fisher, J. S. Skinner, and A. Chandra. 2009. Hospital quality and intensity of spending: Is there an association? Health Affairs (Millwood) 28:w566-w572.
Zhang, B., A. A. Wright, H. A. Huskamp, M. E. Nilsson, M. L. Maciejewski, C. C. Earle, S. D. Block, P. K. Maciejewski, and H. G. Prigerson. 2009. Health care costs in the last week of life: Associations with end-of-life conversations. Archives of Internal Medicine 169:480-488.
Zhang, J. X., P. J. Rathouz, and M. H. Chin. 2003. Comorbidity and the concentration of health care expenditures in older patients with heart failure. Journal of the American Geriatrics Society 51:476-482.
This page intentionally left blank.


