
3
Use Case Scenarios and Design Enhancements
The committee worked with three user groups to obtain evaluations of SMART Vaccines from various perspectives. The groups were the Public Health Agency of Canada, New York State Department of Health, and the Serum Institute of India. Profiles of these three user groups are presented in Box 1-2.
Users were asked to choose a test case that was useful and applicable to their organization and that required a comparison of at least two vaccines. The committee offered the following initial guidance to the user groups concerning how they should apply SMART Vaccines to a real challenge they had faced, were facing, or expected to face:
- Identify a policy question or challenging decision for which you require a comparative analysis of two or more vaccines.
- Select the population in which you wish to analyze the impact of the vaccines and provide the necessary life-tables information.
- Specify the burden of the diseases being targeted by the vaccines of interest.
- Choose two or more vaccine candidates to evaluate. These can be single vaccines for each chosen disease or multiple candidate vaccines for a single disease (i.e., determining the ranking for vaccines with different bundles of attributes) or some combination thereof.
A template spreadsheet developed by the Phase II committee was provided to the three user groups to guide their data compilation. Additional guidance was provided to the user groups to support their data collection, with the specific guidance varying according to the details of the particular test case and the resources available to the user group. Some user groups needed minimal assistance, while others lacked the necessary expertise for gathering population-specific disease burden and vaccine data.
The Public Health Agency of Canada (PHAC) chose to use SMART Vaccines to prioritize vaccines for research and development. The agency chose chlamydia and tuberculosis within the Canadian population as its test case. Although Canada represents only a small fraction (1 to 2 percent) of the world market for vaccines, the PHAC believes that it can influence vaccine development by working with vaccine developers to use Canada as a test bed for early use of vaccines; in this way the PHAC can play a significant role in prioritization despite Canada’s relatively small portion of the world market.
The New York State Department of Health (NYSDOH) decided to use SMART Vaccines to compare two existing rotavirus vaccines, Rotateq and Rotarix, for use within New York. The department also used SMART Vaccines to help determine which of four existing influenza vaccines might best serve the population of New York, where vaccine delivery takes place through a variety of private providers as well as some public health clinics.
The Serum Institute of India used SMART Vaccines to prioritize between two vaccines, a vaccine for dengue and a vaccine for respiratory syncytial virus, for use in India. Currently no vaccines exist for either disease.
After the user groups collected the data relevant to their scenarios, they provided the data to the committee, which then sent each group an updated version of the SMART Vaccines that had been preloaded with the data that group had provided. Then each user group tested SMART Vaccines for its chosen scenario. The PHAC team consisted of staff experts in disease spread modeling, policy research, and health economics; the combination allowed the team members to efficiently gather and test data for its use cases. The NYSDOH team included a group of health officials, an epidemiologist, a computer scientist, and immunization officers who supported the effort to compile disease burden and vaccine data. The use case scenario of the Serum Institute of India was spearheaded by its corporate medical director, who was supported by a project assistant.
The users provided feedback about their experience to help the committee understand how each group used the software to analyze its
scenario, the usefulness of various aspects of SMART Vaccines such as sensitivity analysis, and the groups’ preferences regarding the software interface. This study was led by an independent consultant to the committee from Microsoft Corporation. The groups’ feedback is summarized by the consultant in Appendix A, and the committee’s corresponding responses or actions are provided in Appendix B.
The fourth use case scenario—which will be discussed later in this chapter—focused on using SMART Vaccines as a reverse engineering tool to determine the SMART Scores of potential vaccines for a single disease and thus offer guidance to vaccine developers concerning the most desirable bundles of attributes for potential vaccines. In some sense, this scenario expands upon the typical target product profile discussions already common in the world of vaccine discovery and production.
Data Sourcing Guidance to the User Groups
Over a 5-month period, the committee partnered with the user groups to provide general and specific advice for data collection and to answer queries regarding software requirements, data needs, and other user or interface concerns.
The users were provided with general sources for finding relevant data; however, each user group also required sources of specific information concerning its identified population. To help the user groups find such information, the committee provided specific research help for the different users. For instance, NYSDOH required state-specific data on disease burden. To compare the two rotavirus vaccines, highly granular data were needed for Rotateq and Rotarix vaccines within New York, and the committee offered customized help concerning such data. All of the datasets compiled by the user groups in conjunction with the committee are available upon request through the Public Access Records Office accessible from the Current Projects System page of the National Academies website.
Updated Features in SMART Vaccines 1.1
The committee found the usability studies with the three user groups to be very useful and productive. As a result of those studies, several updates and enhancements to SMART Vaccines were made. These updates and enhancements are illustrated with various screenshots in this section.
Terms of Use
The opening page of SMART Vaccines 1.1 presents the terms of use and a disclaimer from the National Academy of Sciences (see Figure 3-1). Once users click the “Accept” button, they enter the program. From this point forward, navigation occurs by using the “Continue” button at the upper right corner of the screen. Subsequent screenshots from the SMART Vaccines 1.1 demonstrate the functions of each page. The functions are grouped into two sections: Specify and Evaluate.
Specifications
The Specify group contains three separate pages for the choice and entry of data that are used in subsequent analyses. The categories of data include Population, Disease, and Vaccine.
SMART Vaccines 1.1 has built-in population data and estimated wage rate data for the 34 countries in the Organisation for Economic Cooperation and Development (OECD) as well as for India, New York State, and South Africa. To navigate to a specific nation’s population page, users need to click and select from the drop-down list that gives access to specific country-level populations (see Figure 3-2).1
Just as in version 1.0, SMART Vaccines 1.1 provides detailed population data, including life-table information and average hourly wage rates, all of which are used in subsequent calculations for determining the effects of various vaccines (see Figure 3-3).2
On the page requesting information on disease burden (see Figure 3-4), users enter population-specific information about the burden of various diseases of interest. Vaccines targeting these diseases will be available for later comparison and evaluation. For each disease of interest, users must enter two types of information: disease burden data and illness descriptors.
The disease burden data require standard epidemiologic estimates of annual incidence and case-fatality rates for diseases in four age groups: infants, children between 1 and 19 years of age, adults between the ages of 20 and 65, and the elderly, that is, those of age 65 and above. Once a dis-
____________
1 SMART Vaccines 1.1 currently does not have the capability for users to define their own subpopulation—for example, a state or a province—or to do a collective analysis of a vaccine’s impact on a group of nations, although future versions could accommodate this feature.
2 SMART Vaccines 1.1 eliminates a column that SMART Vaccines 1.0 contained where information was requested on Health Utilities Index 2 for age-specific determination of quality-adjusted life years (QALYs). That variable, used only in one attribute’s calculations, is not available except for few national populations (e.g., the British Commonwealth nations, Canada, and the United States).
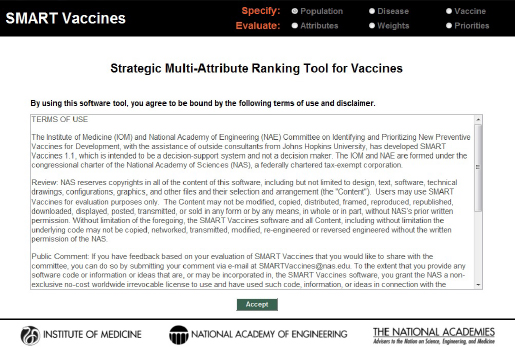
FIGURE 3-1
Opening page containing the software’s terms of use. SMART Vaccines 1.1 is currently functional only on the Windows platform.
ease is specified (e.g., pneumococcal infection) and the relevant data are entered, users can save the data for subsequent use. Users can define as many diseases as they desire, and they can define multiple potential vaccines targeting each specific disease.3
On the disease page, users must also identify for each disease specified the types of illness outcomes that the disease might cause. These might simply be different degrees of severity (e.g., mild or severe), or they might be distinct diseases (such as, in the pneumococcal infection example in Figure 3-4, meningitis, sinusitis, or otitis media). Users specify the mix of these outcomes (percentage of cases, which must add up to 100 percent), and for each disease state users specify the disutility associated with the condition (e.g., 0.02 for meningitis), the disability weight, the duration (in days) of the condition or its treatment, and the annual costs of treating that disease. The duration measure is used in the calculation of
____________
3 SMART Vaccines 1.1 cannot analyze vaccines that affect multiple diseases, for example, combination vaccines that protect against diphtheria, tetanus, and pertussis (DTP).
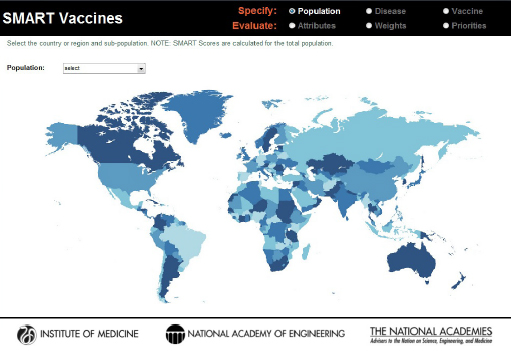
FIGURE 3-2
SMART Vaccines 1.1 population selection map.
quality-adjusted life years (QALYs, which also use the disutility toll) and of disability-adjusted life years (DALYs, which also use the disability weight).
Users are also asked to specify a single value for the annual costs of treating each disease condition. SMART Vaccines 1.0 sought highly detailed data with which to calculate the annual costs. User feedback indicated to the committee that the format was overly restrictive, and the committee responded by replacing that detailed matrix for data entry with a single value (total cost) in SMART Vaccines 1.1. Users need to estimate that total cost offline by using the best data and the best analytic approach that their local resources permit (which may range from an informed expert’s best estimate to richly supported true cost data). Users are also asked to specify the costs of a death occurring due to the disease, such as the $4,453 shown in Figure 3-3 as the cost of a death from pneumococcal infection.
Once they have finished entering all of these data for each relevant disease, users hit the “Continue” button at the upper right corner of the page, which takes them to the next page, where vaccine characteristics are defined.
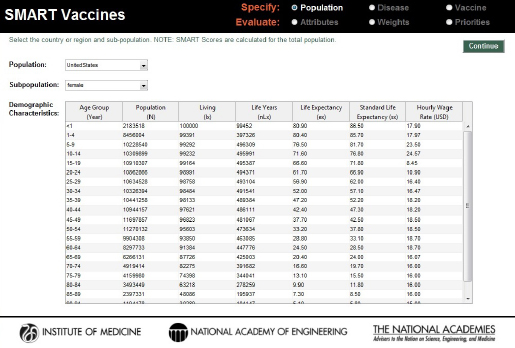
FIGURE 3-3
Population specification screen in SMART Vaccines 1.1. For user convenience, demographic characteristics—population data, life-table information, and wage data—have been preloaded for 34 OECD countries as well as for India, New York State, and South Africa.
Vaccines
Having defined their disease or diseases of interest, users next specify the attributes of a single vaccine or multiple vaccines with different design features that would protect against each disease. When using SMART Vaccines to set priorities for new vaccine development, these attributes are necessarily hypothetical. For some other uses (e.g., selecting among existing vaccines, as one of the user groups chose to do), the vaccine attributes are known with much greater certainty.
Using the same four age brackets as used for the disease burden data, the Vaccines page asks users to indicate with a check box whether or not the vaccine targets each age group and to specify the percentage of each age-group expected to receive the vaccination (“coverage”) and the percentage of those vaccinated persons who will gain immunity (“effectiveness”). The number of individuals in the age-specific population groups is brought directly from the previously chosen population profiles (see Figure 3-5).
For each vaccine, users are asked to specify with a check box whether “herd immunity” applies to this vaccine-disease combination. In SMART
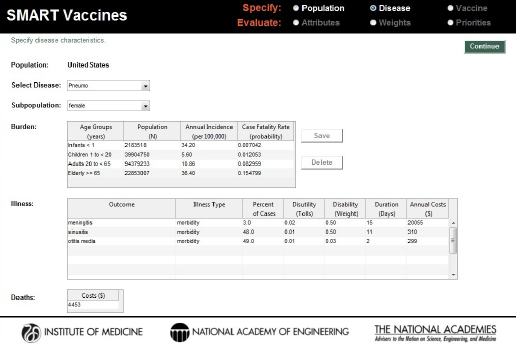
FIGURE 3-4
Disease specification screen in SMART Vaccines 1.1. Having been streamlined since SMART Vaccines 1.0, this page requires user single entry for costs associated with the treating the disease burden.
Vaccines 1.1 (as well as in version 1.0), the herd immunity feature specifies that if greater than 80 percent of the total population receives effective immunity—that is, if the product of the coverage and the effectiveness percentages is greater than 80 percent—then it is assumed that the entire population is protected. Later enhancements of SMART Vaccines may wish to provide more disease-specific models of herd immunity, but currently this simple approach is used.
Users can specify more than one vaccine for each disease. This provides a ready mechanism to determine the value (as measured by the SMART Score) of vaccines with different design profiles. This approach can illuminate desirable features in vaccine design in the development stage, or, as one user group did, the approach can be used to assist in choosing among a set of existing vaccines available on the market. Users can also combine the two, determining which combinations of new (improved) attributes for a vaccine would make it worthwhile to encourage the development of a new vaccine in those cases where existing vaccines provide at least partial protection against a disease. The committee’s fourth use
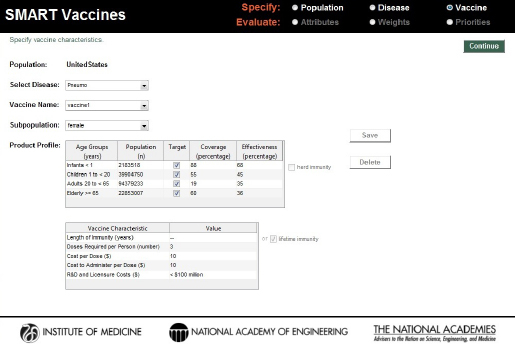
FIGURE 3-5
SMART Vaccines 1.1 screen for defining characteristics of the vaccine candidates considered for prioritization.
case scenario (described later in this chapter) took this approach to reverse engineer the desirable set of attributes of vaccines in pneumococcal vaccines for South Africa.
Upon completing data entry to specify vaccines, users use the “Continue” button to proceed to the Evaluation section of the program.
Evaluation
SMART Vaccines offers a choice among 28 attributes in eight categories as well as allowing for 7 user-defined attributes. Turning on any of the radio buttons (e.g., the economic attributes in Figure 3-6) takes the user to a set of attributes from which the user may choose one or more for a subsequent evaluation of the vaccine candidates. Because of the high similarity between DALYs and QALYs in the “health” group, users may not select both, and choosing one causes the option for the other to be grayed out. Furthermore, if a user selects, say, QALYs as a health outcome, then the user is only allowed to choose the economic variable of $/QALY—and not $/DALY—in the “economic” group.
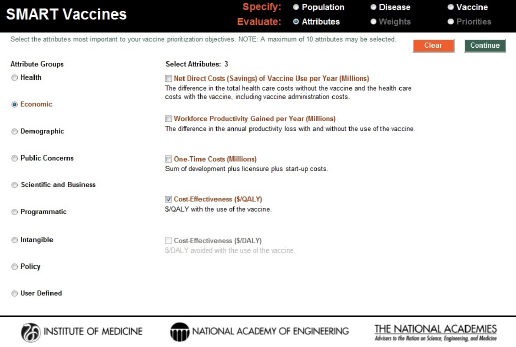
FIGURE 3-6
Attribute selection page in SMART Vaccines 1.1. Options from nine attribute groups can be selected by the user for comparing vaccine candidates, including up to seven user-defined custom attributes.
Reports from earlier phases of this project emphasized the importance of careful judgment in selecting attributes. There are several reasons for this. First, if many attributes are chosen, then the weights assigned to those at the bottom of the priority list will have little meaningful effect on the rankings of candidate vaccines. Second, even with the elimination of double counting with DALYs and QALYs, users can still select sets of attributes that could create additional double counting. For example, in the “Health” section, selecting “life years saved” and either DALYs or QALYs could lead to double counting. Both because many of the attributes on long lists of attributes will inevitably be essentially irrelevant and because of “real estate” issues in screen display, SMART Vaccines limits users to selecting no more than 10 attributes.
The “user-defined” category allows users to specify their own attributes. Figure 3-7 shows the creation of a user-defined attribute evaluating the impact of a vaccine on public education. When the user completes selection of attributes, hitting the “Continue” button at the upper right corner of the screen takes the user to the next step in the Evaluate section—the determination of weights to be used in the SMART Score calculation.
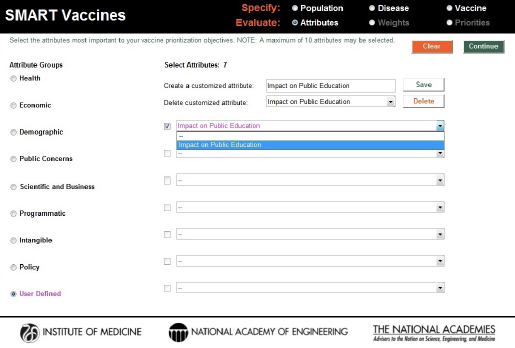
FIGURE 3-7
Creation and inclusion of a user-defined attribute. These entries are answered with a yes or a no response in SMART Vaccines 1.1.
The first step in the Weights section asks the user to rank the selected attributes by order of importance. Figure 3-8 shows a set of attributes that a hypothetical decision maker has selected. The standard approach in using this sort of ranking has the user specify first the most important attribute—number 1—using the pull-down box associated with each attribute. The user should then select the least important attribute (number 7 among 7 attributes selected previously). Next the user selects the most important of the remaining attributes (number 2), and then the least important of the remaining attributes (number 6), and so on, proceeding in this way until all attributes have been ranked.
SMART Vaccines uses these ranks to provide an initial estimate of the weights the user might wish to assign to each attribute, with the weights summing to 100 percent. The weights are calculated using the rank-order centroid process, which is described in detail in the Phase I report (IOM, 2012). Essentially, the rank-order centroid process calculates the average of all possible combinations of weights that are consistent with the original rank ordering specified by the user, and then that set of weights is assigned
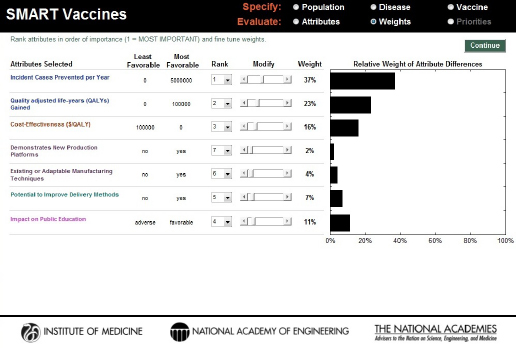
FIGURE 3-8
SMART Vaccines 1.1 screen for ranking and weighting attributes. Initial weights are produced by the software using the rank order centroid method, but they can be modified easily by the users with the provided slider bars.
to the attributes. This set of initial weights appears automatically once the user has completed the ranking process (see Figure 3-8).
Users can then freely adjust the weights attached to each attribute by using the slider bars for each attribute (the Modify option), after which the determination of the weights is complete (see Figure 3-9). For example, the hypothetical user chose to reduce the 37 percent weight applied to “incident cases prevented per year” in Figure 3-8 to 25 percent and increase the weight on “impact on public education” in Figure 3-9 to 15 percent. The other weights are automatically adjusted so that they all add to 100 percent. At this point, using the “Continue” button will take the user to the page where SMART Scores are calculated.
On the Priorities page the user can select up to five vaccine candidates for simultaneous comparison. The limit of five candidates is determined by screen real estate, but users can always calculate SMART Scores for a set of five candidates, save the results using the Print button at the lower right corner of the page, and then proceed to define another set of
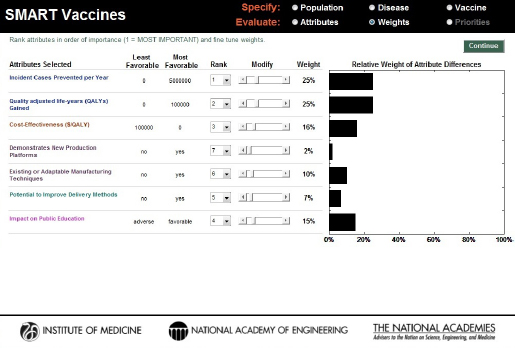
FIGURE 3-9
SMART Vaccines 1.1 screen showing the alteration of the weights based on the user’s preference.
five candidates. The calculated SMART Scores will be the same as if all 10 candidates had been analyzed simultaneously.4
For each candidate vaccine selected, users must fill in the appropriate value for all of the selected attributes that are not calculated by SMART Vaccines.5 As Figure 3-10 shows, some of these attributes have values calculated from previously entered data—in particular, the health and economic attributes. Other attributes must be defined by the user.
As the attribute values are completed for a candidate vaccine, a SMART Score appears in the display box on the right side of this screen. In this hypothetical example, the user’s selection of vaccine candidates for pneumococcal infection, human papillomavirus, and rotavirus results in
____________
4 This is possible because multi-attribute utility models are independent of irrelevant alternatives (IIA), meaning that the scores are independent of the actual comparison set. As the Phase 1 report discussed in more detail, other multi-criteria decision analysis models (including the Analytic Hierarchy Process) do not possess this desirable feature.
5 The reader is referred to the discussion in Chapter 2 regarding boundary setting for the software-defined attributes.
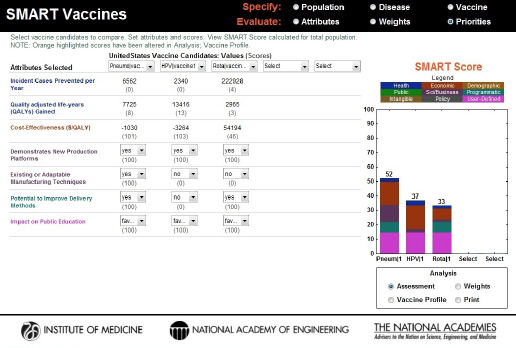
FIGURE 3-10
SMART Score output screen showing vaccines being compared, their computed or selected attribute values, and the color-coded final SMART Scores, a composite of quantitative and qualitative values, highlighting the relative differences between the candidates.
the scores of 52, 37, and 33, respectively. The bar graphs not only provide the total score but also show how much each domain of attributes (e.g., health, economic, demographic, and other categories) contributes to the total score by dividing the bar into color-coded sections.
It is important to keep in mind that the SMART Scores do not provide relative values. A score of 90 is not twice as good as a score of 45, for example, although it is 45 points higher. In other words, the differences in scores have meaning, but their relative sizes do not. Both the Phase I and the Phase II reports discuss this feature in detail (IOM, 2012, 2013). For a simple but useful analogy, users should think of these scores as temperatures that can be given using either the Fahrenheit or the Celsius scale. In neither of these scales is 20 degrees twice as warm as 10 degrees, and 20°F is not the same as 20°C, but the concept of “a difference of 20 degrees” (in either Fahrenheit or Celsius) does have a consistent meaning. Similarly, the SMART Scores of one user do not correspond to those of another, but it still makes sense to speak of differences in the SMART Scores in a single user’s analysis.
A small box in the lower right corner of the screen allows the user to select different ways of conducting a sensitivity analysis (the Analysis option). If the user selects the Weight button, then the user simultaneously has the ability to adjust the weights on each attribute and see the effect on SMART Scores. Users should set the weights before conducting the analysis and generally should not modify those weights once they are established. One could, however, use this capability legitimately to explore the scores of a person or entity with a differing viewpoint (e.g., a health minister versus a vaccine developer), which is why this capability is made available.
At any point during the process, the user can capture the state of the program along with a time stamp by using the Print button, enter notes on that analysis for future reference, and save it as a portable document file (PDF). In this screen the upper box shows the weights attached to each attribute and the values each vaccine creates along that attribute’s dimension, the lower box describes the vaccine product profile as specified for each vaccine, and the box on the right shows the SMART Score of each candidate (see Figure 3-11).
Users should be aware of two features in the display of SMART Scores. First—consistent with the way that multi-attribute utility models generally work—the SMART Scores can go above 100 or below 0. A score above 100 occurs if a candidate vaccine has an attribute outcome (e.g., cases averted) that substantially exceeds the “best-case” outcome boundary established for the population, coupled with a significant weight placed by the user on that attribute. For example, if a candidate vaccine achieves a score of 300 on a single attribute and the user has placed a weight of 40 percent on that attribute, then the multi-attribute utility algorithm adds 120 points to the SMART Score, and the total score will include that 120 value plus contributions from other attributes. The vertical axis on the SMART Score range dynamically adjusts to accommodate scores outside the 0 to 100 range.
Attribute values—and hence also SMART Scores—can also fall below 0 if an attribute value is worse than the “worst-case” outcome established for that attribute. For example, the worst case for a $/QALY cost-effectiveness ratio is set at 15 times the per capita income in the population of interest (e.g., in the United States, at $150,000). If the $/QALY for a candidate vaccine was actually $250,000, then it would have an attribute value of $100,000 more than the worst-case boundary, and hence receive an attribute score of –67, because the boundary values of 0 and $150,000 pro-
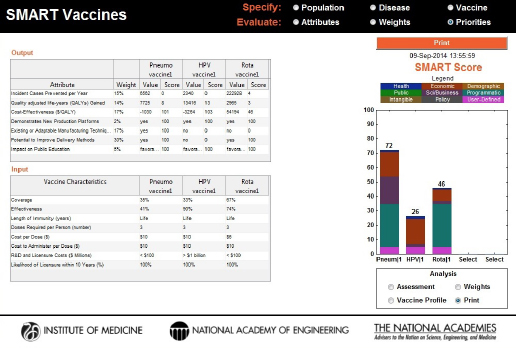
FIGURE 3-11
A new feature in SMART Vaccines 1.1, a Print command, summarizes the input (vaccine characteristics) and output information used in the analysis along with a time stamp for record.
vide a range of 150,000 and the actual value is two-thirds higher (worse). And if sufficient weight is placed on an attribute with such an outcome, the SMART Score can fall below 0. Again, the vertical axis of the graphical display dynamically adjusts to accommodate such a score.
A related case occurs when the SMART Score remains positive but has both positive and negative components. In this case, the graph shows the total score including both the positive and negative components in the sum. This is perfectly legitimate within multi-attribute utility theory, but to alert the user that such a case exists, the SMART Score graph for that candidate vaccine will show hatched bars rather than the standard solid color bars. In this situation, users should carefully attend to the actual values shown—both positive and negative contributions to the SMART Score—rather than just using the bar graph representation of the SMART Score to inform their decision making. Figure 3-12 shows a composite version of hypothetical vaccine candidates scoring above 100, scoring below 0, and having both positive and negative components in the SMART Score.
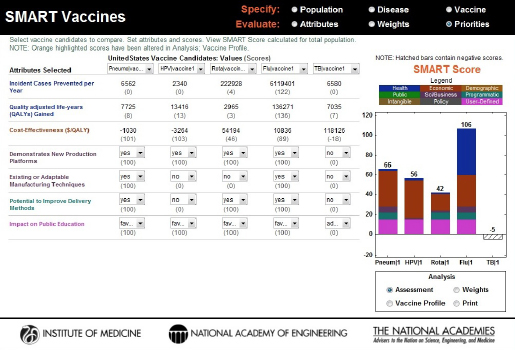
FIGURE 3-12
A hypothetical case comparison of four vaccine candidates where an influenza vaccine candidate scores 106 and a tuberculosis vaccine scores –5 based on the weights and impact of the attributes. Furthermore, the tuberculosis vaccine is represented by a hatched bar instead of solid colors to indicate that both positive and negative components have contributed to its SMART Score.
Key Insights from the User Groups
In this section, the committee summarizes key lessons learned beginning with the broadest policy issues and then shifting to more narrow issues in application of SMART Vaccines to the settings of the three user groups, and the officials from the Mexican Ministry of Health who served as advisory consultants.
All of these users fully understood that they were using a preliminary and evolving version of SMART Vaccines and that their feedback was to be applied toward improving the product. As a consequence, none of them attempted to use the software for actual decision making, but rather used the occasion to explore the software, both for their potential future use and to assist in the Institute of Medicine’s (IOM’s) unique product development effort.
In none of the use case scenarios did the users actually develop their official sets of attributes to be used in vaccine evaluation or the formal
weights to be attached to those attributes. In general, technical support staff selected a set of attributes as a starting point for discussion within their respective units, with the choices of attributes and their weights often being modified during presentation to support the discussions with higher level decision makers who would eventually make actual policy decisions.
Similarly, as the committee explored the software applications with various users, it found areas where their data were either incomplete or inaccurate, further emphasizing that the results were not real decision support but rather familiarization with the SMART Vaccines tool and its potential uses.
In Table 3-1, the committee has summarized the key things it has learned in these interactions with early users of SMART Vaccines and how this information informed the changes built into SMART Vaccines 1.1. These lessons are categorized by the software’s functional aspects.
Fourth Use Case Scenario: Product Profile Design
SMART Vaccines can be used to explore the desirability of potential vaccines with different sets of attributes. This can be done by vaccine developers using their best approximation of the attributes and weights that the public health community might use, by the public health community directly, or perhaps through a collaboration between vaccine developers and other stakeholders.
To illustrate this approach to using SMART Vaccines 1.1—including new features not previously available in SMART Vaccines 1.0—the committee came up with three hypothetical vaccines for pneumococcal infection and used data from South Africa for the test case. The vaccines in this illustration are similar but not identical to actual vaccines, and the example considers their uses in populations where vaccination against pneumococcal disease is not necessarily recommended.6
The first hypothetical vaccine under consideration, named PS23, was a polysaccharide vaccine with purified polysaccharides from 23 serotypes of bacteria, which was similar but not identical to a commercially available 23-serotype vaccine. According to the Centers for Disease Control and Prevention, a commercially available 23-valent pneumococcal vaccine has shown effectiveness of 50 to 85 percent. This information was used as baseline information for the hypothetical vaccine under consideration,
____________
6 These comparisons by the committee are for purposes of demonstrating the vaccine sensitivity analysis feature in SMART Vaccines and should not be considered as contemplating actual vaccines or their uses.
TABLE 3-1
Insights from User Groups and the Committee’s Notes
| Software Aspects | General Summary and Notes |
| Specify Demographics, Diseases, Vaccines |
|
TABLE 3-1
Continued
| Software Aspects | General Summary and Notes |
| Specify Demographics, Diseases, Vaccines (continued) |
Some of these applications focused not on the comparison of two or more different vaccines but on an even narrower question—given their chosen attributes and weights, which subsets of their population provided the best potential vaccination targets? For example, such questions might consider whether vaccination should focus more on infants and children, the elderly, or the working adult populations. |
| Evaluate Attributes, Weights, Priorities |
|
TABLE 3-1
Continued
| Software Aspects | General Summary and Notes |
| Evaluate Attributes, Weights, Priorities (continued) |
|
| Usability and Usefulness |
|
TABLE 3-1
Continued
| Software Aspects | General Summary and Notes |
| Usability and Usefulness (continued) |
|
| Decision Process |
|
TABLE 3-1
Continued
| Software Aspects | General Summary and Notes |
| Decision Process (continued) |
|
which was targeted for a population excluding infants. The hypothesized coverage and effectiveness rates, cost per dose, costs of administration, and developmental cost for this vaccine can be seen in Figure 3-13.
A second polysaccharide vaccine covering 30 serotypes—named PS30—was imagined with increased effectiveness rates but the same coverage rates as PS23 (see Figure 3-14). Because of the presumed additional complexity of creating a 30-serotype vaccine, the cost per dose was set higher than that for PS23, and the presumed developmental costs were set at the highest category—$1 billion or more. As with PS23, PS30 was also treated as a single-dose vaccine.
A third invented vaccine was a new conjugate vaccine that requires three doses to achieve the stated effectiveness, but with the potential to be deployed in all age groups. The assigned coverage and effectiveness rates can be seen in Figure 3-15.
Four attributes were selected for this demonstration to reflect a generic “public health” point of view: deaths averted, QALYs gained, direct cost savings, and cost-effectiveness ($/QALY). To minimize confounding changes, only these four attributes were used for the demonstration, and the

FIGURE 3-13
Characteristics of a hypothetical single dose 23-serotype vaccine (PS23) for pneumococcal infection in the South African population excluding infants.
ranks generated from the software’s rank-order centroid process were used without modification (see Figure 3-16). For all of these three candidates, the probability of licensure within 10 years was assumed to be 100 percent.
In the base case results, PS23 and PS30 polysaccharide vaccines scored 31 and 28, respectively, but the scores and the rank order would shift with small changes in any of the pertinent attributes (coverage, effectiveness, or costs). The PC conjugate vaccine invented for use by all ages had a SMART Score of –27. Figure 3-17 shows negative attribute values for net direct costs saved (i.e., it actually increases the total cost, including the vaccine program’s costs) and $/QALY, primarily because of the multiple-dose program and the costs per dose assumed in this scenario. Because of the positive attribute values for premature deaths averted per year and QALYs, the SMART Score for the PC vaccine is represented in a hatched bar.
To demonstrate the target product profile concept more fully, some of the key attributes were varied and the resulting changes in the scores of the hypothetical conjugate vaccine were observed. First, the expected coverage of the vaccine was increased to 80 percent. This is an external

FIGURE 3-14
Characteristics of a hypothetical single dose 30-serotype vaccine (PS30) for pneumococcal infection in the South African population excluding infants. The effectiveness of the vaccine, costs per dose, and the overall research and development and licensure costs are set to be substantially higher than those of the PS23 candidate.
factor beyond the core features of the product profile design, but it is still an important contributor to the vaccine characteristics. Holding everything else constant, this single change in the vaccine’s attributes shifted the SMART Score from –27 to –28 (see Figure 3-18). This decrease likely occurred because of the high cost per user associated with the triple-dosed vaccine.
In a second demonstration, increasing the potential length of immunity from 10 to 15 years while holding everything else constant produced a dramatic change in SMART Scores: from –27 to +4 (see Figure 3-19). This demonstrates that the length of immunity plays an integral role in a vaccine’s product profile design.
Further, by dropping the number of doses from three to two while maintaining the coverage (set at 80 percent), effectiveness (set at 80 percent), and length of immunity (set at 15 years), the cost per dose was reduced from $30 to $20. This brought the SMART Score for the conjugate vaccine to 35, surpassing the scores of the PS23 and PS30 polysaccharide vaccines (see Figure 3-20).
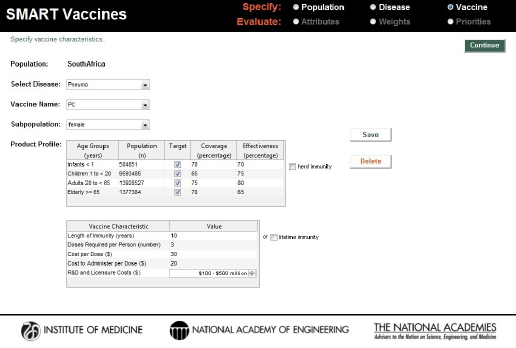
FIGURE 3-15
Characteristics of a hypothetical three-dose pneumococcal conjugate (PC) vaccine for use across all age groups in the South African population.
From a hypothetical South African decision maker’s perspective, this simulation demonstrated the following:
- Although the PS30 vaccine has greater effectiveness than PS23—because it covers more serotypes of bacteria—the added costs offset those health gains, making the two nearly identical in the eyes of the hypothetical decision maker involved in this exercise.
- The PC conjugate vaccine—in its original specification—does not provide as much value as either of the polysaccharide vaccines and would not be the vaccine of choice. But if the conjugate vaccine could be developed so that two doses provided the effectiveness originally presumed for the three dose vaccine, and if the cost per dose could be brought down to near $20 per dose, then PC becomes a stronger candidate for development compared with PS23 and PS30.
For additional analysis, one could further alter the product profile attributes of these vaccine candidates, making even greater use of the sen-
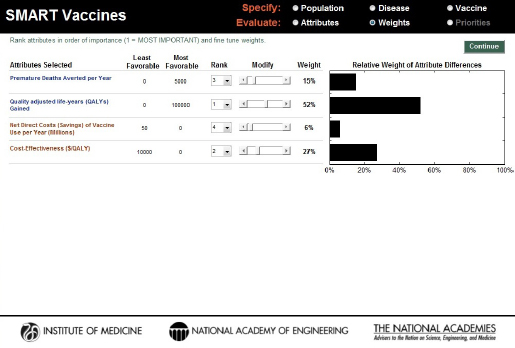
FIGURE 3-16
Attributes and weights selected using a traditional public health perspective (health and economic attributes alone) for comparing the hypothetical PS23, PS30, and PC vaccine candidates for pneumococcal infection in South Africa.
sitivity analysis capabilities in SMART Vaccines 1.1. The reader should keep in mind that the results depend on the choice of attributes and the weights assigned to them and that different preference settings could lead to completely different results. This sensitivity highlights the importance, when using SMART Vaccines, of agreeing on attributes and their weights at the beginning of any evaluation process rather than modifying those weights to achieve some preconceived result.
Just as in version 1.0, SMART Vaccines 1.1 provides detailed population data, including life-table information and average hourly wage rates, all of which are used in subsequent calculations for determining the effects of various vaccines (see Figure 3-3).7
____________
7 SMART Vaccines 1.1 eliminates a column that SMART Vaccines 1.0 contained where information was requested on Health Utilities Index 2 for age-specific determination of QALYs. That variable, used only in one attribute’s calculations, is not available except for few national populations (e.g., the British Commonwealth nations, Canada, and the United States).
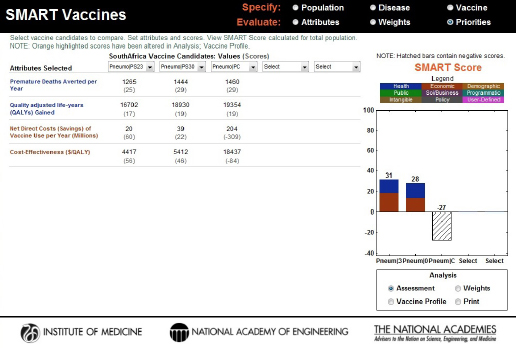
FIGURE 3-17
Computed values and initial SMART Scores for the hypothetical PS23, PS30, and PC vaccine candidates. PS23 and PS30 scored 31 and 28, respectively, and the specific contributions of health (blue) and economic attributes (red) are displayed inside the bars. The PC vaccine scored –27, and the hatched bar indicates the influence of both positive (health) and negative (economic) values on the final score.
On the page requesting information on disease burden (see Figure 3-4), users enter population-specific information about the burden of various diseases of interest. Vaccines targeting these diseases will be available for later comparison and evaluation. For each disease of interest, users must enter two types of information: disease burden data and illness descriptors.
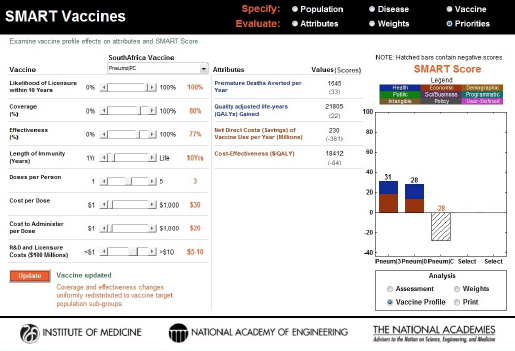
FIGURE 3-18
Changes to the SMART Score of the PC vaccine with an increase in coverage (a factor external to the product profile feature). The initial score of –27 dropped to –28, indicating that the additional costs associated with increasing the coverage outweighed the benefits for this vaccine.
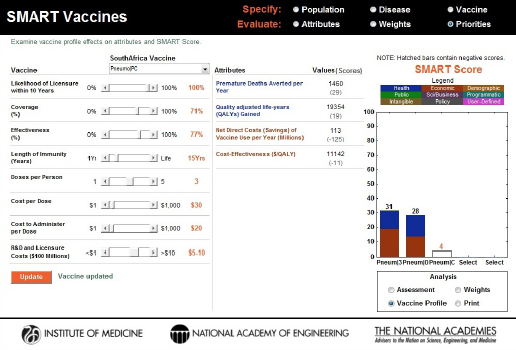
FIGURE 3-19
Changes to the SMART Score of the PC vaccine caused by an increase in the length of immunity from 10 years to 15 years. The vaccine profile (sensitivity analysis) feature shows that this one product design improvement was able to elevate the score from –27 to +4.
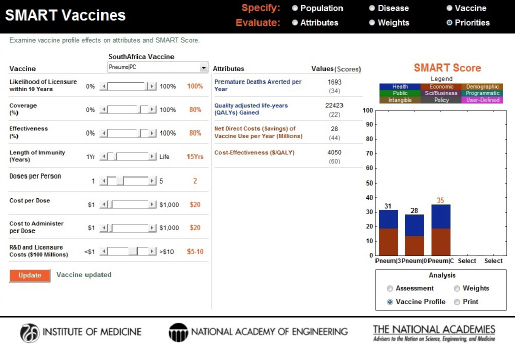
FIGURE 3-20
Changes to the coverage (increased to 80 percent), effectiveness (increased to 80 percent), length of immunity (increased to 15 years), cost per dose (decreased to $20), and the number of doses (decreased from 3 to 2) dramatically increased the SMART Score of the PC vaccine candidate from an initial score of –27 to +35, thus surpassing the scores of PS23 (31) and PS30 (28) motivating the need for product profile changes. In this way the vaccine sensitivity analysis feature in SMART Vaccines permits the reverse engineering of product attributes for gaining comparative advantage.
This page intentionally left blank.


