
Public and Stakeholder Attitudes
Controversies over the nature and function of public opinion have always been a part of discussions about the democratic process. Some theorists have argued that politically engaged citizens are essential for a true democracy, and others have emphasized the strengths of representative democracy, which relies on delegation of decision-making to elected representatives on many issues. It is beyond the scope of the present report to discuss the vast literature on the normative, philosophical, or empirical aspects of the role of public opinion in policy-making. However, in matters that are of particularly low salience to the public, policy decisions often result from interactions between decision-makers at the federal level and groups of relevant policy leaders, especially when there is a high level of agreement among the decision-makers and policy leaders.1 Because of that pattern of decision-making, in addition to a review of existing public opinion data on the topic of space exploration, the Public and Stakeholder Opinions Panel (referred to hereafter as the panel) also sought the input of those close to the policy process—those with a stake in, but not necessarily advocates of, human spaceflight.
This chapter discusses public opinion and stakeholder views on space exploration and human spaceflight, including rationales of and support for various programs. It first reviews public opinion data collected over the years by the nation’s major polling organizations and then discusses findings of a survey conducted as part of the present study to assess the views of key stakeholder groups.
The discussion of public opinion in this chapter is based on a large collection of studies, datasets, and papers related to public opinion on space exploration and human spaceflight. Considerable data on the topic have been collected over the course of several decades. This discussion of public attitudes relies on surveys that used probability sampling. The number of surveys based on nonprobability methods has grown considerably over the past few years (due, in part, to concerns about declining response rates and rising data collection costs), and they include some of the recent surveys conducted on the topic of space exploration. The accuracy of surveys based on nonprobability samples varies, and many of the newer techniques have not been adequately evaluated.2 Although
_____________
1 G.A. Almond, The American People and Foreign Policy, Harcourt, Brace and Company, New York, 1950; J.D. Miller, Space Policy Leaders and Science Policy Leaders in the United States: A Report Submitted to the National Aeronautical and Space Administration, Northwestern University, Chicago, Ill., 2004.
2 American Association for Public Opinion Research, Report on the AAPOR Task Force on Non-Probability Sampling, Deerfield, Ill., http://www.aapor.org/Reports1/6877.htm#.U3u7S9fMcfU, June 2013.
BOX 3.1
Survey Sampling and Concerns Related to Non-Probability Sampling
Most well-respected public opinion surveys are based on probability sampling, which is a sampling technique that assures that everyone in the population of interest has a known probability of selection into the sample. The statistical theories underlying probability sampling enable researchers to quantify the accuracy of the estimates made about the population of interest.
Non-probability surveys include participants without a known probability of selection. The participants could be selected by the researchers, such as in a medical research study, or self-selected, as in opt-in online panels. The lack of a clear relationship between the sample and the target population in the case of non-probability samples makes it more difficult to measure the accuracy of the estimates and makes the calculation of “sampling error” inappropriate. Even if the data are weighted to reflect the demographic composition of the target population, calculations of a sampling error can be misleading.
SOURCE: American Association of Public Opinion Research, “Opt-in Surveys and Margin of Error,” http://www.aapor.org/Opt_In_Surveys_and_Margin_of_Error1.htm#.UtmdwvMo6os, accessed January 2014.
the use of nonprobability surveys, such as opt-in on-line panels, can be appropriate in some circumstances, the review in this section is focused on public opinion data that were collected with probability techniques that are most broadly accepted by the survey community. (For additional information about probability sampling, see Box 3.1.)
It is important to note that attitudes on topics that are of relatively low interest may be more difficult to measure than attitudes on other topics. Some have argued that survey respondents are often reluctant to acknowledge that they have no opinion on an issue and that many, under perceived pressure to respond to a question, will select an answer option that does not necessarily reflect an existing attitude.3 In some cases, respondents form a preference only when asked and tend to express views that are based on considerations that happen to be most salient to them at the moment, often because they are mentioned in the question or preceding questions in the survey.4
Appendix B includes further information about the methods of the surveys that were included in this review, including the wording of the questions asked. Most of the data cited in this report are available on line from the Roper Center for Public Opinion Research at the University of Connecticut, the Inter-university Consortium for Political and Social Research at the University of Michigan, or the Web sites of the organizations that collected the data.
This section describes data on public interest in and awareness of space exploration and human spaceflight. It then discusses views of government funding for space exploration and support for specific human spaceflight missions, such as the Moon, the space shuttle, the space station, and Mars. It also discusses perceptions of the U.S. role as a leader in human spaceflight, how the public feels about international competition and cooperation, and the role of the government and the private sector in the future of space exploration and funding. Various rationales historically given for space exploration are examined, and the section concludes with a discussion of group differences (related to education, race, sex, and age) in attitudes toward space exploration.
3.1.1 Interest in Space Exploration and the Attentive Public
National survey data collected as part of the National Science Board’s Science and Engineering Indicators (a compilation by the National Science Foundation of quantitative data available on science and engineering) show that public interest in space exploration increased gradually through the 1980s and that about one-third of American
_____________
3 P. Converse, The nature of belief systems in mass publics, in Ideology and Discontent (D. Apter, ed.), Free Press, New York, 1964.
4 J.R. Zaller, The Nature and Origins of Mass Opinion, Cambridge University Press, Cambridge, U.K., 1992.
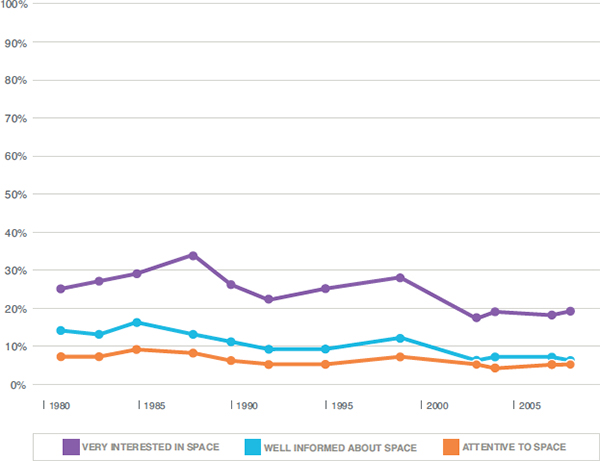
FIGURE 3.1 Public interest in, sense of being informed about, and attentiveness to space exploration, 1981-2008. SOURCE: 1981-2000: NSF Surveys of Public Attitudes; Science News Study, 2003-2007; American National Election Study, 2008
adults said that they were “very interested” in space exploration in 1988 (Figure 3.1). The loss of the space shuttle Challenger in January 1986 may have resulted in a brief boost in public interest in space exploration. Interest declined in the years after the return to flight that followed the space-shuttle accident but began to increase again in the late 1990s as the first parts of the International Space Station (ISS) were being assembled.
On the average, over the past 3 decades, about one-fourth of Americans had a high level of interest in space exploration although most Americans described themselves as interested to at least some degree. The most recent General Social Survey (GSS 2012) estimated that 21 percent of the American public was “very interested” in space exploration (an additional 44 percent was “moderately interested”).
In a landmark study, Gabriel Almond argued that citizen engagement in policy issues depends on a combination of interest in a topic and a sense of being adequately informed about it.5 That framework is useful for understanding public engagement in low-salience issues, such as space exploration. There is an “attentive public” for most policy issues, and those who fall into this category tend to follow an issue in the news, have more developed cognitive schemas about it, and retain more information on it than on issues to which they are less attentive.
_____________
5 Almond, The American People and Foreign Policy, 1950.
Because the “attentive public” is defined as those who are both very interested and well informed about a topic, the attentive public in connection with space exploration is much smaller than the interested public. During the past 3 decades, far fewer Americans felt well informed about space exploration than highly interested in it (see Figure 3.1). The proportion of American adults who were attentive to space exploration (both very interested and well informed) has been in single digits, rising to 9 percent in 1985 just before the Challenger disaster and dropping to 5 percent in recent years.
Public interest in space exploration is modest relative to that in other public policy issues (Figure 3.2). The 2012 GSS found the proportion “very interested” in space exploration tied with the proportions “very interested” in international and foreign-policy issues; these topics were at the bottom of 10 issues asked about and trailed new inventions and technologies (42 percent) and new scientific discoveries (41 percent).
3.1.2 Support for Spending on Space Exploration
Public opinion of NASA has been relatively positive and stable over the years. An October 2013 study by the Pew Research Center found that NASA is one of the government agencies with the most favorable views among the public: 73 percent of respondents had a “very favorable” or a “mostly favorable” view of NASA (Pew 10/13).
Despite favorable attitudes toward NASA, there is relatively little public support for increased spending for space exploration (Figure 3.3). According to GSS data, over the past 40 years, about 10-20 percent of the general public thought that we were spending too little on space exploration, and higher percentages (about 30-60 percent) regarded spending as too high, although the size of this group has declined. The gap between the too-little and too-much groups was more than 50 percentage points in 1973 and had shrunk to about 10 percentage points by 2012. In the most recent survey, 22 percent of respondents said that we were spending too little on space exploration and 33 percent too much.
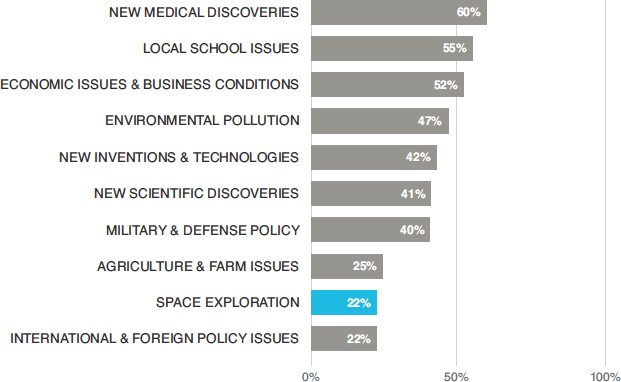
FIGURE 3.2 Percentage of respondents “very interested” in various issues. SOURCE: General Social Survey, 2012.
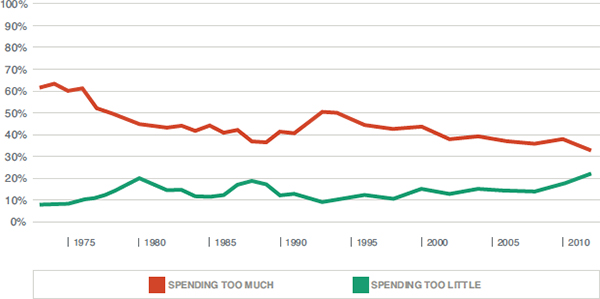
FIGURE 3.3 Public opinion about spending on space exploration, 1972-2012. SOURCE: General Social Survey, 1972-2012.
Although only a minority of the public expresses a desire to increase spending on space exploration, support for increased spending is higher among those who are interested in space exploration. In the 2012 GSS, 45 percent of those who said that they were very interested in space exploration said that we were spending too little on space exploration (compared with 11 percent of the moderately interested and 6 percent of those who were not at all interested).
In some cases, support for spending on space exploration appears to depend on how the question is asked. For example, a Gallup survey conducted in 2006 for the Space Foundation (Gallup 8/06) said to respondents that “NASA’s budget request this year is under one percent of the federal budget which would amount to approximately $58 per year for the average citizen. Do you think the nation should continue to fund space exploration?” and then asked whether the nation should fund space exploration at increased or decreased levels. About 31 percent said that funding should be increased, including 9 percent who said “significantly” increased. The questions come from different surveys and the difference in wording is not the only difference in the survey method, but support for increased spending in the Gallup survey is double the 15 percent who said that we were spending too little on space in the GSS survey of the same year. Those types of differences, which depend on whether cost or other relevant considerations are mentioned in a survey question and how the cost information is framed, are common in attitude measurement.
Space exploration generally fares poorly in comparison with other possible spending priorities. The 2012 GSS asked about 18 national problems, and space exploration ranked 16th in the proportion of respondents who thought that the government was spending too little. Only foreign aid and welfare spending were less popular than space exploration.
That is not a recent development. In a 2004 Pew Research Center study about priorities for the president and Congress, just 10 percent said “expanding America’s space program” should be “top priority,” putting it last among 22 choices (Pew 1/04). The next-lowest items and percentages were “reforming the campaign finance system” with 24 percent and “dealing with global trade issues” with 32 percent. Other polls that asked respondents over the years to attach spending priorities to federal programs have typically found funding for space exploration near the bottom.6
_____________
6 R.D. Launius, Public opinion polls and perceptions of U.S. human spaceflight, Space Policy 19:163-175, 2003; S.A. Roy, E.C. Gresham, and C.B. Christensen, The complex fabric of public opinion on space, Acta Astronautica 47:665-675, 2000.
3.1.3 Trends in Support for Specific Human Spaceflight Missions
Relatively few people say that they are very interested in the topic of space exploration and even fewer feel well informed about it, but a higher proportion of the public has expressed support for specific human spaceflight programs over the years. This section discusses support for the Apollo program, the space shuttle, and a Mars mission.
3.1.3.1 The Apollo Program
Launius7 reviewed poll results of the question “Should the government fund human trips to the Moon?” at the height of the space race in the 1960s and found that the American public was hesitant about pursuing the Apollo program. Surveys that mentioned a cost for the Apollo program found relatively little support for it. A Gallup poll in May 1961, shortly before the program began, found just one-third willing to spend “40 billion dollars—or an average of $225 a person” to send a man to the Moon (Gallup 5/61). A Harris Poll conducted in July 1967 found just one-third saying that they felt that it was worth spending $4 billion a year for the next 10 years to do so (HI 7/67). A Gallup poll in 1967 found that just one-third thought that it was important to send a man to the Moon before Russia did (Gallup 2/67).
Although spending on a Moon mission was not very popular during the 1960s and 1970s, in hindsight the views of the general public about the Apollo program have become more favorable (Figure 3.4). When asked in 2009 to look back, 71 percent of the respondents to a CBS News poll said that the program had been worth it. About 15 years earlier, in 1994, the poll had put the number at 66 percent; 15 years before that, in 1979, just 47 percent said that it had been worth it (CBS 7/09; CBS/NYT 6/94, 7/97).
3.1.3.2 The International Space Station and the Space Shuttle
The first component of the ISS was put into place in late 1998. Attitudes of Americans toward the planned construction of a large space station were favorable during the decade preceding the construction (Table 3.1). In 1988, slightly more than 70 percent of American adults agreed or strongly agreed that the space station should be built. In 1992, support had dipped to 58 percent; then it grew again slightly closer to the launch of the initial component of the current space station (NSF Surveys of Public Attitudes 1988, 1992, 1997, 1999).
Figure 3.4 shows two time series of support for the Space Shuttle Program: one based on a question asking whether the space shuttle was a good investment for the country (CBS/NYT 1/87, 1/88, 10/88; CBS 12/93, 8/99, 7/05) and the other based on a question asking whether the space shuttle was worth continuing. The final two data points in each series still show a majority favoring the Space Shuttle Program. In the earlier decades, both sets of surveys show 60-70 percent of the public supporting the program.
3.1.3.3 A Mars Mission
A CBS News poll in 2009 found more respondents favoring than opposing “the U.S. sending astronauts to explore Mars” by a margin of 51-43 percent (CBS 7/09). Other readings on the same question in earlier polls showed somewhat stronger support in the 1990s (Favor-Oppose): 1994, 55-40 (CBS/NYT 6/94); 1997, 54-41 (CBS 7/97); 1999, 58-35 (CBS 8/99) (see Figure 3.4).
The distribution of the responses shifts when cost is factored in. A Gallup survey in 2005 asked whether respondents would favor or oppose “setting aside money for such a project” and found 40 percent in favor and 58 percent opposed (Gallup/CNN/USA Today 6/05). That distribution is roughly the same as when Gallup asked the same question in 1969 and 1999 (Gallup 7/69, 7/99). A 2004 Associated Press (AP)-Ipsos survey asked “As you may have heard, the United States is considering expanding the space program by building a permanent space station on the Moon with a plan to eventually send astronauts to Mars. Considering all the potential costs and benefits, do you favor expanding the space program this way or do you oppose it?” It found 48 percent on each
_____________
7 R.D. Launius, Why go to the Moon? The many faces of lunar policy, Acta Astronautica 70:165-175, 2012.
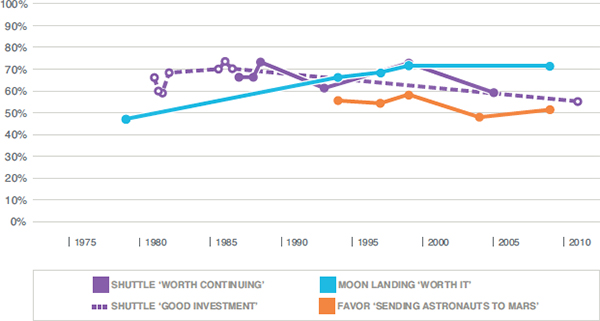
FIGURE 3.4 Public support for the space shuttle, Moon landing, and Mars mission, 1979-2011. SOURCE: Shuttle continuation: CBS/NYT (1987, 1988), CBS (1993, 1999, 2005); Shuttle investment: NBC/AP (1981,1982), NBC/WSJ (1985,1986), Pew (2011); Moon landing: CBS/NYT (1979, 1994), CBS (1997, 1999, 2009); Mars: CBS/NYT (1994), CBS (1997, 1999, 2004, 2009).
TABLE 3.1 Support for Building “a space station large enough to house scientific and manufacturing experiments,” 1988-1999
| Year | ||||
| 1988 | 1992 | 1997 | 1999 | |
| Strongly agree | 11% | 10% | 12% | 9% |
| Agree | 61 | 48 | 51 | 55 |
| Not sure | 5 | 5 | 6 | 6 |
| Disagree | 22 | 31 | 26 | 27 |
| Strongly disagree | 1 | 6 | 5 | 3 |
SOURCE: National Science Foundation Surveys of Public Attitudes Toward and Understanding of Science and Technology.
side of the issue (AP/Ipsos 1/04). (Half the sample received a slightly different version of the question, which replaced “the United States” with “the Bush Administration.” The latter wording found 43 percent in support and 53 percent opposed.)
The 2007 Science News Study included a question on support for a crewed Mars mission. Respondents were asked to agree or disagree with the statement “The United States should begin planning for a manned mission to Mars in the next 25 years.” Fifty years after the launch of Sputnik, 40 percent agreed with the statement, and 58 percent disagreed (Science News Study 2007). An NSF survey asked the question with similar wording in 1988, and attitudes were more favorable then, with 51 percent agreeing and 41 percent disagreeing (NSF Surveys of Public Attitudes 1988).
3.1.4 Human Versus Robotic Missions
Apparent support for human space exploration drops greatly when cost savings associated with robotic missions are mentioned. For example, the Gallup Organization in 2003 asked this: “Some people feel the U.S. space program should concentrate on unmanned missions like Voyager 2, which will send back information from space. Others say the U.S. should concentrate on maintaining a manned space program like the space shuttle. Which comes closer to your view?” Human space exploration was preferred over robotic missions by a margin of 52-37 percent (Gallup/CNN/USA Today 2/03). But in an AP-Ipsos poll the next year, which prefaced the question by stating that “some have suggested that space exploration on the Moon and Mars would be more affordable using robots than sending humans,” answers tilted heavily in the other direction—a preference for robots by a margin of 57-38 percent (AP/Ipsos 1/04).
Risk does not appear to play a central role as a reason not to send humans into space. Most of the public seems to accept that there are inherent dangers in exploring space. Public support for NASA and space exploration increased after the Challenger disaster. Shortly after the Columbia accident, a 2004 AP-Ipsos survey asked whether human spaceflight should be continued “in light of the space shuttle accident last February [2003] in which seven astronauts were killed,” and 73 percent said that the United States should continue to send humans into space (AP/Ipsos 1/04).
3.1.5 NASA’s Role, International Collaboration, and Commercial Firms
3.1.5.1 American Leadership and Cooperative Space Exploration
When asked in a 2011 Pew Research Center survey whether they thought that it was essential for the United States to “continue to be a world leader in space exploration,” 58 percent of the respondents said that it was essential (Pew 6/11). The percentage has fluctuated. A Time/Yankelovich poll in 1988 found that 49 percent of Americans thought it was “very important” for “this country to be the leading nation in space exploration” (Time/Yankelovich 1/88). Sixteen years later, in 2004, an AP-Ipsos poll found that 38 percent thought that it was important for the United States to be the leading nation in space (AP/Ipsos 1/04).
Although a majority of respondents in 2011 said that it was “essential for the United States to continue to be a world leader in space,” a July 2011 survey conducted by CNN/ORC found just 38 percent saying that it was “very important” for the United States “to be ahead of Russia in space exploration” (CNN/ORC 7/11). In a different era, a Gallup poll in June 1961 put that number at 51 percent (Gallup 6/61). In March 2006, Gallup asked this: “A number of Asian and European countries now have space programs of their own or have announced plans for space activities and exploration. As more countries embark on space programs, how concerned are you that the U.S. will lose its leadership in space?” (Gallup 3/06). In response, just 13 percent told Gallup that they were very concerned about the possibility, and only another 22 percent were somewhat concerned. In other measures on the topic, just 11 percent were “very concerned” that China would become the new leader in space exploration in a 2008 Gallup survey, and only another 21 percent were “somewhat concerned” (Gallup, 4/08). Two-thirds of the American public said that they would not be concerned to see this happen.
3.1.5.2 International Competition and Collaboration
Few recent surveys have explored international collaboration in depth, but the available data suggest that the public is generally in favor of it. Even in the late Cold War period of 1988, a survey by Time/Yankelovich found 71 percent of Americans saying that it would be a good idea for the United States and the Soviet Union to undertake cooperative space efforts, such as going to Mars (Time/Yankelovich 1/88). A Harris poll in July 1997 found 77 percent of the public saying that they favor “joint space missions involving Americans, Russians and people from other countries,” and 66 percent favored putting a joint U.S. and international space station in orbit (HI 7/97). A CBS survey later in 1997 found two-thirds of respondents saying that the United States should work with Russia on space missions (CBS 7/97). Finally, even when told in 2008 that the United States would have a
5-year gap between the space shuttle’s last mission and new programs and that it would depend on Russia to get to and from the space station, only 13 percent that said they were “very concerned” (Gallup 4/08).
3.1.5.3 The Role of the Private Sector
There is little in the survey literature about the public’s views about the roles of government and the private sector in the exploration of space or human spaceflight; this reflects both the low salience of space exploration and the relatively recent emergence of private space activities. A 1997 survey by Yankelovich found that 53 percent thought that the space program should be funded and managed by the government, whereas 30 percent favored private business (Yankelovich 12/97). A 2011 CNN question found that 54 percent of American adults thought that the United States should rely more on private companies to run human space missions in the future, compared with 38 percent who wanted to keep human spaceflight primarily a government function (CNN/ORC 7/11). Those two results suggest that the public is becoming more receptive to private commercial activity in space, but it is difficult to draw firm conclusions from so few survey results.
3.1.6 Rationales for Support of Space Exploration
A few surveys have probed for rationales underlying public support of space exploration. Most of them have offered specific rationales in closed-ended questions. Not surprisingly, the apparent level of support for many rationales is less when an open-ended format is used than when the rationales are explicitly mentioned in the question. Therefore, when analyzing responses to closed-ended questions, it is useful (where possible) to examine the proportion who strongly agree with a rationale as a potentially more valid indicator of the depth of support for the rationale. However, surveys have used different forms of closed-ended questions, and there is no comparable series with which to evaluate changes in public support of one or another rationale. Taking the available surveys together, the conclusion seems to be that no rationale garners overwhelming support from the public.
In response to an open-ended CBS/NYT poll in 1994, 56 percent of the public said that the best reason for exploring space was to increase knowledge or to search for other life forms (CBS/NYT 6/94). No other reason was offered by more than 7 percent of the respondents; economic benefits and national security were both cited by 3 percent, and national pride and leadership in space by just 1 percent. About one-fourth of the respondents said that they did not know or provided no reason.
A June 2004 Gallup survey used a closed-ended question to ask respondents to choose among various rationales to indicate what they considered to be the main reason for continuing to explore space (Gallup 6/04). Some 29 percent chose the rationale that it is human nature to explore, 21 percent the need to maintain our status as an international leader in space, 18 percent the benefits on Earth, 12 percent keeping our nation safe, and 10 percent the idea that space exploration inspires us and motivates our children. (This survey did not include the rationale of increasing knowledge.)
As Table 3.2 shows, a 2011 Pew survey that used three closed-ended questions found that 34-39 percent of the public agreed that the space program “contributed a lot” to each of the following: encouraging people’s interest in science and technology, scientific advances, and national pride and patriotism (Pew 2011).
TABLE 3.2 Support for Rationales for the Space Program, 2011
| How much does the U.S. space program contribute to… | A lot | Some | Not much/Nothing | No Opinion |
| Encouraging people’s interest in science and technology | 39% | 35% | 22% | 4% |
| Scientific advances | 38 | 36 | 22 | 5 |
| This country’s national pride and patriotism | 34 | 34 | 28 | 5 |
SOURCE: Pew Research Center.
A number of other surveys conducted by Gallup over the past decade show a similar mix of rationales for space exploration:
- In 2004, 34 percent strongly agreed that “the quality of our daily lives has benefitted from the knowledge and technology that have come from our nation’s space program” (68 percent overall agreement) (Gallup 6/04).
- In 2005, 32 percent strongly agreed that the space program gives American science and technology an edge to compete in the international marketplace (80 percent overall agreement), and 28 percent strongly agreed that the American space program benefits the economy by inspiring students (76 overall agreement) (Gallup 5/05).
- In 2008, 23 percent strongly agreed that “the scientific, technical and other benefits of space exploration are worth the risks of human space flight” (68 percent overall agreement) (Gallup 4/08).
- In 2008, 21 percent strongly agreed that the space program inspires young people to consider education in science, technology, engineering, and mathematics (STEM) fields “a great deal” (69 percent overall agreement) (Gallup 4/08).
The proportion who felt strongly about a benefit of the space program in those surveys was 21-34 percent.
3.1.7 Correlates of Support for Space Exploration
The preceding review found relatively modest levels of support for increased spending on space exploration among the general public—adults 18 years old and older. But a closer examination of the survey results indicates that some segments of the public hold more or less favorable views of space exploration. To explore those patterns, the panel examined a number of questions by age, sex, race, education, and partisanship on the basis of a study conducted by the Pew Research Center (Pew 2011). The entries in Table 3.3 show the percentage who believe that the space shuttle was a good investment, the percentage who believe that it is essential for the United States to play a leadership role in space exploration, and the percentages of those who said that the space program contributes “a lot” to national pride and patriotism, to scientific advances that all Americans use, and to encouragement of interest in science and technology.
The data in Table 3.3 show that men are generally more favorably disposed to the space program than women and whites generally more than blacks. The panel also examined the variables that predict favorable answers to at least four of the five questions in the 2011 Pew survey. A multivariate logistic regression model again showed that sex and race were the strongest predictors of support for the space program.
The panel carried out a similar analysis of the 2012 GSS items on spending priorities (“We are faced with many problems in this country, none of which can be solved easily or inexpensively. I’m going to name some of these problems, and for each one I’d like you to tell me whether you think we’re spending too much money on it, too little money, or about the right amount.…The space exploration program?”), focusing on the proportion of respondents who said that we spend too little on space exploration (Table 3.4).
A multivariate logistic regression model indicates that the differences by sex, race, and education are all statistically significant. Men were more likely to say that we are spending too little on space exploration than women; whites more likely than members of other races, especially blacks; and college graduates more likely than respondents who have less education.
To explore the issue further, the panel looked at data from the Longitudinal Study of American Youth (LSAY), a longitudinal study that began to follow a national sample of 7th- and 10th-grade students in 1987. The LSAY young adults in 2011 were 37-40 years old and represent the center of the age distribution of Generation X. Looking at five points along the longitudinal record, the panel examined the distribution of interest, sense of being informed, and issue attentiveness (LSAY 1987, 1988, 1989, 2008, 2011). The level of student and young-adult interest in space exploration was relatively constant during the high-school years, about one-fifth of students expressing a high level of interest in space exploration (Table 3.5). The level of interest in space exploration increased slightly in young adulthood when most of the respondents in the LSAY had completed their formal education and were engaged in starting families and careers. The sense of being well informed about space exploration was lower than
TABLE 3.3 Support for Space Exploration, by Item and Demographic Group, 2011
| Space program contributes a lot to: | |||||
| Shuttle Good Investment | U.S. Space Leadership Essential | National Pride and Patriotism | Scientific Advances | Encouraging Interest in Science and Technology | |
| Total U.S. | 55% | 58% | 35% | 38% | 39% |
| Sex | |||||
| Male | 59 | 60 | 37 | 45 | 44 |
| Female | 52 | 57 | 32 | 31 | 34 |
| Race/Ethnicity | |||||
| White | 59 | 60 | 36 | 39 | 39 |
| Black | 39 | 49 | 21 | 36 | 37 |
| Other | 49 | 58 | 33 | 34 | 40 |
| Age, years | |||||
| 18-29 | 54 | 62 | 30 | 35 | 40 |
| 30-49 | 55 | 59 | 32 | 38 | 38 |
| 50-64 | 55 | 56 | 36 | 38 | 38 |
| 65 and over | 56 | 58 | 41 | 41 | 39 |
| Education | |||||
| H.S. graduate or less | 47 | 56 | 33 | 33 | 35 |
| Some college | 56 | 60 | 33 | 43 | 45 |
| College graduate or more | 66 | 60 | 37 | 40 | 39 |
| Ideology | |||||
| Conservative | 59 | 65 | 37 | 41 | 40 |
| Moderate | 56 | 58 | 35 | 37 | 40 |
| Liberal | 52 | 50 | 33 | 37 | 39 |
| Working | |||||
| Full-time | 58 | 59 | 33 | 39 | 40 |
| Part-time | 50 | 59 | 31 | 35 | 45 |
| Not working | 54 | 58 | 37 | 37 | 36 |
SOURCE: Pew Research Center.
the level of interest throughout the high-school years, reflecting the same pattern found in national adult samples over the past 3 decades. The sense of being well informed about space declined after high school in the aggregate, only 6 percent of LSAY young adults claiming to be well informed about space exploration as they approached the age of 40 years (see Table 3.5). Overall, the proportion of LSAY young adults who can be described as attentive to space exploration is similar to the proportions reported in national samples of adults in the same years.
3.1.8 Summary of Findings on Public Opinion
The American public’s overall views of NASA, space exploration, and human spaceflight programs are generally favorable, but public opinion data show that most members of the public do not have a strong interest in or feel well informed about this topic. Survey data collected over the years indicate that an average of about one-fourth of U.S. adults say that they have a high level of interest in space exploration. During the past few decades, estimates of the proportion of American adults who were both very interested in space exploration and felt well informed about it (the attentive public) has been consistently under 10 percent. The public’s interest in space exploration is particularly low in comparison with its interest in other policy issues.
A substantial group sees the United States as spending too little on space exploration, but a larger group feels that the country is spending too much, although the proportion of those who say that the country is spending too
TABLE 3.4 Proportion Saying That “We spend too little/too much on space exploration,” by Demographic Group, 2012
| Spending Too Little | Spending Too Much | |
| Total U.S. | 22% | 32% |
| Sex | ||
| Male | 28 | 28 |
| Female | 18 | 35 |
| Race/Ethnicity | ||
| White | 26 | 29 |
| Black | 11 | 49 |
| Other | 13 | 33 |
| Age, years | ||
| 18-29 | 19 | 24 |
| 30-49 | 24 | 34 |
| 50-64 | 20 | 35 |
| 65 and over | 24 | 35 |
| Education | ||
| H.S. graduate or less | 15 | 38 |
| Some college | 21 | 30 |
| College graduate or more | 32 | 26 |
| Ideology | ||
| Conservative | 26 | 29 |
| Moderate | 19 | 36 |
| Liberal | 22 | 30 |
| Working | ||
| Full-time | 23 | 31 |
| Part-time | 19 | 31 |
| Not working | 22 | 35 |
SOURCE: General Social Survey.
TABLE 3.5 Development of Interest in Space Exploration, 1987-2011
| Grade/Year | |||||
| Grade 10 | Grade 11 | Grade 12 | 2008 | 2011 | |
| Interest in space exploration | |||||
| Very interested | 16% | 20% | 17% | 18% | 24% |
| Moderately interested | 48 | 51 | 53 | 52 | 48 |
| Not interested | 36 | 29 | 30 | 30 | 28 |
| Informed about space exploration | |||||
| Very well informed | 11 | 13 | 11 | 6 | 6 |
| Moderately well informed | 50 | 53 | 51 | 42 | 43 |
| Not well informed | 39 | 34 | 38 | 52 | 51 |
| Attentiveness to space exploration | |||||
| Attentive | 6 | 7 | 6 | 4 | 4 |
| Interested | 10 | 13 | 11 | 13 | 17 |
| Residual | 84 | 80 | 83 | 83 | 79 |
SOURCE: Longitudinal Study of American Youth.
much appears to have been declining. Support for increased spending is higher among those who are interested in space exploration. Among the general public overall, support for space-exploration funding tends to be low, especially in comparison with support for other possible spending priorities. Those trends—generally positive views of space exploration and human spaceflight programs but low support for funding increases and low levels of public engagement—have held true for a few decades. Although the level of interest spiked around the time of some major space events, it never fluctuated by more than about 10 percentage points.
No particular rationale for space exploration consistently attracts support from a clear majority of the American people. One survey discussed above found that a little over half the respondents gave reasons for space exploration that could be described as “increasing knowledge and searching for other life forms,” but most surveys found responses divided among several rationales, none of them garnering strong agreement from a majority of the respondents.
Although space exploration has had a substantial effect on American society, space policy can be described as an issue that has low visibility in public discourse.8 Because relatively few members of the public pay close attention to space exploration, policy leaders and stakeholder groups are likely to have more effect than the general public on policy decisions in this realm.
In 2003, Miller conducted a survey of policy leaders on the topic of space exploration.9 To construct a sampling frame for the survey, Miller identified the positions likely to be influential in the formulation of space policy and then identified the individuals who occupied these positions. Miller argued that because space policy is closely intertwined with science policy, in addition to space policy leaders, policy leaders in non-space-related fields also have substantial influence on decisions related to space policy. On the basis of that conceptualization, his study included leading scientists and engineers in research universities and selected corporations; the leadership of major universities, corporations, and organizations active in scientific or space-related work; scientific, engineering, and other professional societies relevant to space science and engineering; and the leadership of relevant voluntary associations.
To learn more about the views of stakeholders, the panel conducted a survey that relied on Miller’s general approach for building a sampling frame. For the purposes of this study, stakeholders were defined as those who may reasonably be expected to have an interest in NASA’s programs and to be able to exert some influence over its direction. In addition to the groups typically viewed as NASA’s stakeholders,10 scientists from non-space-related fields were added as a group of interest because of their influence on the formulation of space policy, as described above. A brief description of each of the eight stakeholder groups is provided in Table 3.6.
The sampling frame for the stakeholder survey was built by identifying leadership positions within each of the stakeholder groups of interest and then identifying the individuals who were occupying the positions. Within each group, a systematic random sample was drawn for the survey. Table 3.6 shows the initial sampling frames and sample sizes and the response rates for each group. Because “NASA’s stakeholders” are not a clearly defined population and because the stakeholders were selected by using sampling frames that were reasonable and convenient rather than comprehensive, the results from this survey cannot be generalized to all stakeholders. In addition, no attempt was made to weight the data to compensate for differences in the sizes of the various groups or overlaps in their composition. As a result, combining the responses from the groups does not represent the universe of all NASA stakeholders. Nevertheless, the sample for each group was a probability sample, and this method provides a broader and more diverse perspective on stakeholder views than a nonprobability sample would. A detailed description of the methods used to conduct the survey, including more information about the sampling frame, can be found in Appendix C.
_____________
8 Miller, Space Policy Leaders and Science Policy Leaders in the United States, 2004.
9 Ibid.
10 B. Cameron and E.F. Crawley, “Architecting Value: The Implications of Benefit Network Models for NASA Exploration,” paper presented at the AIAA SPACE 2007 Conference & Exposition, Long Beach, Calif., 2007.
TABLE 3.6 Stakeholders Included in the Survey
| Stakeholders | Description | Size of Sampling Frame | Size of Sample | Number of Complete Cases | Response Rate (AAPOR 3),a% |
| Economic/industry | For-profit companies that interact directly or indirectly with NASA (e.g., contractors and aerospace firms); states that have an economic interest in the issue | 573 | 384 | 104 | 28.6 |
| Space scientists/engineers | Top scientists and engineers in relevant fields | 919 | 395 | 261 | 67.1 |
| Young space scientists and engineers | Up-and-coming scientists and engineers in relevant fields | 549 | 195 | 90 | 49.7 |
| Other scientists and engineers | Top scientists and engineers in non-space-related fields | 6,106 | 396 | 201 | 51.3 |
| Higher education | Deans and heads of academic departments that could reasonably be expected to have some students with an interest in space | 766 | 399 | 294 | 74.1 |
| Security/defense/foreign policy | Top experts and researchers working in fields related to national security/defense who can reasonably be expected to have an interest in space issues | 115 | 110 | 71 | 66.4 |
| Space writers and science popularizers | Space writers, science journalists, bloggers, planetarium and public observatory directors | 1,096 | 99 | 53 | 56.4 |
| Space advocates | Officers and board members of space-advocacy groups | 267 | 96 | 46 | 51.7 |
| Total (not including duplicates across strata) | 10,391 | 2,054 | 1,104 | 55.4 | |
a The AAPOR 3 response rate estimates what proportion of cases of unknown eligibility is actually eligible and is based on a formula recommended by the American Association for Public Opinion Research, http://www.aapor.org/AM/Template.cfm?Section=Standard_Definitions2&Template=/CM/ContentDisplay.cfm&ContentID=3156.
This section discusses the findings of the stakeholder survey, including stakeholder views about the rationales for space exploration in general and human spaceflight specifically, and possible directions for NASA’s human spaceflight program. Appendix D contains the paper questionnaire used for the survey (further information about the data-collection instruments, including the two versions of the questionnaires, is included in Appendix C with the detailed description of the survey methods). We do not include here a detailed discussion of each question by stakeholder group but instead summarize the data to highlight comparisons guided by the content of the questions. Appendix E includes the frequency distributions of the responses to each survey question by stakeholder group.
3.2.1 Characteristics of the Respondents
Because the stakeholder survey focused on the leadership of relevant organizations and leading scientists in the field, the respondents tended to be older than the general population, to be more likely to have advanced degrees,
and to be more likely to be male (Table 3.7). About half the respondents were academics, and about one-fourth held managerial or professional positions. About 11 percent described themselves as nonteaching scientists and about 9 percent as engineers.
Respondents were asked whether they were involved in space-related work, and about half said that they were very involved or somewhat involved. About 20 percent of the sample members were scientists who were selected specifically from non-space-related fields, but the sample also included others who were part of the leadership of organizations that do space-related work, regardless of whether the respondents personally characterized themselves as involved in space-related work. The sample also included deans, chairs, and department heads of academic programs in fields related to space but not necessarily only space. Many of these respondents were not conducting space-related work themselves. About 40 percent of those who said that they were involved in space-related work said that they were very or somewhat involved in work related to human spaceflight.
TABLE 3.7 Characteristics of the Respondents
| Characteristics | Count | % |
| Age, years | ||
| Under 40 | 127 | 12 |
| 40-49 | 109 | 10 |
| 50-59 | 292 | 26 |
| 60-69 | 273 | 25 |
| 70 or over | 277 | 25 |
| No answer | 26 | 2 |
| Sex | ||
| Male | 936 | 85 |
| Female | 152 | 14 |
| No answer | 16 | 2 |
| Education attainment | ||
| High school or some college | 12 | 1 |
| Bachelor’s degree | 95 | 9 |
| Master’s degree | 147 | 13 |
| Professional degree | 46 | 4 |
| Doctorate | 791 | 72 |
| No answer | 13 | 1 |
| Current position | ||
| Postsecondary educator | 460 | 50 |
| Scientist in a nonteaching position | 105 | 11 |
| Engineer | 82 | 9 |
| Managerial or professional | 224 | 24 |
| Other | 53 | 6 |
| Not employed/retired | 158 | 14 |
| No answer | 20 | 2 |
| Involved in space-related work | ||
| Very involved | 233 | 21 |
| Somewhat involved | 325 | 29 |
| Not involved | 532 | 48 |
| No answer | 14 | 1 |
| Involved in work related to human spaceflight | ||
| Very involved | 75 | 13 |
| Somewhat involved | 150 | 27 |
| Not involved | 333 | 60 |
| No answer | 0 | 0 |
Unless otherwise noted, for the purposes of the analyses presented in this report, the term space scientist/engineer will be used to refer to space scientists and engineers who reported in the survey that they were involved in space-related work (n = 198), regardless of whether they were initially included in the sample as part of the “space scientists and engineers” group or the “other scientists and engineers” group. The term nonspace scientist/engineer will be used to refer to scientists and engineers in the “space scientists and engineers” and “other scientists and engineers” groups who said that they were not involved in space-related work (n = 264). Although the decision to reassign some cases from one stakeholder group to another on the basis of self-reported responses might seem somewhat unconventional, it helps to compensate for the sparseness of the information that was available from the initial sampling frame.
3.2.2 Rationales for Space Exploration and Human Space Exploration
One of the primary goals of the survey was to understand stakeholder views on the rationales for space exploration and human space exploration. Before being presented with a list of rationales that commonly surfaces in the literature and discussions in the space community, respondents were asked what they considered to be the main reasons for (and against) space exploration and human spaceflight in an open-ended format. The results are presented in Table 3.8.
In the case of space exploration, reasons related to pursuing knowledge and scientific understanding were the most frequently mentioned. Technological advances and arguments related to a basic human drive to explore new frontiers were also mentioned spontaneously by about one-third of the respondents.
In terms of human space exploration, the rationales were more divided. The three most frequently mentioned arguments, each offered by about one-third of the respondents, were that humans are able to accomplish more than robots in space, that humans have a basic drive to explore new frontiers, and that human space exploration
TABLE 3.8 Reasons for Space Exploration and Human Spaceflight (Open-Ended, All Mentions)
| Reason for Space Exploration | % Mentioned | Reason for Human Spaceflight | % Mentioned |
| Knowledge and scientific understanding | 78 | Humans can accomplish more than robots | 32 |
| Technological advances | 35 | Basic human drive to explore new frontiers | 30 |
| Basic human drive to explore new frontiers | 32 | Knowledge and scientific understanding | 28 |
| Human economic activity beyond Earth | 11 | Future settlements in space | 18 |
| Future settlements in space | 8 | Technological advances | 14 |
| U.S. prestige | 7 | Public support | 9 |
| Careers in science, technology, mathematics, and engineering | 5 | U.S. prestige | 8 |
| Search for signs of life | 5 | Careers in science, technology, mathematics, and engineering | 6 |
| National security | 5 | Human economic activity beyond Earth | 5 |
| Prevent threats from space | 3 | International cooperation | 2 |
| International cooperation | 3 | National security | 2 |
| Commercial space travel | 0 | Search for signs of life | 2 |
| Other | 8 | Commercial space travel | 0 |
| None/No compelling reason for space exploration | 0 | Prevent threats from space | 0 |
| Other | 7 | ||
| None/No compelling reason for human space exploration | 6 | ||
can improve knowledge and scientific understanding. Working toward the establishment of future settlements in space was mentioned by about one-fifth of the respondents.
For both space exploration and human spaceflight, the same pattern of rationales emerged from the responses of those who said that they were involved in space-related work and from those who said that they were not.
To understand the pattern and strength of the rationales, for each response to the open-ended questions about the main reasons for space exploration and human spaceflight the panel recorded the rationale mentioned first (Table 3.9). For space exploration, in 60 percent of cases, the first rationale provided contained a reference to knowledge and scientific understanding. In the case of the main reasons provided for human spaceflight, the same pattern emerged for first mentions as for responses to the question overall: first mentions were divided among the idea that humans can accomplish more than robots (23 percent), a basic human drive to explore (21 percent), and knowledge and scientific understanding (19 percent).
After being asked to describe the rationales in an open-ended format, respondents were presented with a list of rationales historically given for space exploration and were asked to indicate for each whether they consider it “very important,” “somewhat important,” “not too important,” or “not at all important” as a reason for space exploration in general and for human spaceflight in particular.
“Expanding knowledge and scientific understanding” emerged as the rationale that the overwhelming majority of the respondents felt was a “very important” reason for space exploration (Table 3.10). A majority of the respondents also considered driving technological advances, inspiring young people to pursue careers in STEM fields, and satisfying a basic human drive to explore new frontiers to be very important. Except for the STEM-careers rationale, that pattern is comparable with the one that emerged when respondents were asked to describe the rationales in an open-ended format. Well over half the respondents (62 percent) considered space exploration’s potential to inspire STEM careers “very important” when presented with the list, but only 5 percent mentioned it spontaneously.
TABLE 3.9 Reasons for Space Exploration and Human Spaceflight (Open-Ended, First Mentions)
| Reason for Space Exploration | % Mentioned First | Reason for Human Spaceflight | % Mentioned First |
| Knowledge and scientific understanding | 60 | Humans can accomplish more than robots | 23 |
| Basic human drive to explore new frontiers | 21 | Basic human drive to explore new frontiers | 21 |
| Technological advances | 9 | Knowledge and scientific understanding | 19 |
| Future settlements in space | 2 | Future settlements in space | 10 |
| U.S. prestige | 2 | None/No compelling reason for human space exploration | 6 |
| Other | 2 | Public support | 6 |
| Human economic activity beyond Earth | 2 | Other | 4 |
| Careers in science, technology, mathematics, and engineering | 1 | Technological advances | 4 |
| Search for signs of life | 1 | U.S. prestige | 4 |
| National security | 1 | Careers in science, technology, mathematics, and engineering | 2 |
| Prevent threats from space | 0 | Human economic activity beyond Earth | 1 |
| International cooperation | 0 | National security | 0 |
| None/No compelling reason for human space exploration | 0 | International cooperation | 0 |
| Commercial space travel | 0 | Search for signs of life | 0 |
| Commercial space travel | 0 | ||
| Prevent threats from space | 0 | ||
TABLE 3.10 Reasons for Space Exploration and Human Spaceflight (% Very Important)
| Reason for Space Exploration | % Very Important | Reason for Human Spaceflight | % Very Important |
| Expanding knowledge and scientific understanding | 84 | Inspiring young people to pursue careers in science, technology, engineering, and mathematics | 47 |
| Driving technological advances | 66 | Satisfying a basic human drive to explore new frontiers | 45 |
| Inspiring young people to pursue careers in science, technology, engineering, and mathematics | 62 | Driving technological advances | 40 |
| Satisfying a basic human drive to explore new | 60 | Expanding knowledge and scientific | 38 |
| frontiers | understanding | ||
| Maintaining our national security | 41 | Paving the way for future settlements in space | 31 |
| Creating opportunities for international cooperation | 33 | Enhancing U.S. prestige | 27 |
| Enhancing U.S. prestige | 29 | Creating opportunities for international cooperation | 26 |
| Paving the way for future settlements in space | 22 | Paving the way for commercial space travel | 21 |
| Extending human economic activity beyond Earth | 21 | Extending human economic activity beyond Earth | 18 |
| Paving the way for commercial space travel | 17 | Maintaining our national security | 17 |
The stakeholder groups differed in their overall enthusiasm for the rationales, but the same four rationales received the most support in all the groups, and “expanding knowledge and scientific understanding” received more support in all the groups than any of the other rationales.
In the case of human spaceflight, no rationale drew a majority of responses as very important even when respondents were given the list in a closed-ended format. Inspiring young people to pursue STEM careers and satisfying a basic human drive to explore new frontiers were the rationales that were most frequently cited as very important, followed by driving technological advances and expanding knowledge and scientific understanding, but no rationale was viewed as a very important reason for human spaceflight by a majority of the respondents. Again, the top rationales tended to be the same among the different stakeholder groups, although space scientists and engineers were more likely to consider enhancing U.S. prestige a very important reason (33 percent said this), and space advocates were more likely to consider paving the way for future settlements in space a very important reason (61 percent) than expanding knowledge and scientific understanding.
Those who selected more than one rationale as “very important” were asked to indicate which was “most important.” For space exploration in general, 58 percent of these respondents chose “expanding knowledge and scientific understanding” and mentioned all the other rationales far less frequently (Table 3.11). In the case of human spaceflight, views of the “most important” rationale were again divided: 22 percent of the respondents said “satisfying a basic human drive to explore new frontiers,” 18 percent said “inspiring young people to pursue careers in science, technology, math and engineering,” and 16 percent said “expanding knowledge and scientific understanding.”
To probe the rationales from an additional perspective, the panel asked respondents to describe in an open-ended format what they thought would be lost if NASA’s human spaceflight program were terminated (Table 3.12). The most frequently cited argument (by one-fourth of respondents) was that U.S. prestige would suffer. About 15 percent of the respondents provided answers that could be summed up as “nothing would be lost.” Nonspace scientists/engineers were most likely to say that nothing would be lost (29 percent), and young space scientists were least likely to say that nothing would be lost (1 percent).
Respondents were given an opportunity to voice arguments against both space exploration and human spaceflight. About one-fourth either did not provide a response to the question about reasons against space exploration or said that there are no reasons (or no compelling reasons) against it. Almost all the remaining responses focused on the costs involved, either in an absolute sense or compared with other potential uses for the money. For human space exploration, about 23 percent of the respondents either declined to provide an answer or argued that there are
TABLE 3.11 Reasons for Space Exploration and Human Spaceflight (% Most Important)
| Reason for Space Exploration | % Most Important | Reason for Human Spaceflight | % Most Important |
| Expanding knowledge and scientific understanding | 58 | Satisfying a basic human drive to explore new frontiers | 22 |
| Satisfying a basic human drive to explore new frontiers | 11 | Inspiring young people to pursue careers in science, technology, engineering, and mathematics | 18 |
| Driving technological advances | 11 | Expanding knowledge and scientific understanding | 16 |
| Inspiring young people to pursue careers in science, technology, engineering, and mathematics | 8 | Paving the way for future settlements in space | 14 |
| Maintaining our national security | 5 | Driving technologic advances | 11 |
| Paving the way for future settlements in space | 3 | Creating opportunities for international cooperation | 4 |
| Extending human economic activity beyond Earth | 3 | Enhancing U.S. prestige | 4 |
| Creating opportunities for international cooperation | 1 | Paving the way for commercial space travel | 4 |
| Enhancing U.S. prestige | 0 | Extending human economic activity beyond Earth | 3 |
| Paving the way for commercial space travel | 0 | Maintaining our national security | 3 |
TABLE 3.12 What Would Be Lost If NASA’s Human Spaceflight Program Were Terminated (Open-Ended, All Mentions)
| What Would Be Lost | % Mentioned |
| U.S. prestige | 26 |
| Knowledge and scientific understanding | 20 |
| Basic human drive to explore new frontiers | 17 |
| Technological advances | 16 |
| Public support | 11 |
| Investment we have made so far | 10 |
| Science, technology, engineering, and mathematics careers | 10 |
| Future settlements in space | 6 |
| National security | 4 |
| Ability to accomplish what robots cannot | 3 |
| Human economic activity beyond Earth | 3 |
| International cooperation | 3 |
| Search for signs of life | 0 |
| Commercial space travel | 0 |
| Prevent threats from space | 0 |
| Other | 14 |
| Nothing would be lost | 15 |
no reasons against human space exploration. The majority of the respondents (60 percent) focused on the costs of human space exploration, 39 percent mentioned the risks involved, and 28 percent argued that it would be better to focus on robotic space exploration.
3.2.3 Views on a Course for the Future
Respondents were asked to consider what goals a worthwhile and feasible U.S. human space-exploration program might work toward over the next 20 years. They were given a list of possible projects that NASA could pursue and asked to indicate how strongly they favored or opposed each of them. Although describing all the nuances
associated with the options was not feasible in the survey format, the options were presented with approximate overall costs to provide some context in terms of the scale of the projects.
Overall, the option that received the most “strongly favor” responses was continuing with low-Earth orbit (LEO) flights to the ISS until 2020, followed by extending the ISS to 2028 and conducting orbital missions to Mars to teleoperate robots on the surface (Table 3.13). When the “strongly favor” and “somewhat favor” responses are combined, the same three options emerge as the top three preferences, with no difference between the degree of support for extending the ISS to 2028 and conducting orbital teleoperated missions to the Mars surface.
Tables 3.14 through 3.16 compare the preferences of the main stakeholder groups. In Tables 3.15 and 3.16 scientists in space-related fields include space scientists/engineers, young space scientists, and academics who said that they were involved in space-related work. Scientists in non-space-related fields are respondents in the same three groups who said that they were not involved in space-related work.
Those who said that they were involved in space-related work, and in particular those involved in human spaceflight-related work, were generally more likely to favor most programs strongly, but continuing with LEO flights to the ISS until 2020 was the option that received the most “strongly favor” responses in all three groups (Table 3.14). Overall, extending the ISS to 2028 was the second option with the most “strongly favor” responses, although those involved in space-related work that did not include human spaceflight were equally likely to favor conducting orbital missions to Mars to teleoperate robots on the surface strongly. Conducting orbital missions to Mars to teleoperate robots on the surface was the third-most popular option among those who were not involved in space-related work as well. Those who were involved in human-spaceflight-related work were more likely to favor landing humans on Mars strongly than conducting orbital missions to Mars to teleoperate robots on the surface.
Among scientists in space-related fields and non-space-related fields, the option that received the most “strongly favor” responses was continuing with LEO flights to the ISS until 2020, followed by extending the ISS to 2028 and conducting orbital missions to Mars to teleoperate robots on the surface (Table 3.15). Among the industry respondents, the options that received the most support were continuing with LEO flights to the ISS until 2020 and extending the ISS until 2028, followed by establishing outposts on the Moon, conducting orbital missions to Mars to teleoperate robots on the surface, and landing humans on Mars. The priorities in the defense community generally reflected the ones indicated by scientists/engineers. Space advocates and science popularizers were generally more likely to favor most options strongly, but respondents in this group were also more likely to support continuing with LEO flights to the ISS until 2020. Space advocates and science popularizers were about as likely to support extending the ISS to 2028 as landing humans on Mars; with more than half the respondents in this group strongly favored these options.
When the “strongly favor” and “somewhat favor” responses are combined (Table 3.16), similar patterns emerge, especially with respect to the program options that received the most support overall (continuing with LEO flights to the ISS until 2020, followed by extending the ISS to 2028 and conducting orbital missions to Mars to teleoperate robots on the surface).
Those who were under 40 years old were generally more likely to favor most projects strongly than those who were 40 years old and older (Table 3.17). Continuing with LEO flights to the ISS until 2020 and extending the
TABLE 3.13 Goals for NASA’s Human Spaceflight Program over the Next 20 Years
| Strongly Favor, % | Strongly Favor or Somewhat Favor, % | |
| Continue with LEO flights to the ISS until 2020 | 45 | 79 |
| Extend the ISS to 2028 | 37 | 67 |
| Conduct orbital missions to Mars to teleoperate robots on the surface | 31 | 66 |
| Land humans on Mars | 25 | 48 |
| Establish outposts on the Moon | 22 | 49 |
| Return to the Moon and explore more of it with short visits | 22 | 56 |
| Send humans to a near-Earth asteroid in its native orbit | 19 | 50 |
| Establish a human presence (base) on Mars | 12 | 30 |
TABLE 3.14 Goals for NASA’s Human Spaceflight Program over the Next 20 Years by Involvement in Space-Related Work
| Strongly Favor, % | Strongly Favor or Somewhat Favor, % | ||||||
| Involved in human-spaceflight-related work (n = 225) | Involved in space-related work but not human spaceflight (n = 333) | Not involved in space-related work (n = 532) | Involved in human-spaceflight-related work (n = 225) | Involved in space-related work but not human spaceflight (n = 333) | Not involved in space-related work (n = 532) | ||
| Continue with LEO flights to the ISS until 2020 | 55 | 45 | 42 | 82 | 78 | 80 | |
| Extend the ISS to 2028 | 51 | 33 | 35 | 75 | 65 | 68 | |
| Send humans to a near-Earth asteroid in its native orbit | 20 | 20 | 18 | 55 | 51 | 49 | |
| Return to the Moon and explore more of it with short visits | 28 | 20 | 21 | 64 | 56 | 54 | |
| Establish outposts on the Moon | 40 | 20 | 17 | 66 | 50 | 42 | |
| Conduct orbital missions to Mars to teleoperate robots on the surface | 34 | 33 | 30 | 74 | 65 | 66 | |
| Land humans on Mars | 48 | 21 | 18 | 70 | 47 | 41 | |
| Establish a human presence (base) on Mars | 28 | 12 | 6 | 53 | 29 | 22 | |
TABLE 3.15 Goals for NASA’s Human Spaceflight Program over the Next 20 Years: Options Strongly Favored among Main Stakeholder Groups
| Strongly Favor, % | |||||
| Scientists/engineers in space-related fields (n = 373) | Scientists/engineers in non-space-related fields (n = 464) | Industry (n = 104) | Defense (n = 71) | Space advocates and science popularizers (n = 99) | |
| Continue with LEO flights to the ISS until 2020 | 43 | 40 | 56 | 47 | 65 |
| Extend the ISS to 2028 | 33 | 35 | 51 | 38 | 57 |
| Send humans to a near-Earth asteroid in its native orbit | 21 | 18 | 21 | 11 | 19 |
| Return to the Moon and explore more of it with short visits | 18 | 19 | 25 | 21 | 41 |
| Establish outposts on the Moon | 22 | 16 | 35 | 18 | 44 |
| Conduct orbital missions to Mars to teleoperate robots on the surface | 30 | 30 | 34 | 30 | 41 |
| Land humans on Mars | 25 | 16 | 35 | 27 | 57 |
| Establish a human presence (base) on Mars | 13 | 6 | 20 | 7 | 38 |
TABLE 3.16 Goals for NASA’s Human Spaceflight Program over the Next 20 Years: Options Favored (Strongly Favored and Somewhat Favored) among Main Stakeholder Groups
| Strongly Favor or Somewhat Favor, % | |||||
| Scientists/ engineers in space-related fields (n = 373) |
Scientists/ engineers in non-space-related fields (n = 464) |
Industry (n = 104) | Defense (n = 71) | Space advocates and science popularizers (n = 99) | |
| Continue with LEO flights to the ISS until 2020 | 76 | 78 | 83 | 82 | 86 |
| Extend the ISS to 2028 | 62 | 66 | 80 | 73 | 81 |
| Send humans to a near-Earth asteroid in its native orbit | 52 | 48 | 50 | 42 | 58 |
| Return to the Moon and explore more of it with short visits | 56 | 52 | 64 | 54 | 72 |
| Establish outposts on the Moon | 51 | 40 | 60 | 45 | 73 |
| Conduct orbital missions to Mars to teleoperate robots on the surface | 65 | 64 | 80 | 63 | 76 |
| Land humans on Mars | 50 | 38 | 63 | 52 | 74 |
| Establish a human presence (base) on Mars | 32 | 20 | 43 | 31 | 60 |
TABLE 3.17 Goals for NASA’s Human Spaceflight Program over the Next 20 Years: Those Under 40 Years Old vs Those 40 Years Old and Older
| Strongly Favor, % | ||
| Under 40 years old (n = 127) | 40 years old and older (n = 951) | |
| Continue with LEO flights to the ISS until 2020 | 59 | 44 |
| Extend the ISS to 2028 | 56 | 35 |
| Send humans to a near-Earth asteroid in its native orbit | 34 | 17 |
| Return to the Moon and explore more of it with short visits | 24 | 22 |
| Establish outposts on the Moon | 40 | 20 |
| Conduct orbital missions to Mars to teleoperate robots on the surface | 35 | 31 |
| Land humans on Mars | 42 | 23 |
| Establish a human presence (base) on Mars | 25 | 11 |
ISS to 2028 were the two options with the most “strongly favor” responses among respondents who were under 40 years old, followed by establishing outposts on the Moon and landing humans on Mars.
To probe priorities from an additional perspective, respondents were asked to rate the importance of several possible projects or activities for NASA over the next 20 years. Overall, those who were involved in space-related work, especially in human-spaceflight-related work, rated most items higher than those who were not (Table 3.18).
Those who were involved in human-spaceflight-related work were more likely to say that it was very important to make the investment necessary to sustain a vigorous program of human space exploration than those who were not. Among those who were involved in human-spaceflight-related work, 56 percent felt that making the investment
TABLE 3.18 Important for NASA to Do over the Next 20 Years: Those Who Are Involved in Space-Related Work vs Those Who Are Not
| Very Important, % | |||
| Involved in human-spaceflight-related work (n = 225) | Involved in space-related work but not human spaceflight (n = 333) | Not involved in space-related work (n = 532) | |
| Make the investments necessary to sustain a vigorous program of human space exploration | 56 | 29 | 26 |
| Make the investments necessary to sustain a vigorous program of robotic space exploration | 57 | 76 | 62 |
| Maintain the ISS as a laboratory for scientific research | 46 | 33 | 36 |
| Limit human space exploration to Earth-orbit missions while maintaining robotic missions for exploring in and beyond the solar system | 16 | 37 | 30 |
| Plan for a manned mission to Mars | 37 | 20 | 15 |
| Improve orbital technologies, such as weather and communication satellites | 47 | 71 | 70 |
| Maintain world leadership in human space exploration | 53 | 35 | 31 |
| Expand space exploration collaboration with other countries | 44 | 47 | 41 |
necessary to sustain a vigorous program of human space exploration was very important, and about as many felt that way about the investment necessary to sustain a vigorous program of robotic space exploration. Among those who were involved in space-related work but not human spaceflight, 29 percent said that the investment in human space exploration was very important and 76 percent said that the investment in robotic space exploration was very important. The responses of those who were not involved in space-related work were closer to the responses of those who were involved in space-related work, but not with human spaceflight.
Those who were involved in human-spaceflight-related work were more likely to say that maintaining the ISS as a laboratory for scientific research was very important and that planning a crewed mission to Mars was very important. They also considered maintaining world leadership in human space exploration to be more important than did those who were involved in space-related work but not human spaceflight or those who were not involved in space-related work. However, those involved in space-related work but not human spaceflight and those who were not involved in space-related work were more likely to rate improving orbital technologies, such as weather and communication satellites, very important. Expanding space collaboration with other countries was the item that received comparable levels of support in all three of those groups.
Some other noteworthy findings of the survey include the following:
- International collaboration. A majority (59 percent) said that NASA should conduct human space-exploration missions beyond LEO mainly or exclusively as part of an international collaboration that includes both current partners and new and emerging space powers, very few (8 percent) said that NASA should conduct human space-exploration missions beyond LEO mainly or exclusively as U.S.-only missions, 13 percent said that NASA should do it mainly or exclusively in collaboration with current international partners (such as ISS partners), and 17 percent said that NASA should not conduct human space-exploration missions beyond LEO at all.
- Robotic versus human missions. The majority (64 percent) felt that NASA should focus on a combination of both robotic and human missions, and 34 percent said that NASA should focus mainly or exclusively on robotic space exploration.
- Role of the private sector. The overwhelming majority of respondents thought that NASA should take the lead in space exploration for scientific research but that the private sector should take the lead in space travel by private citizens (Table 3.19). The majority of the respondents said that the private sector should also take the lead in extending human economic activity beyond Earth. About half the respondents said that NASA should take the lead in working toward establishing an off-planet human presence, about one-third felt that neither should do this, and 20 percent said that the private sector should take the lead.
3.2.5 Correlates of Support for Human Spaceflight
The panel created a scale to measure overall support for human spaceflight on the basis of responses to five of the questionnaire items: about support for establishing outposts on the Moon (question 10e), landing humans on Mars (10g), establishing a human presence on Mars (10h), sustaining a vigorous program of human space exploration (11b), and maintaining world leadership in human space exploration (11e). Responses to those five items were highly intercorrelated. Table 3.20 shows the averages on this scale for various subgroups of those who completed the survey. The averages are on a 4-point scale, with 4 representing the highest possible level of support for human spaceflight and 1 representing the lowest level.
Support for human spaceflight goes up with involvement in human space exploration and declines steadily with age. A multivariate model shows that those two variables are significantly related to overall support for human spaceflight. In addition, the stakeholder groups differ in their support for human spaceflight: advocates and popularizers are highest in support of human spaceflight, and non-space scientists/engineers are least supportive.
3.2.6 Summary of Findings of the Stakeholder Survey
One of the primary goals of the survey was to understand stakeholder views of the rationales for space exploration and human spaceflight. There was substantial agreement among the respondents on the rationales for space exploration, but views of the rationales for human spaceflight were more divided.
For space exploration, “expanding knowledge and scientific understanding” emerged as the rationale shared by the overwhelming majority of the respondents. Although there were a few other rationales that more than half the respondents agreed were “very important” reasons for space exploration, when asked what they considered to be the most important rationale they mentioned “expanding knowledge and scientific understanding” by far the most frequently. That was also the case when respondents were asked to describe the reasons for space exploration in their own words, and the rationale was equally dominant among those who were involved in space-related work and those who were not.
None of the rationales traditionally given for human spaceflight garnered agreement from a majority of the respondents. When asked what the most important rationale was from among the rationales traditionally given for human spaceflight, “satisfying a basic human drive to explore new frontiers” was the reason selected by the
TABLE 3.19 Who Should Take the Lead on Each of These Activities over the Next 20 Years
| NASA, % | Private Sector, % | Neither, % | |
| Space exploration for scientific research | 95 | 2 | 1 |
| Extending human economic activity beyond Earth | 16 | 68 | 14 |
| Space travel by private citizens | 1 | 85 | 12 |
| Establishing an off-planet human presence | 48 | 20 | 30 |
TABLE 3.20 Mean Levels of Support of Human Spaceflight, by Selected Subgroups
| Meana (n) | ||
| Group | ||
| Scientists/engineers in space-related fields | 2.55 (370) | |
| Scientists/engineers in non-space-related fields | 2.32 (461) | |
| Industry | 2.91 (98) | |
| Defense | 2.55 (64) | |
| Space advocates and popularizers | 3.22 (95) | |
| Involvement with human space flight | ||
| Not involved in space exploration | 2.36 (530) | |
| Not involved in human space exploration | 2.50 (333) | |
| Somewhat involved in human space exploration | 2.95 (150) | |
| Very involved in human space exploration | 3.22 (75) | |
| Age, years | ||
| 39 or under | 3.10 (127) | |
| 40-49 | 2.89 (109) | |
| 50-59 | 2.63 (292) | |
| 60-69 | 2.56 (273) | |
| 70 or over | 2.05 (273) | |
| Education | ||
| Bachelor’s degree or less | 3.09 (107) | |
| Master’s or professional | 2.79 (192) | |
| Doctorate | 2.41 (788) | |
| Sex | ||
| Men | 2.53 (932) | |
| Women | 2.65 (152) | |
a Higher numbers indicate greater support (1 represents the lowest possible value, 4 the highest).
highest number of respondents, but fewer than one-fourth agreed that it was the most important reason; the rest of the responses were split among a number of other rationales.
When asked to describe the reasons for human spaceflight in the form of an open-ended question, about one-third of the respondents provided reasons that can be summarized as “humans can accomplish more than robots in space.” Somewhat fewer than one-third argued that the reason was to satisfy a basic human drive to explore new frontiers. “Expanding knowledge and scientific understanding” was mentioned by about one-fourth as a reason for human spaceflight.
Those who were involved in space-related work were more likely to provide additional rationales for human spaceflight in their responses to the open-ended question, but the rationales were endorsed by a relatively small percentage of respondents overall (even among those who were involved in space-related work). Rationales that were mentioned by less than 10 percent of the respondents spontaneously included the following: reduced public support for space-exploration programs in general without the visibility of the human-spaceflight program, enhancing U.S. prestige, national security, international cooperation, preventing threats from space, inspiring STEM careers, expanding human economic activity beyond Earth, searching for signs of life, and paving the way for commercial space travel. Some of those were mentioned spontaneously by only a handful of respondents.
To provide an additional perspective on the reasons for human spaceflight, respondents were asked in an open-ended format what they thought would be lost if NASA’s human spaceflight program were terminated. There was no majority agreement among the respondents when the question was asked that way either. The most commonly mentioned loss was national prestige, which was mentioned by only one-fourth of respondents; 15 percent said that nothing would be lost.
When asked about possible goals for the next 2 decades of NASA’s human space-exploration program in the context of costs, the projects that were favored by a majority of the respondents included LEO flights to the ISS
until 2020, extending the ISS to 2028, conducting orbital missions to Mars to teleoperate robots on the surface, and returning to the Moon to explore more of it with short visits.
Overall, large majorities thought that it was very important for NASA to be involved in nonhuman spaceflight, such as robotic space exploration and improving orbital technologies, but responses to another question indicate that the majority favored a program that includes both robotic and human space exploration. A majority said that NASA should conduct human space-exploration missions beyond LEO mainly or exclusively as part of an international collaboration that includes both current partners and new and emerging space powers.
Key predictors of support for human spaceflight are age and whether a person is involved in work related to human spaceflight. In addition, the stakeholder groups differed in their support of human spaceflight: advocates and popularizers were highest in their support of human spaceflight, and non-space scientists/engineers were lowest.


