
This committee is charged with the task of discussing significant accomplishments of the restoration and assessing “the progress toward achieving the natural system restoration goals of the Comprehensive Everglades Restoration Plan [CERP]” (see Chapter 1). In this chapter, the committee updates the National Research Council’s (NRC’s) previous assessments of CERP and related non-CERP restoration projects (NRC, 2007, 2008, 2010, 2012a). This chapter also addresses programmatic and implementation progress as well as analyzes any natural system benefits resulting from the progress to date.
PROGRAMMATIC PROGRESS
To assess programmatic progress the committee reviewed a set of primary issues that strongly influence the progress of the CERP toward its overall goals of ecosystem restoration. These issues, described in the following sections, relate to authorization, funding, and scheduling.
Project Authorization
Once project planning is complete, CERP projects with costs exceeding $25 million1 must be individually authorized by Congress.2 Water Resources Development Acts (WRDAs) have served as the mechanism to congressionally
______________
1 Programmatic authority for smaller projects (less than $25 million each) was subject to a total limit of $206 million (Water Resources Development Act of 2000 [WRDA 2000]).
2 WRDA 2000 included authorizations for 10 initial Everglades restoration projects (pending congressional approval of the project implementation reports [PIRs]), and an adaptive management and monitoring program. WDRA 2000 stipulated that the initial project authorizations are subject to Section 902 of WRDA 1986, thereby requiring reauthorization if project costs increase by more than 20 percent of the original authorized cost (exclusive of inflation). As a result of the Section 902 limits or other major project changes, all 10 conditionally authorized projects now require reauthorization (S. Appelbaum, USACE, personal communication, 2012).
authorize U.S. Army Corps of Engineers (USACE) projects, and the CERP planning process was developed with the assumption that WRDAs would be passed every 2 years. This, however, has not occurred. In the 13 years after the CERP was launched in WRDA 2000, Congress passed only WRDA 2007, which authorized Indian River Lagoon-South, Picayune Strand Restoration, and the Site 1 Impoundment projects. Additionally, the Melaleuca Eradication Project was authorized under programmatic authority. These four projects are considered Generation 1 projects (see Table 4-1; Figure 4-1), and for the past 7 years, they have been the only projects that could receive federal appropriations to support construction.
In May 2014, Congress passed the Water Resources Reform and Development Act (WRRDA), which authorized four additional projects (C-43 Reservoir, C-111 Spreader Canal, Biscayne Bay Coastal Wetlands, Broward County Water Preserve Areas), termed Generation 2 projects. With the passage of WRRDA 2014, the federal government will be able to maintain progress on several state-expedited projects now under way (e.g., C-111 Spreader Canal, Biscayne Bay Coastal Wetlands) and initiate construction on two other new projects.
The expedited planning process for the Central Everglades Planning Project was originally targeted for completion in December 2013 in anticipation of it being included in a 2013 authorization. Delays in the planning process, however, pushed it beyond closure on WRRDA 2014 (see Chapter 3). Slippage in the completion schedule for the Central Everglades Project beyond closure for WRRDA 2014 delays authorization of that project to the next WRDA (or other authorization mechanism). As discussed in Chapter 3, the implications of such delays on restoration progress should be relatively minor if the next WRDA is passed in the next 3-5 years.
Funding
Funding for restoration of the South Florida ecosystem comes from a variety of federal and state sources.3 A combination of several factors has contributed to deceleration in the rate of spending for restoration of the Everglades over
______________
3 Federal agencies include the USACE, four Department of the Interior agencies (National Park Service, U.S. Fish and Wildlife Service, Bureau of Indian Affairs, and U.S. Geological Survey), two Department of Agriculture agencies (Natural Resources Conservation Service and Agricultural Research Service), National Oceanic Atmospheric Administration, and U.S. Environmental Protection Agency. The South Florida Water Management District (SWFMD) is the nonfederal partner for CERP and several non-CERP cost-shared projects, and the State of Florida directs monies from state appropriations and several trust funds into SFWMD accounts. Two trust funds have been particularly important to CERP projects—Florida Forever and Save Our Everglades. Other Florida agencies that contribute include the Departments of Agriculture, Environmental Protection, and Transportation, and the Fish and Wildlife Conservation Commission.
TABLE 4-1 CERP or CERP-Related Project Implementation Status as of May 2014
| Project or Component Name | Yellow Book (1999) Estimated Completion Date | IDS (Aug. 2011) Estimated Completion Date | PIR (or PPDR) Status | Authorization Status | Planning/Design | Construction Status; Installation and Testing Status for Pilots |
| PILOT PROJECTS | ||||||
| Hillsboro ASR Pilot (Fig. 4-1, No. 1) | 2002 | Not specified | PPDR Final Oct. 2004 | Authorized in WRDA 1999 | Completed | Completed, 2013 |
| Kissimmee ASR Pilot (Fig. 4-1, No. 2) | 2001 | Not specified | PPDR Final Oct. 2004 | Authorized in WRDA 1999 | Completed | Completed, 2013 |
| Regional ASR Study | NA | Not specified | NA | NA | Completed | Ongoing |
| LPA Seepage Management Pilot (Fig. 4-1, No. 3) | NA | Not specified | NA | NA | Completed | Completed |
| C-111 Spreader Canal Design Test (Fig. 4-1, No. 9) | NA | 2011 | NA | Programmatic authority WRDA 2000 | Completed | Testing completed |
| Decomp Physical Model (Fig. 4-1, No. 4) | NA | 2014 | NA | Programmatic authority WRDA 2000 | Completed | Ongoing |
| Project or Component Name | Yellow Book (1999) Estimated Completion Date | IDS (Aug. 2011) Estimated Completion Date | PIR (or PPDR) Status | Authorization Status | Planning/Design | Construction Status; Installation and Testing Status for Pilots |
| RESTORATION PROJECTS—Generation 1 | ||||||
| Picayune Strand Restoration (Fig. 4-1, No. 5) | 2005 | Merritt: 2012 Faka-Union: 2014 Miller: 2016 | Submitted to Congress in 2005 | Construction authorized in WRDA 2007 Reauthorization required because of cost increases | Completed | Prairie Canal completed in 2007 Merritt, Faka Union ongoing pending Sec. 902 limits |
|
Site 1 Impoundment* (Fig. 4-1, No. 6)
• Phase 1 • Phase 2 |
2007 | 2013 TBD |
Submitted to Congress in 2006 | Construction Authorized in WRDA 2007 Phase 2 requires reauthorization |
Completed | Ongoing Not begun |
|
Indian River Lagoon-South (Fig. 4-1, No. 7)
• C-44 Reservoir/STA* |
2007 | Not specified 2018 | Submitted to Congress in 2004 | Construction authorized in WRDA 2007 | Completed | Ongoing |
| Melaleuca Eradication and Other Exotic Plants (Fig. 4-1, No. 7) | 2011 | 2012 | Final June 2010 | Programmatic authority WRDA 2000 | Completed | Construction completed 2013 Operations ongoin. |
| RESTORATION PROJECTS—Generation 2 | ||||||
|
C-111 Spreader Canal*
• Western Project (PIR #1) (Fig. 4-1, No. 9) |
2008 | 2012 | Approved by USACE Chief of Eng. in Jan. 2012 | Construction authorized in WRRDA 2014 | Completed | Ongoing; expedited by FL |
| Biscayne Bay Coastal Wetlands (Phase 1) (Fig. 4-1, No. 10) | 2018 | 2016 | Approved by USACE Chief of Eng. in May 2012 | Construction authorized in WRRDA 2014 | Completed | Ongoing; expedited by FL |
| C-43 Basin Storage: West Basin Storage Reservoir (Fig. 4-1, No. 11) | 2012 | TBD | Approved by USACE Chief of Eng. in Jan. 2011 | Construction authorized in WRRDA 2014 | Ongoing | Not begun |
| Broward County WPAs (Fig. 4-1, No. 12) | Approved by USACE Chief of Eng. in May 2012 | Construction authorized in WRRDA 2014 | ||||
|
• C-9 Impoundment* |
2007 | Not specified | Ongoing | Not begun | ||
|
• Western C-11 Diversion Impoundment* |
2008 | 2022 | Ongoing | Not begun | ||
|
• WCA-3A & -3B Levee Seepage Management* |
2008 | 2022 | Ongoing | Not begun | ||
| RESTORATION PROJECTS—Generation 3 | ||||||
| Central Everglades Planning Project (Fig. 4-1, Nos. 13 and 14) | NA | NA | Draft PIR Aug. 2013 | Not authorized | Ongoing | Not begun |
| Loxahatchee River Watershed (Fig. 4-1, No. 15) | Not specified | Not specified | In development | Not authorized | Ongoing | Ongoing; expedited by FL |
* Projects that were conditionally authorized in WRDA 2000, subject to approval of the PIR.
NOTES: Projects in Table 4-1 reflect those CERP projects or pilot projects deemed by the committee to be relevant to CERP progress. This table does not include non-CERP foundation projects. Gray shading of project names reflects projects being expedited and/or carried out entirely with state funding as of 2014. Gray shading of construction cells indicates past or present aspects of projects that were expedited with state funding. NA = not applicable; TBD = to be determined.
SOURCE: www.evergladesplan.org.
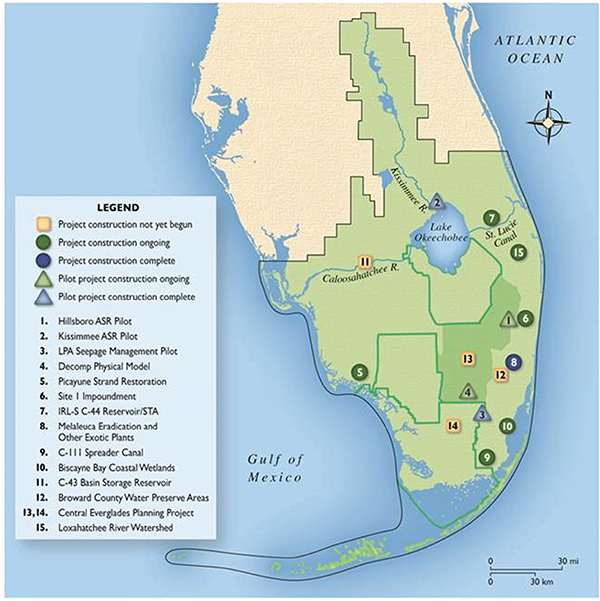
FIGURE 4-1 Locations of CERP and CERP-related projects and pilots listed in Table 4-1. Projects under active construction are noted with a green circle.
SOURCE: © International Mapping Associates
the past 3 to 4 years. Reductions in budgets for restoration by federal and state agencies, court mandates requiring the SFWMD to make additional water quality improvements, delays in congressional authorizations of additional projects, and rules governing cost sharing have all had an impact. Those trends and potential bottlenecks are explored in more detail in subsequent sections.
CERP Spending
Figures reported by the South Florida Ecosystem Restoration Task Force (Task Force) indicate that federal and state governments have spent $4.25 billion on CERP projects since passage of WRDA 2000 through FY 2013 (SFERTF, 2014). Spending by the State of Florida, including the SFWMD, has substantially outpaced federal spending—about $3.23 spent toward the CERP by the state for every dollar spent by the federal government. Rates of CERP spending have been highly variable, as shown in Figure 4-2. Florida’s spending grew at a fast pace through FY 2007, remained high in FY 2008, and rapidly declined afterward. Federal spending on the CERP accelerated after passage of WRDA 2007, peaking in FY 2010, and declining since then.
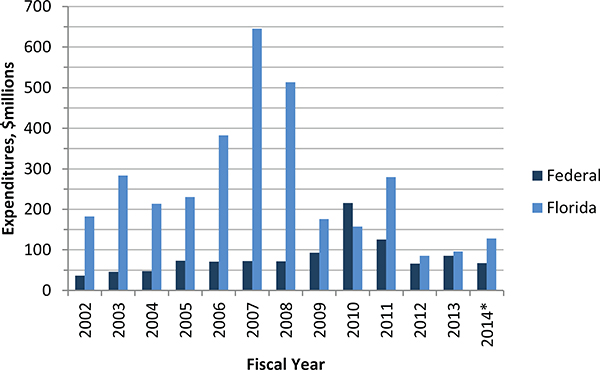
FIGURE 4-2 Spending on CERP projects by federal and state governments.
NOTE:* Requested.
SOURCE: SFERTF (2014).
All South Florida Ecosystem Restoration Spending
The economic downturn and related fiscal constraints at both national and state levels have slowed the rate of spending on most ecosystem restoration projects in South Florida, not just the CERP. Some items that have been included in the Task Force’s cross-cut budget may be indirectly related to restoration, but those entries do not alter the general decline in expenditures since 2010, as shown in Figure 4-3. Reported federal expenditures in FY 2013 were only 47 percent of FY 2010 values, and Florida’s spending on restoration in FY 2013 was only 41 percent of its FY 2010 numbers. If planned expenditures for FY 2014 are realized, they would represent a slight upturn from prior years at both the federal and state levels. Among the larger items included in federal non-CERP expenditures over the 5-year period FY 2010 to FY 2014 are $470 million by the Natural Resources Conservation Service for agricultural programs; $149 million by the National Park Service for Everglades National Park management; and over $100 million for Kissimmee River Restoration.
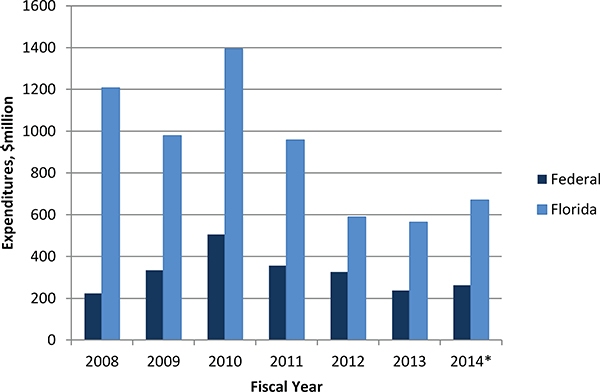
FIGURE 4-3 Federal and state spending related to South Florida ecosystem restoration activities, including CERP and non-CERP projects and related expenditures.
NOTE:* Requested.
SOURCE: SFERTF (2014).
Of particular concern, South Florida ecosystem restoration is losing ground in USACE Civil Works construction budgets. As shown in Table 4-2, funding requested by the USACE for South Florida ecosystem restoration is about 48 percent of what it was 3 years earlier. The Corps’ construction budget has declined, and the South Florida ecosystem restoration share of that budget is declining.
SFWMD Financial Resources
The SFWMD’s capacity to undertake new CERP projects and possibly complete authorized projects is hampered by its obligations to fund the Restoration Strategies, an $880 million project mandated under a consent order to remedy phosphorus exceedances in the Everglades Protection Area (see Chapter 2; also discussed later in this chapter). Expenditures of that magnitude are in competition with financial demands for the SFWMD’s ongoing operations, for other non-CERP construction projects, and for completion of previously authorized CERP projects.
If revenues are not enhanced, the SFWMD will be challenged to keep up cost sharing as the nonfederal partner for CERP and some non-CERP projects and to continue funding other restoration projects and programs. Annual SFWMD revenues dropped sharply over the period FY 2008 through FY 2013 as shown in Figure 4-4 from just over $900 million to $346 million. The largest portion of the loss in revenue was due to a decline in ad valorem taxes, down from $549 million in FY 2008 to $268 million in FY 2013 (Figure 4-4). Intergovernmental revenue (state appropriations and trust fund transfers) also declined, from $286 million in FY 2008 to $37 million in FY 2013.
Furthermore, in recent years, revenues have been supplemented with significant funding from reserve fund balances: $228 million in FY 2013 and $299 million in FY 2014 (SFWMD, 2013c, 2014). The SFWMD had accrued large fund balances (approaching $900 million in FY 2009). Those funds were being held in reserve to address future spending needs, and since 2009, the SFWMD has
TABLE 4-2 Budget Requests for the U.S. Corps of Engineers Civil Works Program
| Requested Budgets | FY 2011 | FY 2012 | FY 2013 | FY 2014 |
| All construction, $ million | 1,690 | 1,480 | 1,471 | 1,350 |
| South Florida Ecosystem Restoration, $ million | 180 | 163 | 153 | 88 |
| Percent of total | 10.7 | 11.0 | 10.3 | 6.5 |
Note: These totals are different from appropriated budgets.
SOURCE: Data from USACE (2010, 2011b, 2012a, 2013c).
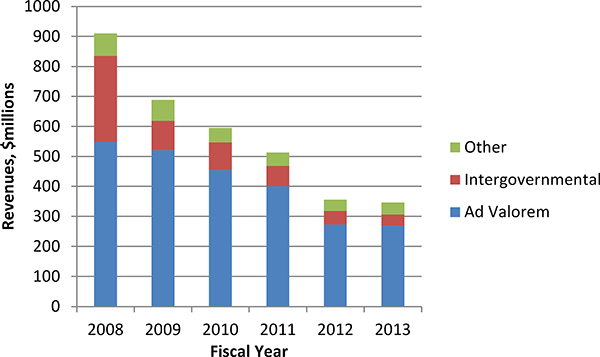
FIGURE 4-4 SFWMD revenues for FY 2008 through FY 2013. In addition to revenues, the SFWMD drew upon fund balances, which are not reflected here.
SOURCES: SFWMD (2008, 2009b, 2010, 2011b, 2012a, 2013e).
been drawing on this balance to cover capital outlay and other expenses. By the end of FY 2013, the fund balance was down to $448 million, and, as shown in Figure 4-5, the FY 2014 budget projects that by FY 2018, the fund balance will be only $37 million. Thus, unless other sources of revenue increase in the next few years, there will be very limited funds available for new projects.
As SFWMD revenues have declined, so have expenditures, as shown in Figure 4-6. Capital outlay was at $379 million in 2008, but by 2012 had been reduced to only $67 million. In FY 2013, capital outlay decreased to $48 million, with $21 million going to the CERP. The FY 2014 to FY 2018 Capital Improvements Plan is based on a 5-year projection of $1,146 million in revenues to fund items included in the plan; $770 million or 67 percent would be spent for Everglades Restoration. Of this, $171 million is programmed for Generation 1 projects (Picayune Strand and Indian River Lagoon-South’s C-44 Reservoir and stormwater treatment area [STA]) and $348 million for the Restoration Strategies project and other water quality-related non-CERP projects. An additional $30 million is budgeted for the Loxahatchee Watershed project (Generation 3), and $176 million is for debt service (Table 4-3; Heater and Maytok, 2014).
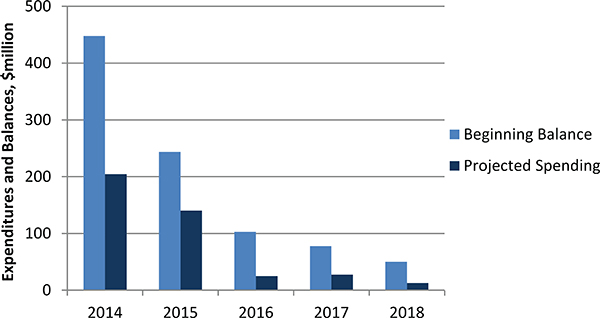
FIGURE 4-5 Drawdown of SFWMD reserve fund balances.
SOURCE: SFWMD (2013b).
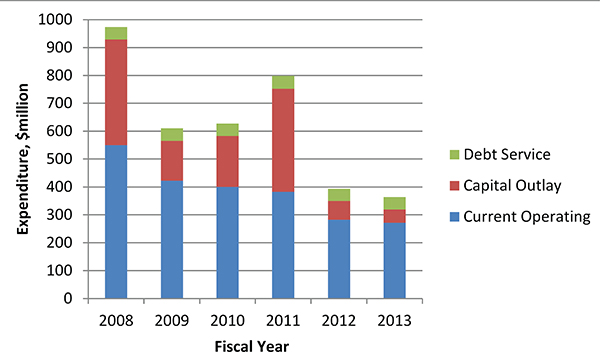
FIGURE 4-6 Overall SFWMD expenditures, including but not limited to South Florida ecosystem restoration, FY 2008 through FY 2012.
SOURCES: SFWMD (2008, 2009b, 2010, 2011b, 2012a, 2013e).
TABLE 4-3 FY 2014 to FY 2017 SFWMD Capital Improvements Plan Expenditures for Everglades Restoration
|
|
|
| EXPENDITURES | Total |
|
|
|
| East Flowway | $ 2,000,000$ |
| C-44 Reservoir and STA | 156,439,234 |
| Picayune Strand | 14,601,218 |
| C-111 South Contract | 9,000,000 |
| LTP EAA STA Compartment B Design Construction & Build Outs | 1,345,536 |
| Loxahatchee Watershed | 29,812,479 |
| MECCA FEB | 19,836,468 |
| A-1 FEB | 67,824,964 |
| STA-1W Expansion #1 | 161,793,068 |
| STA-1W Expansion #2 | 21,554,370 |
| L-8 Divide | 5,042,000 |
| G-716 | 5,309,000 |
| S-5AS | 3,032,000 |
| Source Control | 18,066,834 |
| Science Plan | 44,342,154 |
| Debt Service - 2006 COPs | 175,802,909 |
| Future Restoration Projects (SOETF) | 34,135,727 |
|
|
|
| TOTAL 769,937,961 | |
|
|
|
SOURCE: Heater and Maytok (2014).
For FY 2014, the SFWMD budgeted approximately $45 million for authorized CERP projects, including $29 million for the C-44 Reservoir and $16 million for Picayune Strand (SFWMD, 2014b).
Cost-Sharing Implications
Effects of 50-50 state-federal cost-sharing rules as outlined in WRDA 2000 and detailed in the 2009 Master Agreement have become a matter of significant concern. Management of expenditures to satisfy cost-sharing rules has always been a challenge, but it has become more challenging over the past 2 years with reduced budgets, mandated expenditures for other projects, and limited project authorizations. Even though the SFWMD has far outspent federal agencies on CERP projects from land acquisition and expedited construction efforts (Figure 4-2), cost-sharing rules dictate that the SFWMD can only apply its storehouse of potential credits toward the 50-50 cost-sharing requirement on those projects that have been authorized by Congress, have signed project partnership agreements, and have received federal appropriations. Non-planning-related SFWMD expenditures on yet-to-be authorized CERP projects cannot be offi-
cially credited toward the 50-50 cost-sharing requirement until those projects are authorized and funds have been appropriated. Cost-sharing agreements are restrictive with respect to how credits can be used and how the federal-nonfederal balance must be maintained. The 50 percent proportionate share owed by the local sponsor (i.e., the SFWMD) must be brought into balance annually across the CERP program. Several options are provided for eliminating an imbalance, including delaying construction schedules or requiring cash payments from the local sponsor.4
As discussed previously, until late May 2014, only four projects had been authorized. As of September 30, 2013, $1.88 billion had been spent on those four projects: $891 million by the federal government and $989 million by the SFWMD, leaving the state with only $98 million in excess creditable expenditures above the minimum required 50-50 balance.
In the past few years, the CERP strategy to address this pending cost-sharing issue has been to reduce federal spending where feasible, particularly for non-construction-related activities. As of September 2013, the federal government could spend no more than $49 million more than the state on the CERP through September 2014 without necessitating additional expenditures by the state. Recent federal Everglades restoration funding through the federal Consolidated Appropriations Act of January 2014 was reduced to $46 million, down from prior discussions of $80 million, because the USACE indicated it could not spend the money (Scott, 2014) due to a combination of policy, authorization, and cost-sharing issues (Tipple, USACE, personal communication, 2014).
WRRDA 2014, therefore, is an important achievement for Everglades restoration progress because it temporarily alleviates cost-sharing constraints that have restricted federal spending over the past few years. The four Generation 2 project authorizations represent a critical step to enable the SFWMD to realize an estimated $382 million in accumulated credits from its prior spending on land acquisition and construction (G. Rogers, SFWMD personal communication, 2014), allowing federal appropriations to continue in the near future.
Project Scheduling and Prioritization
The CERP project construction schedule for the next decade is outlined in the Integrated Delivery Schedule (IDS; Figure 4-7). The IDS was developed in consultation with the Task Force and reflects the priorities of the CERP partners as well as sequencing constraints and other project implementation issues. Between 2008 and 2011, the IDS was revised several times per year (typically
______________
4 See Master Agreement at http://www.evergladesplan.org/pm/pm_docs/master_agreement/081309_master_agreement_cerp.pdf.
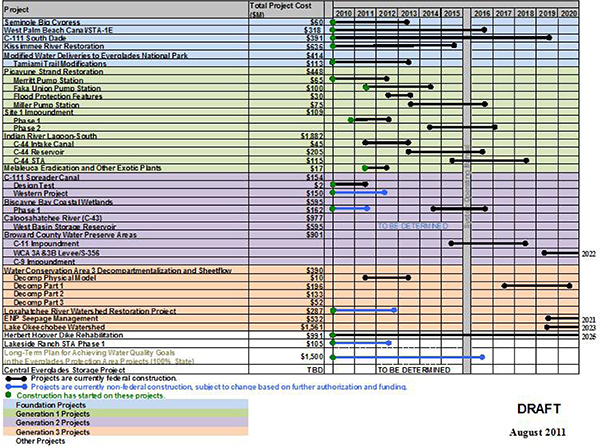
FIGURE 4-7 Integrated Delivery Schedule, August 2011 draft.
NOTE: Project costs cited represent October 2008 price levels and have been adjusted for inflation based on construction start and finish dates for each contract.
SOURCE: K. Tippett, USACE, personal communication, 2011.
in draft) to reflect changing budgets and other developments that affect project schedules, but with intense staff efforts devoted toward the development of Central Everglades Planning Project, the IDS has not been revised since August 2011 draft (Figure 4-7). The IDS now is badly out of date.
Several factors will affect the next update of the IDS, including state and federal CERP and non-CERP appropriations and the recent congressional authorizations for the Generation 2 projects (Table 4-1). Much uncertainty remains over how new authorizations and lack of authorization for the Central Everglades Planning Project will affect the overall implementation schedule. For example,
should early authorized projects (Generation 1) be funded before later authorized projects (Generation 2)? What is the priority of non-CERP projects, such as the Modified Water Deliveries, Kissimmee River Restoration, C-111-South Dade, or Tamiami Trail Next Steps projects, relative to the CERP Generation 1 and 2 projects? How can the Central Everglades Planning Project be expedited in the schedule? Some planners have expressed a strong desire to finish what was started in Generation 1 projects to show progress to the public and Congress. However, expediting key non-CERP projects could provide large benefits and complete important project dependencies for the Central Everglades Planning Project, which was specifically intended to halt ecosystem declines and expedite improvements in the condition of the remnant Everglades. Now that the four Generation 2 projects are authorized in WRRDA 2014, they will be competing for extremely limited funding under current fiscal pressures. With recent federal CERP expenditures of approximately $80 million/year (see Figure 4-2) and projected state spending of approximately $40 million/year on authorized CERP projects, the pace of progress on these projects will be slow if available funding is spread equally across all projects (see Table 4-4).
The current budget situation necessitates clear priorities for spending. As the state works to complete the Restoration Strategies project to address current water quality issues, federal funds and available state funds should be targeted toward CERP and non-CERP projects that will quickly avert current ecosystem declines and/or promise the largest potential restoration benefits, considering future climate change and sea-level-rise impacts. Until this point, CERP prioritization efforts have not explicitly considered the ecosystem condition and future benefits. Previously, with more-plentiful construction funding and few authorized projects, such difficult decisions were not necessary. But today’s grim budgetary landscape requires a new CERP prioritization framework to avert ongoing ecosystem degradation and make the best use of currently available funding.
RESTORATION PROGRESS
In the following section the committee focuses on benefits emerging from the implementation of CERP restoration projects as well as from non-CERP foundation projects. The committee’s previous report (NRC, 2012a) contains more extensive descriptions of the projects, and progress up to March 2012, while only progress over the last 2 years is described here. The South Florida Environmental Report (SFWMD, 2013a) and the 2012 Integrated Financial Plan (SFERTF, 2012) also provide detailed information about implementation and restoration progress. The 2014 System Status Report (RECOVER, 2014a; see Chapter 7) provides additional information on changing ecosystem conditions and discusses linkages to early project construction.
TABLE 4-4 Status of Project Expenditures and Estimated Funding Needs (in Millions) for Generations 1, 2, and 3 and Key Non-CERP Projects as of December 2013
| Project Name | Total Estimated Costs | State Funding to Date | Federal Funding to Date | Estimated Funding Remaining for Completion |
| NON-CERP FOUNDATION PROJECTS | ||||
| Kissimmee River Restoration Project | 780 | 345 | 315 | 120 |
| C-111 South Dade Project | 290 | 115 | 120 | 55 |
| Modified Water Deliveries to Everglades National Park Project a | 418 | 0.2 | 399 | 19 |
| Restoration Strategies a | 880 | 60 | 0 | 820 |
| Non-CERP totals | 2,368 | 520 | 834 | 1,014 |
| 1st GENERATION CERP PROJECTS | ||||
| Picayune Strand Restoration | 618 | 162 | 317 | 139 |
| Indian River Lagoon-South (Phase 1) | 1,450 | 365 | 55 | 1,030 |
| Site 1 Impoundment (Phase 1) | 85 | 8 | 68 | 9 |
| Melaleuca Eradication Project and Other Exotic Plants | 25b | 0.212 | 4.3 | 20.5b |
| 2nd GENERATION CERP PROJECTS | ||||
| C-43 West Basin Storage Reservoir | 570 | 90 | 35 | 445 |
| Broward County WPAs | 870 | 260 | 60 | 550 |
| C-111 West Spreader Canal | 85 | 64 | 12 | 9 |
| Biscayne Bay Coastal Wetlands (Phase 1) | 125 | 42 | 12 | 71 |
| 3rd GENERATION CERP PROJECTS | ||||
| Central Everglades Planning Project | 1,750 | 4 | 31 | 1,715 |
| Loxahatchee River Watershed Restoration | TBD | 163 | 5 | TBD |
| CERP Totals | 5,578+ | 1,158 | 599 | 3,989+ |
NOTES:
a Not a 50-50 cost-shared project.
b Includes operations and maintenance funding for mass rearing, release, and field monitoring of biocontrol agents.
SOURCE: T. Morgan, SFWMD, and H. Gonzales, USACE, personal communication, 2013; M. Collis, USACE, personal communication, 2014; R. Johnson, DOI, personal communication, 2014; L. Gerry, SFWMD, personal communication, 2014.
Reportable restoration progress as a result of CERP and non-CERP projects occurs in three sequential steps: completion of project construction, physical system response (e.g., as a return of more natural hydrologic conditions or sheet flow), and changes in the biological system, including changes to individual species or ecosystem components. The physical and ecological responses are often
assessed by monitoring-project-specific and systemwide performance measures (see RECOVER, 2007) and comparing the results to target values.
Construction for smaller projects takes place in a single phase, whereas more-complex projects have multiple phases, each of which can be assessed in terms of progress. Once construction is complete, most projects have their first effects by introducing new quantities of water, direction of flow, hydroperiods that are longer or shorter, or adjusted rates of change. The return of freshwater to some landscapes and saltwater to others may be an objective, and the return of sheet flow instead of highly concentrated confined flows is often essential to encouraging recovery of Everglades landscapes. Observations of restored hydrologic conditions are therefore the initial indicator of success for restoration projects.
The return of hydrologic conditions more similar to pre-drainage conditions sets the stage for the critical next step in observable restoration whereby plant and animal communities develop that are more similar to pre-drainage communities and less like those disrupted by water control infrastructure. After many months to several years, these changes can become a matter of quantitative record if there is routine monitoring using formal performance parameters. Continuous monitoring in the post-project period is essential in judging the success of the project, and the period of monitoring must be long enough to discern whether changes in performance measures are linked to the project rather than to other influences or to normal variability.
Most projects require several years to make the transition from the beginning of construction to the quantitative observation of desired ecological changes. However, this time frame, often of a few years to a decade, is fast relative to the several decades of disruption that have created the altered ecosystem that is the subject of Everglades restoration.
In the following sections, restoration progress is highlighted in four Generation 1, projects, two Generation 2 projects, and one Generation 3 project, for which construction has begun. Progress in three pilot projects and three non-CERP foundation projects is also discussed. The analysis that follows covers only those projects with substantial new developments or information on natural system restoration progress since the committee’s last report (NRC, 2012a). A summary of all implementation progress as of May 2014, including developments in planning and authorization, is provided in Table 4-1. The location of the various projects is shown in Figure 4-1.
Generation 1 CERP Projects
Generation 1 projects are those authorized by Congress in WRDA 2007 (Picayune Strand Restoration, Site 1 Impoundment, and Indian River Lagoon-South) or by program authority (Melaleuca Eradication). Until June 2014, these
were the only projects eligible for federal funding, while other projects awaited authorization.
Picayune Strand
The Picayune Strand, the first CERP project under construction, focuses on an area in southwest Florida substantially disrupted by a real estate development project that introduced 260 miles of roadway and 48 miles of major canals and drained 55,000 acres of wetlands before being abandoned (Figure 4-1, No. 5). The roads and drainage disrupted sheet flow into Ten Thousand Islands National Wildlife Refuge and altered regional groundwater flows in surrounding natural areas. The reduction of freshwater wetlands adversely affected habitat. These disruptions were especially important because Picayune Strand is surrounded by and contiguous with several other protected areas. Picayune Strand is particularly important as a habitat for white-tailed deer and feral hogs that serve as prey for the endangered Florida panther (USACE, 2011d; but see also Chapter 6 for a discussion of feral hogs as a troublesome invasive species). As of May 2014, the total anticipated cost of the project was $618 million (M. Collis, USACE, personal communication, 2014).
There has been considerable progress in constructing the Picayune Strand Restoration Project, with approximately $480 million expended to date on the project by the state and federal governments. The project components are summarized in Table 4-5 and the progress made to date in canal plugging, road removal, construction of pump stations, and other project elements (Figure 4-8). In late summer 2014, the USACE anticipates completing the Merritt Canal phase, which included construction of a pump station with associated spreader canal and levees, the plugging of 9 miles of canals, and removal of 95 miles of roads. Construction is currently under way on the Faka Union and Miller Canal project portions (see Table 4-5) (USACE, 2014c).
Despite this important progress, the Picayune Strand Restoration faces the prospect of halting construction because the costs of the project are expected to exceed the Section 902 limits.5 Thus, the USACE is required to submit a limited reevaluation report to Congress for authorization (T. Morgan, SFWMD, personal communication, 2013). The timeliness of congressional reauthorization will determine when the project can be completed. There are no scientific or engineering impediments to project completion.
______________
5 WRDA 2007 authorized the project with a budget of $375.3 million, and Section 902 of WRDA 1986 requires that projects seek reauthorization if costs increase more than 20 percent above the original authorized costs (exclusive of inflation).
TABLE 4-5 Phases and Progress of the Picayune Strand Project
| Lead Agency | Road Removal (mi) | Canals to Be Plugged (mi) | Other | Project Phase Status | |
| Prairie Canal | State expedited project | 65 | 7 | Invasive vegetation removed, 17 culverts constructed, >13,000 acres of habitat enhanced | Completed in 2007 |
| Merritt Canal | Federal | 95 | 9 | Remove invasive vegetation; construct Merritt pump station, ~14,000 acres of enhanced habitat | Construction began in 2010; anticipated completion in summer 2014 |
| Faka Union Canal | Federal | 100 | 0 | Construct Faka Union pump station | Construction began in 2011; anticipated completion in 2015 |
| Miller Canal | Federal | 47 | 13 | Construct Miller Canal pump station and spreader canal | Construction began in late 2013; to be completed in 2017 |
| Southwestern protection and manatee mitigation features | State | 0 | 0 | Construct 9-mile levee for flood protection of adjacent lands and excavate manatee refugium to mitigate loss | Construction to begin in 2016, pending authorization of increased project cost |
| Canal plugging and road removal | State | 86 | 16.5 | Remove roads north of tie-back levee, plug Faka Union and east-west canals | Construction to begin in 2017; canal plugging must follow completion of manatee mitigation and southwestern protection features |
SOURCE: L. Gerry, SFWMD, personal communication, 2013, 2014; USACE (2014c); M. Collis, USACE, personal communication, 2014.
Because one phase of the Picayune Strand Restoration Project (Prairie Canal) was completed in 2007, there has been sufficient time to collect and assess environmental data to determine what natural system benefits associated with the completed work have been observed. In a general observation, USACE (2014c) reports a resurgence of foraging wading birds (Figure 4-9) and native flora that have been absent for many decades. In areas where canals have been plugged, roads removed, and invasive plant species removed, freshwater wetlands have returned (Figures 4-9 and 4-10). Researchers have also reported detailed—but preliminary—results from multiyear monitoring efforts (Box 4-1). The most recent data are for late 2011, with the assessments completed in late 2013 focused
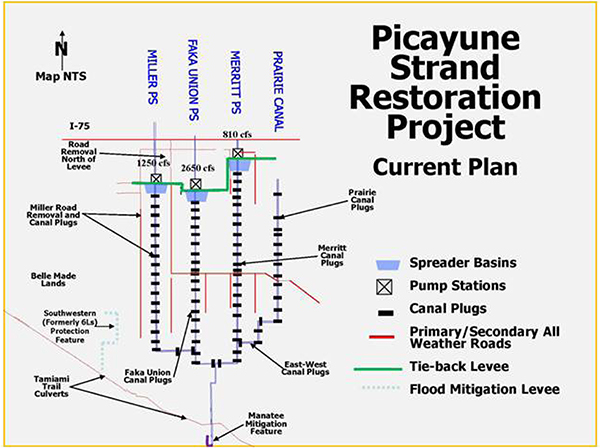
FIGURE 4-8 Picayune Strand Restoration features.
SOURCE: L. Gerry, SFWMD, personal communication, 2014.
on the Prairie Canal area, which had 4 years of post-project monitoring data (USACE, 2014c; RECOVER, 2014b).
These monitoring data show that the restoration of the Prairie Canal area is having clear positive effects on the area by adjusting water levels and hydroperiods toward pre-drainage conditions, although neighboring canals not yet filled by the project continue to affect the area hydrology. The data also show, however, that some biological components of the restored system are not yet experiencing major changes. There are two likely reasons. First, more time may be needed for the complex fauna and flora communities to adjust to new steady-state conditions. Everglades ecosystems may have a reaction time during which changes in controlling factors must work their way through the complexities of
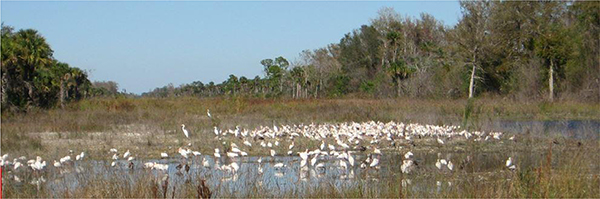
FIGURE 4-9 Freshwater wetland in the Picayune Strand restoration area showing wading birds.
SOURCE: USACE (2014c).
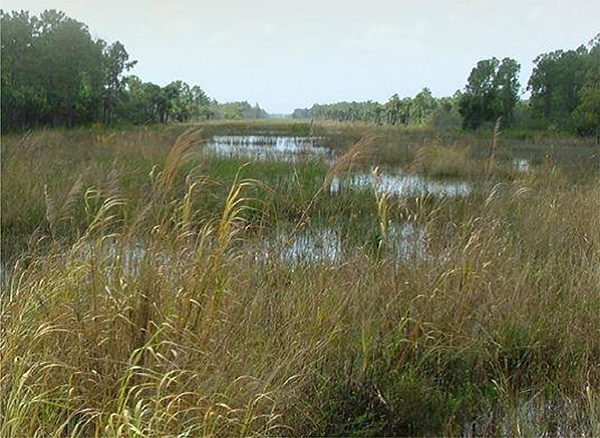
FIGURE 4-10 Freshwater wetland in an area that was once a canal in the Picayune Strand restoration area.
SOURCE: USACE (2014c).
BOX 4-1
Analysis of Monitoring Results from 2007 to 2011 at Picayune Strand
The following outlines the natural system responses to the Prairie Canal features of the CERP Picayune Strand project:
Water levels: Water-level data from observation wells measured from 1987 to 2012 demonstrate the effects of plugging Prairie Canal. Although water-level fluctuations in the area have a complex history related to the management of the Picayune Strand area, prior to the Prairie Canal component of the restoration, water levels were 5-6 feet lower than the reference area in Fakahatchee Strand Preserve State Park. In the period after the completion of the Prairie Canal component of the restoration project, water levels have become similar to a relatively undisturbed reference area during the wet period of the year, but are still about 3.5 feet lower than the reference during dry periods. This shortcoming is probably related to the fact that the canal immediately to the west of the Prairie Canal is not yet fully plugged, so it affects its neighbor’s water levels.
Hydroperiods: The number of days per year that water is at or above ground level (called the hydroperiod), has lengthened in the restored area despite droughts in 2007 and 2012.
Plant communities: Comparisons between 25 vegetation transects in the Prairie Canal restoration area with 11 transects in a relatively undisturbed reference area show that the restoration has so far resulted in little change in dominant tree species. In the restored area, cypress and pop ash growth rates are slower, and pine growth rates are faster than in reference areas. There have been no changes in densities of cabbage palm, considered a nuisance species in the Picayune area. Cypress plots in the restoration area also are developing plant assemblages that increasingly include wetland species, showing that the hydrologic restoration is supporting a more wetland-like community.
Aquatic macroinvertebrates: The restored areas had enough water to support aquatic macroinvertebrates, and 45 percent of the aquatic species in the restored areas were also found in the reference areas.
Fishes: Fish populations were generally similar between restored and reference sites, except that two indicator species, Everglades pygmy sunfish (Elassoma evergladei) and warmouth (Lepomis gulosus), were found only at reference sites.
Tree frogs: Indigenous species such as green and squirrel tree frogs were dominant at reference sites, whereas the exotic Cuban tree frogs were dominant in restoration areas.
Water quality: Decades of water quality data are available, and they reveal no areas of concern. Post-restoration data reflect no change and no water quality decline.
SOURCE: RECOVER (2014b).
the system which therefore does not respond immediately. Second, the restoration of the Prairie Canal area is still affected by its neighboring Merritt Canal area that was not yet restored during the 2007-2011 analysis period.
Site 1 Impoundment
The Site 1 impoundment project (also known as the Fran Reich Preserve; No. 6 on Figure 4-1) is in Palm Beach County at the junction of the southern tip of the Loxahatchee National Wildlife Refuge (LNWR, also known as Water Conservation Area 1 [WCA-1]) with the Hillsboro Canal. The project was originally cast as a single-phase effort to modify local hydrologic conditions so that more water could be stored to alleviate demands on water in LNWR. Without the project, during wet periods, runoff from LNWR is shunted to the ocean, while during dry periods, water is taken from the refuge to meet user demands elsewhere. With the Site 1 impoundment, water can be better managed to supply natural system demands within the LNWR. Project components included construction of a reservoir to store 13,300 acre-feet (AF) of water, a pump station, gated discharge culvert, spillway, and seepage control canal to retain more flows within the LNWR (USACE, 2013g; Figure 4-11). In 2009 the project was divided into two phases.
Construction of Phase 1 is under way, including the L-40 levee enhancements and seepage management measures, and is scheduled for completion by 2015 (L. Gerry, SFWMD, personal communication, 2014). Once these features are completed, designers anticipate a reduction in seepage loss from LNWR, but no natural system benefits can be reported at this time. Phase 2 of the project awaits congressional reauthorization necessitated by increased costs (NRC, 2012a).
Indian River Lagoon-South
The Indian River Lagoon and St. Lucie Estuary are biologically diverse estuaries located on the east side of the Florida Peninsula, whose ecosystems have been altered by polluted runoff from farmlands and urban areas and surges of freshwater (USACE, 2013d). These changes have reduced the abundances of many native species. The Indian River Lagoon-South project (Figure 4-1, No. 7) is designed to reverse this damage through improved water management, including the 56,000-AF C-44 storage reservoir, three additional reservoirs with a total of 97,000 AF of storage, four new stormwater treatment areas (STAs), dredging of the St. Lucie River to remove 7.9 million cubic yards of muck, and restoring 53,000 acres of wetlands, among other features (Figure 4-12). The project is anticipated to cost $1.45 billion (see Table 4-5).
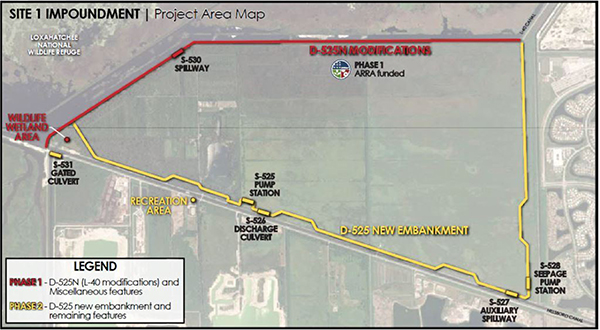
FIGURE 4-11 Phase 1 and 2 project elements of the Site 1 impoundment.
SOURCE: USACE (2013g).
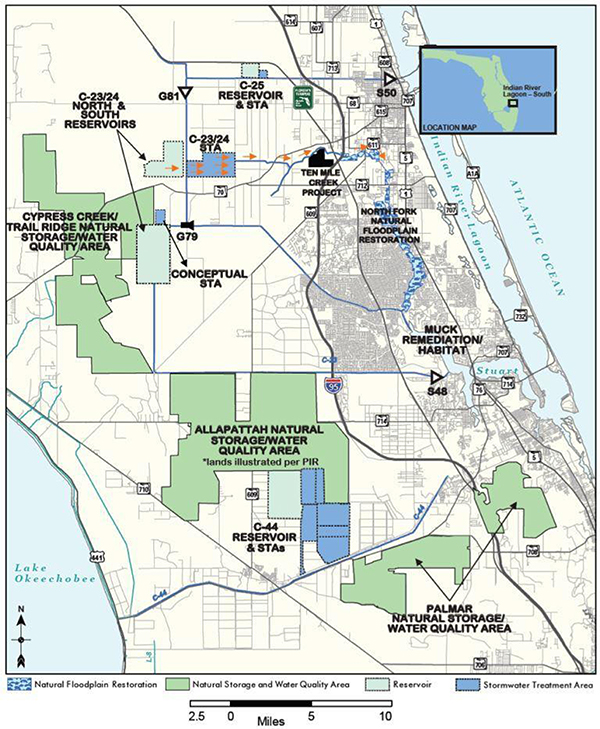
FIGURE 4-12 Components of the Indian River Lagoon-South restoration project.
SOURCE: USACE (2013d).
The Indian River Lagoon restoration project is just beginning. Preliminary work for the C-44 reservoir and associated 6,300-acre STA is under way, including an intake canal, access roads, culvert removal, and other improvements that are anticipated to be completed in summer 2014 (L. Gerry, SFWMD, personal communication, 2014). C-44 reservoir and STA construction is expected to begin in 2015, with an estimated completion date of 2020 for the C-44 reservoir and 2018 for the STA (H. Gonzales, USACE, personal communication, 2014). Additionally, operational changes have been made using existing water control structures to rehydrate the Allapattah Natural Storage Area (L. Gerry, SFWMD, personal communication, 2013). However, it is too soon to expect substantial restoration from this project based on the work completed to date.
Melaleuca Eradication and Other Exotic Plants
The Melaleuca Eradication and Other Exotic Plants Project is a CERP effort to address the potential threat to restoration posed by nonnative invasive plant species (see Chapter 6). Four invasive species that are particularly problematic are the focus of major ongoing management efforts: Melaleuca (Melaleuca quinquenervia), Brazilian pepper (Schinus terebinthifolius), Australian pine (Casuarina spp.), and Old World climbing fern (Lygodium microphyllum). A crucial part of this work is centered at the U.S. Department of Agriculture’s Invasive Plant Research Laboratory in Davie, Florida, where specific biological control agents—mostly insects—are developed. With CERP funds, USDA has constructed a 2,700-ft2 annex to the present laboratory to facilitate additional mass rearing (Figure 4-1, No. 8). The $4.5 million annex was completed in August 2013 and has been transferred to the local sponsor (USACE, 2014b; T. Morgan, SFWMD, personal communication, 2013). The project includes CERP operations and maintenance funding (estimated at $660,000/year) for mass rearing, release, and field monitoring of biocontrol agents to manage the spread of invasive nonnative plant species in the Everglades and South Florida (USACE and SFWMD, 2010). This project enables a more aggressive approach to biological control of invasive plants in the Everglades restoration area. It is too soon to document specific natural system benefits resulting from this CERP investment, although the expanded facility has increased the rearing capacity by 3- to 10-fold (P. Tipping, USDA, personal communication, 2014). Invasive species control in the Everglades is discussed in more detail in Chapter 6.
Generation 2 CERP Projects
Four second-generation CERP projects were authorized in June 2014 as part of WRRDA 2014 (Table 4-1). Although they had received no federal funding for
construction at the time of authoring this report, in two cases—Biscayne Bay Coastal Wetlands and the C-111 Spreader Canal projects—the State of Florida has expedited construction in advance of federal authorization.
Biscayne Bay Coastal Wetlands
The Biscayne Bay Coastal Wetlands are along the southeastern edge of the Florida Peninsula; the Miami-Dade County area at the western edge of Biscayne Bay is a unit of the national park system (Figure 4-1, No. 10, and Figure 4-13). The installation of canals has cut off a section of the wetlands from their source of freshwater sheet flows resulting in a loss of wetland ecosystems and causing an increase in salinity along the margin of the bay. The project seeks to reverse these effects on 11,300 acres of the total 22,500 acres of wetlands by installing pump stations, spreader canals, culverts, and canal plugs.
The project is in two phases: Phase 1 is a stand-alone project encompassing three geographic areas (Deering Estates Flowway, Cutler Wetlands, and L-31 Flowway), and Phase 2, which is not yet specifically planned. The three components of the Deering Estates Flowway—a spur canal extension, spreader canal, and pump station—were completed and became operational in December 2012; the two culverts in the L-31E canal designed to divert flows into coastal wetlands were finished in June 2010. The work on Cutler Wetlands has not yet begun. To date, $54 million has been expended on the $125 million Phase 1 project (T. Morgan, SFWMD, personal communication, 2013), although the project increments implemented so far have been rather small in the context of the original project objectives.
The Biscayne Bay Coastal Wetlands Project has begun to show some ecosystem restoration results (Figure 4-14). Deering Estates Flowway, which includes 170 acres of degraded freshwater wetlands that transition to tidal wetland (USACE and SFWMD, 2012a), has been in operation for only a few months, so data are preliminary and may show more about short-term variability than long-term trends. Since the completion of the Deering Estates work, water flows have elevated seasonable water surfaces by about 2.7 feet in wetland areas. There have been some observed improvements of reduced salinity in the coastal wetlands and in the establishment of more natural salinity gradients (from freshwater in the wetlands to saline water in the bay). Although salinity of surface water in the nearshore responds to freshwater infusions from the new S-700 pump station, there are many other potential control mechanisms on salinity that must be sorted out with the aid of longer monitoring records. Vegetation communities were surveyed in 2009, and will be resurveyed in 2015 (RECOVER, 2014a). The L-31E culverts have diverted approximately 3 percent of the canal flow in water years 2012 and 2013 into the adjacent coastal wetlands. Routine maintenance inspections
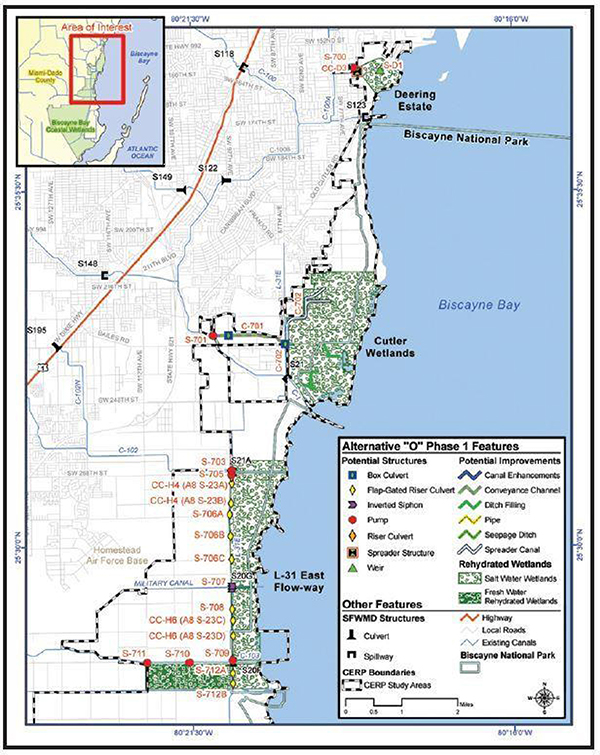
FIGURE 4-13 Biscayne Bay Coastal Wetlands project area in southeast Florida.
SOURCE: USACE (2014a).
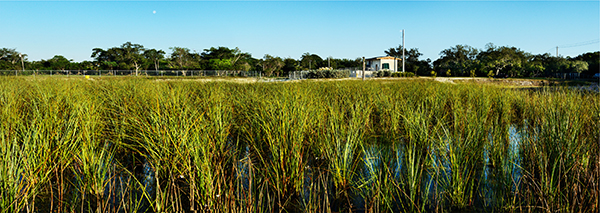
FIGURE 4-14 Pump house and planted wetland vegetation at Deering Estate Flowway, Biscayne Bay Coastal Wetlands. The hydrated surface with wetland vegetation replaces a dry surface without wetland vegetation.
SOURCE: Courtesy of the Deering Estate at Cutler and Brian F. Call Photography.
established that accumulation of aquatic vegetation, sediment, and silt hindered the performance of the L-31E culverts. The SFWMD removed accumulated downstream sediment, realigned downstream sumps and pipe inverts, and installed floating debris barriers across the mouth of each culvert inlet channel. This task was completed in August 2012 and has shown local improvements to the system.
Monitoring data for nearshore salinity show no trends related to completion of the L-31E feature. Vegetation communities are, however, showing some adjustment in the post-project period with a minor decrease in areal coverage of red mangrove overall and an increase in sawgrass on the estuarine side of the L-31E levee (RECOVER, 2014a). These minor or negligible results are consistent with the low volume of diverted flows in 2012-2013.
C-111 Spreader Canal
The C-111 canal (Figure 4-1, No. 9) is the southernmost canal for the entire Central and Southern Florida Project. Designed to provide drainage and an outlet for confined flood flows, the C-111 also eliminated sheet flow from the Southern Glades and drained water from Taylor Slough in Everglades National Park. The C-111 Spreader Canal project promises increased flow volumes in Taylor Slough through seepage control, return of sheet flow to wetlands, and improved salinity regimes in western Florida Bay. The project complements the ongoing C-111 South Dade Project (see Box 2-1), which has related project objectives. The
C-111 Spreader Canal project is structured in two phases, with the first phase (Western Project) to include two pumping stations, a 560-acre detention basin (the Frog Pond), along with various canal modifications for the Aerojet, L-31, and C-110 canals (Figure 4-15). The C-111 Spreader Canal Western Project is critical to the restoration of Taylor Slough in Everglades National Park and Florida Bay and was largely completed in February 2012 as described in NRC (2012a) and USACE (2013b) and is now operational.
Some quantitative assessments of project effects on natural system hydrology are available. For example, during the wet season of its first year in operation, from June through mid-November, the project moved an average of 811 AF per day (a total of about 140,000 AF) from the C-111 canal and transferred it
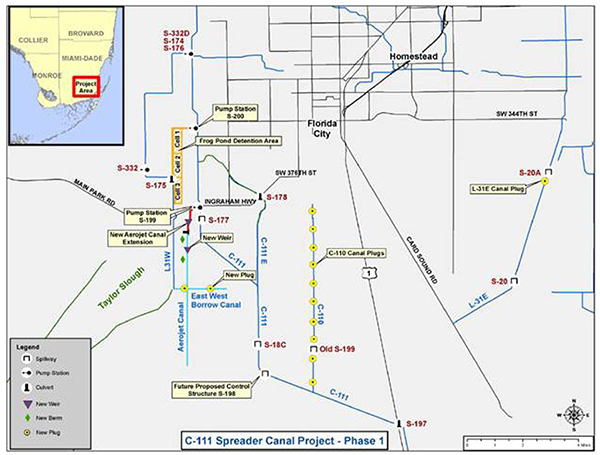
FIGURE 4-15 Project design features for C-111 Spreader Canal Western Project.
SOURCE: SFWMD (2013a).
to the Taylor Slough area of Everglades National Park (Audubon Florida, 2014). Taylor Slough now carries more water than prior to the completion of the C-111 Spreader Canal project. Taylor Slough now is wet 10 months out of the year rather than 3 months per year before the restoration efforts (Fleshler, 2014).
Recent research published in the refereed literature establishes some hydrologic improvements from the C-111 project. Kotun and Renshaw (2013) examined hydrologic data for the C-111 canal and for Taylor Slough and found that specific improvements were observed in the Taylor Slough hydrology between 2000 and 2010 when C-111 South Dade projects were in operation. Water surface level was maintained in the canal at heights above the surrounding terrain for 6 months each year, contributing to a hydrologic seepage barrier effect. Their data showed that a groundwater mound developed under the canal as expected, an approach to keep water in the slough and prevent its migration eastward. They also found that the hydroperiod in the Rocky Glades near Taylor Slough had been lengthened 90 days.
Ecosystem benefits are difficult to assign to a single restoration project. An important complication in interpreting the changes is that it is difficult to separate and identify benefits from the C-111 Spreader Canal project from the benefits of the closely related C-111 South Dade project. The C-111 South Dade detention areas, also designed to rehydrate Taylor Slough, were completed in 2009, and improvements in flows in Taylor Slough are likely to be connected to that project. Benefits from the ongoing C-111 Spreader Canal project are likely to be smaller but result in some additional flow in Taylor Slough (R. Johnson, NPS, personal communication, 2014).
Generation 3 Projects
Third-generation projects are near-term priorities, but they do not yet have a USACE-headquarters-approved PIR. Until congressionally authorized, implementation of these projects could only occur if expedited with state funding. Restoration efforts are under way on one third-generation CERP project—Loxahatchee River Watershed Restoration.
Loxahatchee River Watershed Restoration
The Loxahatchee River Watershed Restoration Project is a CERP project that has been expedited by SFWMD investment (Figure 4-1, No. 15; USACE and SFWMD, 2013c). The purpose of the project, located in the southern headwaters of the Loxahatchee River and north of LNWR (WCA-1), is to rehydrate several thousand acres of wetland habitat that has been desiccated by artificial drainage, provide restoration flows to the Northwest Fork Loxahatchee River,
and address saltwater intrusion. Although development of the PIR is still ongoing, the SFWMD has expedited installation of culverts and control structures leading to Loxahatchee Slough (Flowway 1) to raise water levels and lengthen periods of inundation, measures that affect about 5,000 acres (Figure 4-16). As of 2013, Martin County, a local sponsor partner, was implementing invasive species control efforts and construction of water control structures in the Cypress Creek (Flowway 3).6 Other partners in addition to SFWMD include Palm Beach County, the Loxahatchee River District, Florida Department of Environmental Protection, and the Florida Park Service. The river is a federally designated Wild and Scenic River, one of only two in Florida. Restoration related to the Loxahatchee River Watershed includes attempts to improve downstream areas all the way to the ocean, including the construction of 5.8 acres of new oyster habitat and refined operations of control structure S-46. Since 2011, releases of water to the northwest fork of the Loxahatchee River have reduced periods of low flows, attenuated high flows in the southwest fork, and reduced damaging high variability in salinity at the river mouth. The initial restoration steps under the Loxahatchee River Watershed CERP Project have not yet led to significant effects on the overall watershed behavior (Loxahatchee River District, 2013).
CERP Pilot Projects
Pilot projects are limited efforts designed to provide scientific or engineering knowledge that can be applied to improve major projects that result in natural system benefits. Additionally, pilot projects may inform larger projects to make them more timely and cost-effective. Pilot projects provide the opportunity to experiment with methods and approaches without the large expense of fully developed restoration projects. Below, we briefly review the Aquifer Storage and Recovery, Decomp Physical Model, and Seepage Management pilot projects.
Aquifer Storage and Recovery
Everglades restoration relies on increasing freshwater storage. In the CERP, aquifer storage and recovery (ASR) was proposed as the largest contributor to new storage, with more than 300 ASR wells providing up to 1.7 billion gallons of freshwater storage per day (or 500,000 AF/yr; USACE and SFWMD, 1999). Implementation of ASR in the Everglades would involve pumping excess surface water into the Floridan Aquifer system and recovering this stored water during dry periods to sustain freshwater flows (Figure 4-17). ASR is an established
______________
6 See http://xportal.sfwmd.gov/paa_dad/docs/F1077773745/32_Loxahatchee%20Storage%20-%20Barnett.pdf.
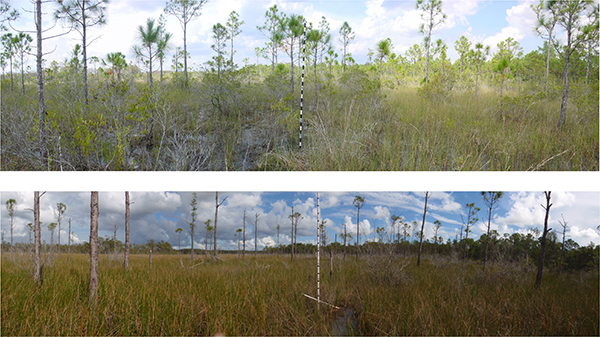
FIGURE 4-16 Restoration progress in the Loxahatchee Watershed from 2002 (top) to 2013 (bottom), showing the transition from upland species to more wetland species due to increased periods of inundation.
SOURCE: Palm Beach County Environmental Resources Management.
technology, but it had not been widely tested in South Florida. Therefore, the CERP ASR Pilot Project was conducted to address uncertainties and concerns regarding the efficacy and feasibility of ASR, particularly given the high costs of its implementation at the scale proposed by the CERP. The final report summarizing the findings of this 14-year pilot project was released in December 2013 (USACE and SFWMD, 2013a).
The CERP ASR Pilot Project focused on construction, operation, and monitoring of two facilities. The Kissimmee River ASR was built along the Kissimmee River, near its confluence with Lake Okeechobee, while the Hillsboro ASR was constructed along the Hillsboro Canal in southern Palm Beach County (Figure 4-1). The objectives of these pilot studies were to (1) assess ASR feasibility at two locations distinguished on the basis of surface-water chemistry, hydrogeologic conditions, and surface-water distribution configurations; (2) evaluate technical and regulatory compliance issues stemming from ASR operation; and (3) quantify operation costs. The final technical data report describes, in considerable detail, the various elements of these pilots, including planning and
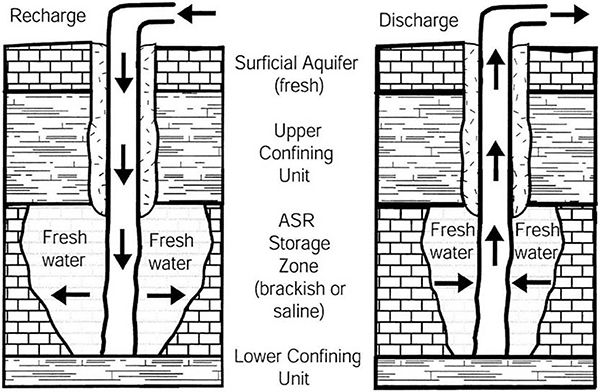
FIGURE 4-17 Schematic diagram of the recharge and recovery phases of ASR for a typical South Florida system.
SOURCE: NRC (2001).
permitting, system design and construction, groundwater hydrogeology, regulatory compliance, surface-water and groundwater quality testing, and ASR system costs (USACE and SFWMD, 2013c).
Both ASR pilot systems were operated for multiple recharge-storage-recovery cycles, with each cycle increasing in length and thus volume of water stored. More than 1 billion gallons of water were stored for a 1-year period during the fourth cycle test of the Kissimmee River ASR pilot, making this test one of the largest single-well recharge events conducted in Florida.
Findings from the pilot projects are generally encouraging from the standpoint of operational efficacy, and most problems that emerged during cycle testing were resolved. Recoveries of stored freshwater were approximately 100 percent for the four cycle tests at Kissimmee River, but were lower (21 to 85 percent) during the three cycle tests of the Hillsboro ASR pilot, owing to mix-
ing with brackish formation water. Water quality analyses revealed that the recharge waters at both facilities were in compliance with respect to all primary constituents except total coliforms. Total coliforms were detected in both the Kissimmee River and Hillsboro ASR wells in excess of the 4-CFU/100 mL criterion, suggesting that the ultraviolet disinfection systems used to treat the surface water prior to injection were insufficiently effective. Analysis of groundwater collected from storage-zone monitoring wells indicated that arsenic concentrations exceeded the 10-μg/L criterion at both facilities. Arsenic concentrations peaked during the first cycle test, but, at both facilities, fell to permissible levels prior to the onset of the next cycle test. Measurements of pressure made within the ASR wells during freshwater recharge remained below 70 psi, which is less than the pressure necessary to induce hydraulic fracturing.
The final construction costs differed significantly between the two ASR pilot projects. The costs of the surface facility, ASR well, and monitoring wells at Kissimmee River equaled $7.9 million, while the costs of these components at the Hillsboro ASR facility equaled $4.3 million. Operational costs ranged from $104 per million gallons of water during the recovery phase at the Hillsboro facility to $401 per million gallons of water during the recharge phase at the Kissimmee River facility. Labor and electric power represented the greatest portion of operational costs. The lessons learned through implementation of these pilot projects should improve planning, design, and operational efficiency which, in turn, should lower costs as more ASR systems are deployed.
Several issues deserving attention were identified through analysis of the ASR pilots. For example, improved approaches must be adopted to disinfect recharge water, and the supervisory control and data acquisition system requires further refinement. Aside from these sorts of existing issues, additional challenges will be encountered as new ASR facilities are constructed and operated on sites that differ with respect to water quality, geological properties, and hydrologic conditions. Nevertheless, these pilot studies have provided evidence that ASR is a technically feasible approach for increasing freshwater storage in the Everglades, and the report provides cost data that allow planners to compare ASR against other available storage alternatives (NRC, 2005).
A report on the regional effects of multiple ASR wells in the Everglades is anticipated in 2014. This regional-study report is likely to address several outstanding issues that are needed to evaluate the feasibility and appropriateness of large-scale implementation of ASR within South Florida. These issues include, but are not limited to, overall costs for construction, operation, and monitoring; systemwide energy demands associated with the conveyance and treatment of large volumes of water; and the potential effects of large-scale ASR operations on regional groundwater flow patterns, water supply, and water quality.
Decomp Physical Model
The Decomp Physical Model (DPM) is a large-scale field experiment intended to inform project planning decisions by reducing uncertainty about the ecological effects of various options for restoring sheet flow to the ridge-and-slough landscape. The experiment involves measuring biophysical responses to canal and levee modifications and is intended to address the following questions:
• Sheet flow questions: To what extent do entrainment, transport, and settling of sediments differ in ridge-and-slough habitats under high- and low-flow conditions? Does high flow cause changes in water chemistry and consequently changes in sediment and periphyton metabolism and organic matter decomposition?
• Canal backfill questions: Will canal backfill treatments act as sediment traps, reducing overland transport of sediment? Will high flows entrain nutrient-rich canal sediments and carry them into the water column downstream? To what extent are these functions altered by the various canal backfill options, including partial and full backfills?
The DPM experiment is being conducted between L-67A and L-67C, in an area near the border of WCA-3A and WCA-3B known as the “the pocket” (Figure 4-18). In preparation for the experiment, 10 gated culverts on the L-67A canal (S-152, shown in Figure 4-18) were built. A 3,000-ft gap in the L-67C levee and three backfill treatments in the adjacent canal were completed in October 2013. The canal was left completely open for the northernmost treatment, while the center and southernmost treatments have partial and complete backfills, respectively.
A pulse-flow experiment was initiated on November 5, 2013, by opening the 10 gated culverts that make up S-152. This allowed water from the L-67A canal to enter the marsh and flow in a southerly direction toward the 3,000-ft gap in the L-67 levee and portions of the adjacent canal that remain open or have been partially or completed backfilled. Analysis of initial results from a dye-tracer release suggests that surface-water velocities within the slough increased several-fold, exceeding 3 cm/s in some locations (Figure 4-19). These hydrologic changes are, in turn, expected to affect sediment entrainment, transport, and deposition, which are processes believed to be instrumental in the maintenance and formation of Everglades ridge-and-slough topography. The pulse flow was maintained for 2 months, and two additional pulses are planned in 2014 and 2015 (F. Sklar, SFWMD, personal communication, 2014).
An extensive suite of measurements are being made during the experiment to characterize the spatiotemporal variability in surface-water depth and velocity,
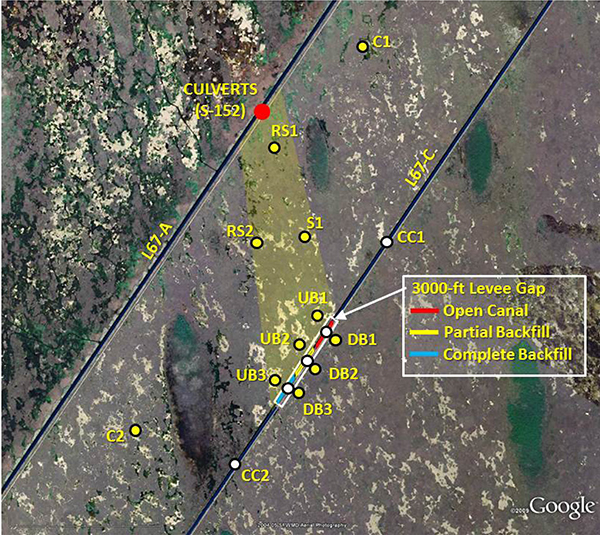
FIGURE 4-18 Map of the Decomp Physical Model located in “the pocket” between L-67A and L-67C.
SOURCE: Sklar (2013).
sediment transport in the marsh, sediment accumulation and entrainment rates in the L-67C canal, surface-water chemistry, and suspended-sediment composition. Observations of fish, macroinvertebrate, and amphibian density are also being taken in coordination with measurements of vegetation structure. The physicochemical and ecological measurements being made during the experiment will be compared with baseline data that have been collected since 2010, prior to the beginning of DPM construction. Analysis of the data will require
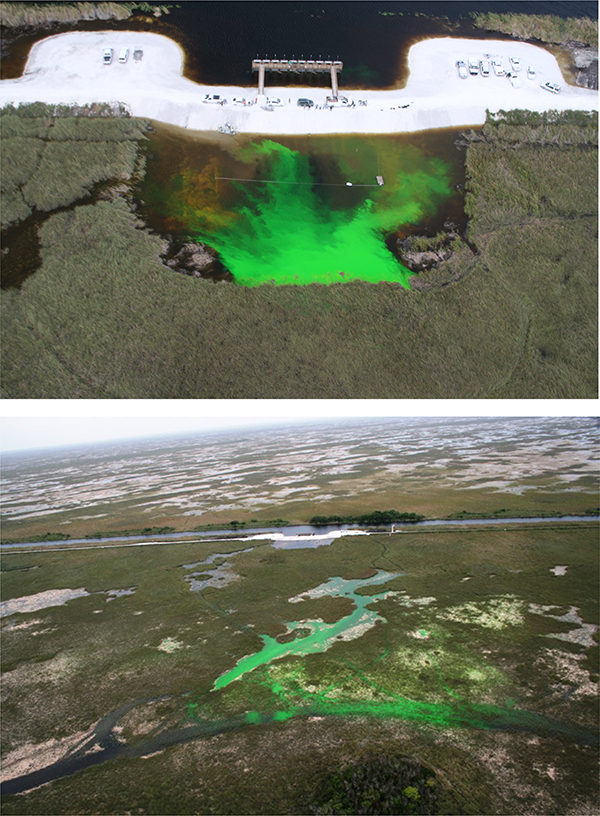
FIGURE 4-19 Distribution of fluorescein dye within the ridge and slough at 1 hour (top) and 1,300 hours (bottom) after its release into the open water at a point adjacent to S-152.
SOURCE: F. Sklar, SFWMD, personal communication, 2014.
several months, but the project scientists should begin reporting preliminary results in spring 2014.
Seepage Management
Seepage, when used in context of the CERP, generally refers to groundwater movement. Seepage management involves regulating the exchange of groundwater between compartmentalized areas of the Everglades that are separated from one another by canals and levees. Groundwater and surface-water reservoirs of the Everglades are hydraulically connected. Therefore, management of groundwater seepage affects surface-water hydropatterns, and conversely, manipulation of surface-water levels in canals and impoundments through operation of control structures affects the magnitude and direction of groundwater seepage.
Seepage management has focused most intensively on the north-south boundary separating the remnant Everglades from isolated pockets of agricultural land and large urban areas that have sprawled inland from the Atlantic Coast. Plans to manage seepage across this boundary have not escaped controversy. Restoration relies on holding water within the Everglades and thus lowering groundwater seepage compared with current levels. However, too much seepage control would lower the hydraulic heads within the region’s drinking-water well fields, making them susceptible to saltwater intrusion. Others express concern that restricting seepage from the Everglades would reduce freshwater flows to Biscayne Bay. Thus, understanding seepage management strategies is critical to meeting these multiple objectives as well as the Savings Clause in WRDA 2000, which mandated that the CERP not impact existing water supplies.
The most progress on understanding seepage management can be traced to a non-CERP project that is being privately funded by the Limestone Products Association in exchange for wetland mitigation credits. This pilot project centers around the construction of a 2-mile-long seepage barrier. The barrier extends south of Tamiami Trail between the north-south trending L-31 Levee and L-31N Canal (Figure 4-20). The hydrology of this area is dominated by the L-31N Canal, which cuts through the exceedingly permeable bedrock of the Miami Limestone Formation and into the top layers of the Fort Thompson Formation. During the wet season in particular, the L-31N Canal diverts groundwater, drawn primarily from the northeastern portion of Everglades National Park, to the C-111 basin in south Miami-Dade County. The seepage barrier is intended to reduce this groundwater discharge to the L-31N Canal, thereby increasing water levels and promoting greater sheet flow in northeast Shark River Slough.
The 2-mile seepage barrier was completed on time in July 2012, only 5 months after excavation began. Construction of the barrier was an impressive
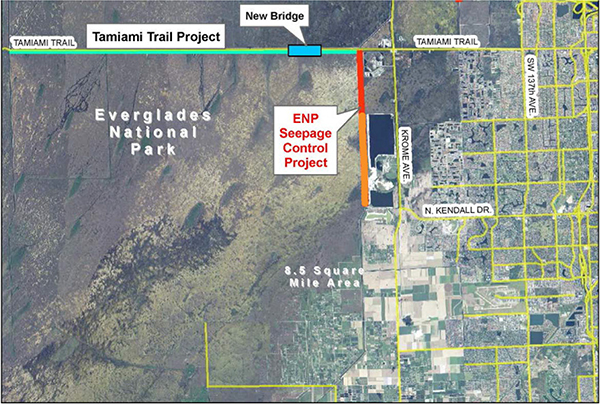
FIGURE 4-20 Position of the 2-mile-long, 35-foot-deep seepage barrier (shown in red), west of the L-31N Canal. The orange line represents a possible 3-mile extension of the project.
SOURCE: MacVicar (2014).
technological feat and involved excavating a 32-inch-wide trench to a depth of 35 feet below ground surface using a bedrock trenching machine that resembled a giant chain saw.7 The trench was filled with a concrete-bentonite slurry formulated specifically for this application.
The performance of the L-31N seepage barrier is being evaluated through an ongoing monitoring program including automated measurements of hydraulic head in six pairs of groundwater monitoring wells. The four, northernmost pairs consist of wells on the upgradient and downgradient sides of the seepage barrier. The two, southernmost pairs of monitoring wells are positioned at control sites beyond the terminus of the seepage barrier. The groundwater measurements are
______________
supplemented by stage and velocity measurements made at five locations along the L-31N Canal. Measurements of changes in discharge along the canal are used to estimate groundwater seepage into L-31N.
Hydrologic conditions have been monitored for 20 months since completion of the construction of the seepage barrier. The hydrologic measurements reveal that groundwater hydraulic heads have responded to installation of the seepage barrier. Moreover, the data demonstrate that the subsurface barrier is lowering rates of groundwater seepage from Everglades National Park into the L-31N Canal (Figure 4-21). The observed reductions in seepage approximate those predicted by a groundwater flow model developed to inform the design of this pilot project. Based in part on these encouraging observations of seepage reduction, Everglades National Park is supporting a proposal for a 3-mile southward extension of the seepage barrier that is currently under review by the Lake Belt Committee (Figure 4-20; R. Johnson, NPS, personal communication, 2014).
The LPA seepage management pilot provides a good example of incremental adaptive restoration, by providing tangible increments of restoration while
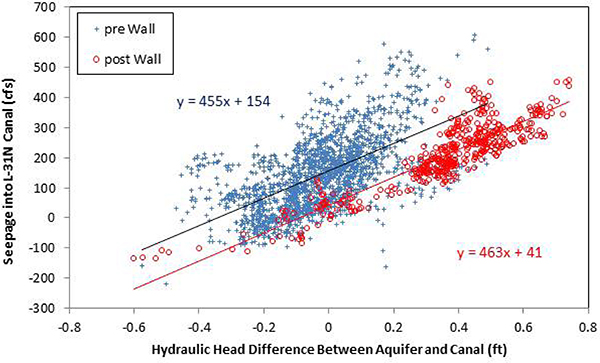
FIGURE 4-21 Reduction in groundwater seepage into L-31N Canal due to presence of seepage barrier.
SOURCE: MacVicar (2013).
working to resolve questions that prevent implementation of the full-scale project (NRC, 2007). The project also appears to offer the potential for substantial seepage management at little to no CERP cost.
Non-CERP Projects
CERP projects are not the only restoration efforts ongoing in the Everglades region. Several non-CERP projects are critical to the overall success of the restoration program, and their progress directly affects CERP restoration progress. Four important non-CERP efforts with new information on their restoration progress are reviewed in this section: the Modified Water Deliveries Project, the Everglades Restoration Transition Plan, the Kissimmee River Restoration Project, and the Seminole Big Cypress Water Conservation Plan. Progress on the C-111 South Dade project was discussed previously in the context of the related CERP C-111 Spreader Canal project.
Modified Water Deliveries and the Tamiami Trail Bridge
Congress provided legislative authority in 1989 for the creation of a project to improve water flows into Everglades National Park, where Everglades microtopography and vegetation were in decline as a result of lack of sufficient inflows. In 1992 the General Design Memorandum for the Modified Water Deliveries to Everglades National Park Project (Mod Waters; USACE, 1992) envisioned several features to increase the flow of water from WCA-3 into Everglades National Park to accommodate flows up to 4,000 cubic feet per second (cfs). The memorandum also provided mitigation of the effects of those flows for the 8.5-square mile area (an area of private development and residences), and the establishment of conveyance and seepage control measures (NPS, 2012; USACE, 2011c). Proposed plans to reach these original project goals have varied over time (for more details on the complex history of the Mod Waters project, see NRC, 2008), but there now appears to be general agreement on the steps necessary to complete the Mod Waters project.
As of December 2013, significant portions of the Mod Waters project have been completed. Protection for the 8.5-square-mile area is substantially complete, and many of the planned conveyance and seepage control features have been constructed (USACE, 2013a), including installation of the S-355A and B gated structures in the L-29 levee, S-333 modifications, four of nine planned miles of reduction for the L-67 Extension levee, installation of the S-356 pump station, and raising the Tigertail Camp (a tribal residential area). A central feature of the Mod Waters project—improved conveyance across the Tamiami Trail—is now partly complete with the construction of the 1-mile eastern bridge (Fig-
ure 4-22) and the completion of raising the roadbed to accommodate higher canal stages.
The completion in March 2013 of the 1-mile bridge is a major step in restoration of the hydrology and ecology of Shark River Slough in Everglades National Park. The bridge and the raising of the remainder of the roadbed allows for increased elevations in the L-29 canal, immediately north of Tamiami Trail. These higher levels provide an increased head (height differential between the canal surface in WCA-3B and Shark River Slough in Everglades National Park) that results in peak flows of 1,848 cfs into the park, an increase of 47 percent over
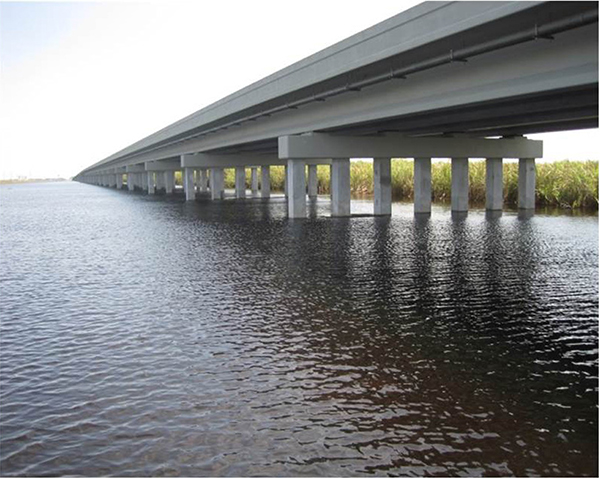
FIGURE 4-22 The newly constructed 1-Mile Tamiami Trail bridge, showing conveyance area beneath the newly elevated highway.
SOURCE: R. Johnson, NPS, personal communciation, 2014.
pre-bridge conditions, although still well below the original goal of 4,000 cfs (NPS, 2012). The Next Steps project, directed by the National Park Service, has completed an environmental impact statement with a plan to support up to a total of 5.5 miles of additional bridging. The Park Service is presently working on planning and design for the next bridge, about 2.6 miles long (DOI, 2013). In August 2013, Governor Scott announced a commitment of $90 million in state funds for a 2.6-mile bridge to match federal funding to reach the total cost of $180 million (Scott, 2013).
There are several unfinished features of Mod Waters and unresolved issues, however, that must be addressed before the project can be operated to deliver ecosystem benefits. Some features in the protection of the 8.5-square-mile area remain unfinished, and land acquisition and easement issues must be resolved to complete the project. Additionally, an operations plan must be developed, and operation of the project is dependent upon completion of an unfinished contract of the C-111 South Dade project, which has been stalled over cost-sharing disagreements. Finally, water quality concerns regarding compliance under Appendix A of the Consent Decree must be resolved before more water will be supplied to Everglades National Park (T. Morgan, SFWMD, personal communication, 2013). Completing the Mod Waters project and overcoming these final constraints deserves high priority to expedite restoration benefits from substantial prior restoration investments at relatively low additional cost (approximately $19 million; see Table 4-4).
Everglades Restoration Transition Plan
Water control for WCA-3 influences surrounding lands, including Everglades National Park and Big Cypress National Preserve, as well as the distribution of water within the 921-square-mile Water Conservation Area. Longstanding challenges include balancing the right quantities of water and timing of flows to habitats hosting the endangered Cape Sable seaside sparrow and other areas providing food and nesting space for the endangered snail kite (Figure 4-23) and wading bird species. Additionally, tree islands and ridge and slough topography in the WCA-3 were being degraded by water levels that were too high in some places and too low in others. An interim operating plan (IOP) was ineffective in dealing with the various demands on water management, and in October 2012, the plan was replaced by the Everglades Restoration Transition Plan (ERTP) (USACE, 2012c).
The ERTP was designed to provide a flexible multispecies approach to water operations associated with WCA-3 by balancing the various demands for specific water levels in specific places at designated times of the year. It establishes targets for wet-season high water levels, recession rates, dry-season low water levels, and ascension rates (Figure 4-24), and calls for increased operational flexibility

FIGURE 4-23 Snail kite, an endangered species likely to be benefited by the Everglades Restoration Transition Plan.
SOURCE: http://www.saj.usace.army.mil/SharedMedia/saj/2012/Nov/1/121022-A-CE999-001.JPG.
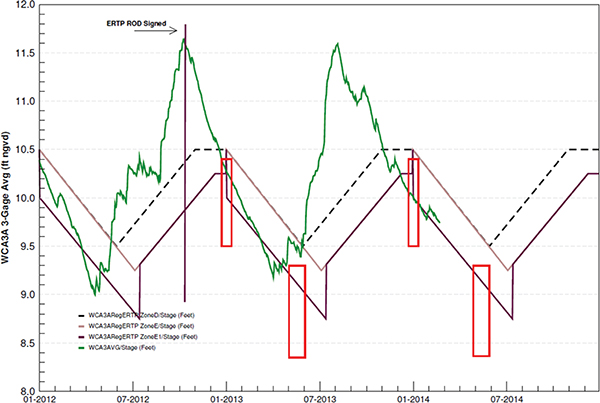
FIGURE 4-24 ERTP targets versus observed performance, 2012-2013. The slanting horizontal boxes delineate operational regulation zones, and the vertical red boxes represent desired water levels for snail kites, apple snails, and wading birds at key points in the annual water cycle. The green line represents actual water levels. The system operated under the interim operational plan (IOP) during January to October 2012 and ERTP thereafter, although the figure plots ERTP targets throughout.
SOURCE: R. Johnson, NPS, personal communication, 2014.
in order to meet these objectives. The plan lowered wet season regulation stages by 0.25 feet and dry season stages by 0.5 feet (USACE, 2012b), reducing stages in northern and central WCA-3A relative to the IOP schedule. Under the new arrangements, there will be no mandatory seasonal closure of the S-12C gate to allow more water to flow southward into Everglades National Park in cases of unusually high water in Southern WCA-3A (USACE, 2011a).
In the first year of ERTP operation, the dry season recession rate and the wet season ascension rate were both somewhat faster than the target rate, and both wet- and dry-season high water levels were higher than target levels, just
as they had been the previous year under the IOP (Figure 4-24). Deviations from targets were actually larger in the first year of operation under ERTP, which water managers attributed to a wet season that began early and was unusually wet, along with a dry season (November 2012 to March 2013) with significantly less rainfall than average (USACE, 2013b). Deviations in dry- and wet-season water levels were sufficient to exceed levels of incidental take of endangered species specified in the Biological Opinion of the ERTP (FWS, 2010). The threshold deviation in short-term recession rate was also exceeded several times in water year (WY) 2013, due to below-average rainfall in the first 3 months of 2013 (USACE, 2013a).
The ERTP has a number of ecological targets and performance measures for individual species and ecological components (USACE, 2011a) derived from the multispecies management strategy (FWS, 2010). The difficulties experienced in meeting overall ERTP performance targets are reflected in failure to meet many of these more specific targets (Table 4-6). In the spirit of adaptive management, water managers have assessed the causes of performance failures and made adjustments designed to improve performance in future years. However, under the ERTP, the WCAs are to be managed to provide flood control and water supply, as well as
TABLE 4-6 ERTP Performance Targets for Endangered Species and Other Ecological Components of Special Concern
| Measure | 2011 | 2012 | 2013 | |
| Cape Sable Seaside Sparrow | ||||
|
>60 days dry conditions subpopulation A |
Yes | Yes | No | |
|
Water level subpopulation A < 7 ft by 12/31 |
Yes | Yes | Yes | |
|
Hydroperiod 90-210 days for six subpopulations |
— | — | 2 Yes, 6 No | |
| Snail Kite | ||||
|
9.8-10.3 ft WCA-3A by 12/31 |
Yes | Yes | Yes | |
|
8.8-9.3 ft WCA-3A from 5/1 to 6/1 |
Yes | No | No | |
| Apple Snails | ||||
|
Recession of 1 ft at rate of 0.05 ft per week |
No | Yes | Yes | |
|
Ascension rates < 0.25 ft per week February-September |
Yes, 8/8 months | Yes, 8/8 months | Yes, 7/8 months | |
| Tree Islands | ||||
|
Peak < 10.8 ft WCA-3A |
Yes | No | No | |
|
< 60 days above 10.8 ft WCA-3A |
Yes | Yes | No | |
NOTES: “Yes” indicates achievement of target, “No” indicates failure to achieve target, and “—“ indicates not measured.
SOURCE: USACE (2013a).
to provide viable wetland habitat (USACE, 2011a). Thus, in many cases, failure to meet a particular target is attributed to excessive or deficient rainfall at particular times (USACE, 2013a), which imposes constraints related to flood control and water supply on operations that impact the flexibility required to achieve ecological goals. Also, the potential of ERTP to produce ecological benefits will be limited until the Modified Waters Delivery Project is fully operational. Still, the ERTP is providing opportunities for learning, and its ecological goals represent informed management of the natural system for multiple species. It provides the means to simultaneously address the needs of multiple species within the current constraints imposed on water management and by the current condition of the natural system. One cannot, however, expect the ERTP to produce significant changes in those conditions, such as a shift in the distribution of water from western to northeastern Shark River Slough or more flow into Everglades National Park and Florida Bay, that the CERP is designed to achieve.
State Water Quality Treatment Projects
As part of its Long-Term Plan for Achieving Water Quality Goals, the state has completed construction of STA Compartments B and C, and now has approximately 57,000 acres of STAs that are permitted to operate (Figure 4-25). Meanwhile, enhancements to maintain or improve the performance of existing STAs continue, such as regrading some cells to address hydraulic short-circuiting and converting or reestablishing vegetation as needed (Andreotta et al., 2014).
STA Performance. The STA performance, compliance, and optimization are summarized in the annual South Florida Environmental Reports (Andreotta et al., 2014; Ivanoff et al., 2013). Additionally, NRC (2010) summarizes key issues and challenges regarding STA performance. This section reviews recent STA performance in light of long-term goals.
During WY 2012 (May 1, 2011, to April 30, 2012), a relatively dry year with low hydraulic loading rates, the six STAs reduced inflow total phosphorus (TP) flow-weighted mean concentrations from 111 to 19 μg/L (Table 4-7; Ivanoff et al., 2013). With the exception of STA-5 and STA-6, all other STAs produced outflow TP concentrations of <25 μg/L.8 During the wet WY 2013, STAs received a higher average hydraulic loading rate and produced outflow
______________
8 Both STA-5 and STA-6 receive highly phosphorus-enriched waters from the C-139 basin and these STAs are subjected to frequent drying conditions as a result of inconsistent water availability. Unlike other STAs, STA-5 and STA-6 are dominated by cells with emergent vegetation. These issues have been addressed by adding additional treatment area and combining both STAs. In addition, submerged aquatic vegetation cells were added to STA-5/6, which significantly improved the outflow TP concentrations (see Table 4-8).
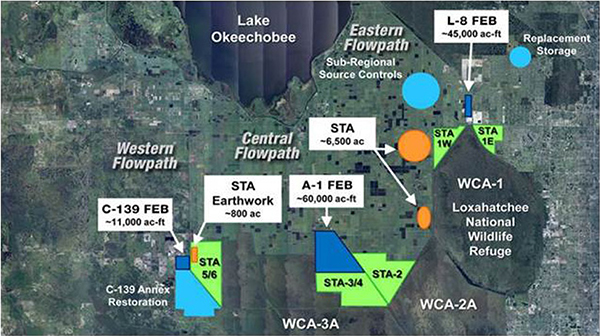
FIGURE 4-25 Location of the Everglades stormwater treatment areas (STAs): STA-1E, STA-1W, STA-2, STA-3/4, and STA-5/6 and the planned locations for additional STAs, STA earthwork, and flow equalization basins (FEBs) associated with the Restoration Strategies plan.
SOURCE: http://www.sfwmd.gov/portal/page/portal/xrepository/sfwmd_repository_jpg/map_restoration_strategies.jpg.
TABLE 4-7 STA Performance During WY 2012 (May 1, 2011, to April 30, 2012)
| STAs | Hydraulic Loading Rate (cm/day) | Inflow TP (μg/L) | Outflow TP (μg/L) | TP Inflow Load Rate (g/m2 per year) | TP Retained Load Rate (g/m2 per year) | % TP Removal Efficiency |
| STA-1E | 1.4 | 109 | 21 | 0.56 | 0.46 | 83 |
| STA-1W | 1.2 | 143 | 22 | 0.63 | 0.54 | 85 |
| STA-2 | 2.6 | 87 | 12 | 0.82 | 0.69 | 84 |
| STA-3/4 | 1.4 | 109 | 19 | 0.54 | 0.44 | 82 |
| STA-5 | 0.6 | 156 | 32 | 0.37 | 0.30 | 82 |
| STA-6 | 1.7 | 126 | 75 | 0.78 | 0.53 | 68 |
| All STAs | 1.4 | 111 | 19 | 0.58 | 0.48 | 83 |
SOURCE: Data from Ivanoff et al. (2013).
flow-weighted TP concentrations ranging from 14 to 36 μg/L (Table 4-8). High outflow TP in STA-1E and STA-1W was due to high phosphorus loading rate, approximately two times higher than in STA-2 and STA-3/4. Overall, WY 2013 data show positive signs that STAs are performing well with an average outflow TP concentration of 21 μg/L.
Compared with the period of record (Table 4-9), the past 2 years, including both wet and dry conditions, demonstrate substantial improvement in STA performance for most of the STAs when TP loading was maintained at <1 g P/m2 per year. Long-term data during the period of record show a direct relationship between outflow TP concentrations and inflow TP concentrations (Table 4-9), suggesting that maintaining low inflow TP levels may be needed to achieve low outflow TP levels, although other biotic and abiotic factors also play important roles. Overall, during the period of record, STAs have experienced variable loadings, extreme weather conditions, and internal management of vegetation. STA-2 and STA3/4 are the best-performing STAs over the period of record, due to
TABLE 4-8 STA Performance During WY 2013 (May 1, 2012 to April 30, 2013)
| STAs | Hydraulic Loading Rate (cm/day) | Inflow TP (μg/L) | Outflow TP (μg/L) | TP Inflow Load Rate (g/m2/year) | TP Retained Load Rate (g/m2/year) | % TP Removal Efficiency |
| STA-1E | 2.6 | 207 | 26 | 2.0 | 1.7 | 87 |
| STA-1W | 2.1 | 245 | 36 | 1.9 | 1.6 | 83 |
| STA-2 | 2.6 | 106 | 22 | 1.0 | 0.8 | 78 |
| STA-3/4 | 2.5 | 105 | 14 | 0.9 | 0.8 | 86 |
| STA-5/6 | 0.6 | 131 | 17 | 0.3 | 0.3 | 90 |
| All STAs | 2.1 | 138 | 21 | 1.1 | 0.9 | 84 |
SOURCE: Data from Andreotta et al. (2014).
TABLE 4-9 Performance of STAs over the Entire Period of Record of Each STA’s Operation
| STAs | Start Date [Years in operation] | Inflow TP μg/L (SD) | Outflow TP μg/L (SD) | TP Inflow Load (mt) | TP Retained Load (mt) | % TP Removal Efficiency |
| STA-1E | 2004 [9] | 179 (54) | 52 (115) | 173 | 125 | 72 |
| STA-1W | 1993 [20] | 175 (56) | 50 (31) | 739 | 522 | 71 |
| STA-2 | 1999 [14] | 103 (38) | 22 (9) | 392 | 302 | 77 |
| STA-3/4 | 2003 [10] | 113 (29) | 17 (4) | 584 | 493 | 84 |
| STA-5/6 | 1999 [16] | 179 (59) | 74 (40) | 436 | 286 | 66 |
| All STAs | 1994-2012 | 140 (25) | 37 (13) | 2,323 | 1,727 | 74 |
SOURCE: Data from Andreotta et al. (2014).
long-term low TP loading rates (<1.0 g P/m2 per year) (Table 4-9). Rehabilitation of STA-1W in 2007, combined with low loading rates in WY 2012, appears to have improved its performance in WY 2012 and 2013 compared with the period of record. It is expected that implementation of additional treatment area and flow equalization basins (see Restoration Strategies in the next section) is likely to reduce STA loading rates and therefore improve the outflow TP concentrations. However, sustained performance of STAs depends on the effectiveness of these restoration strategies and consistent hydraulic and TP loading to the STAs.
Restoration Strategies. In 2012, the State of Florida announced its Restoration Strategies Regional Water Quality Plan to ensure that sufficient treatment is provided for the approximately 1.4 million AF/yr currently flowing into the Everglades Protection Area to meet the legally required water quality standard. The plan was proposed as an alternative to the approach set forth by the U.S. Environmental Protection Agency in its 2010 Amended Determination. The plan includes six projects that create approximately 6,500 acres of new STAs and 116,000 AF total capacity in three new flow equalization basins (FEBs), which are intended to moderate inflows into existing STAs and thereby improve their treatment performance (Figure 4-25). The Restoration Strategies plan also includes some earthwork in STA-5/6 as well as additional source controls to reduce nutrient loads on the STAs.9 The Restoration Strategies plan was formally launched in September 2012, and the SFWMD FY 2014 budget includes nearly $102 million toward the $880 million plan. The state anticipates that the entire plan will not be constructed and fully implemented until 2024, but the A-1 FEB in the central flow path could come online as soon as 2016 (Leeds, 2014). The SFWMD plans to initiate construction of the A-1 FEB in June 2014 and already has construction of the L-8 FEB under way.10 The plan’s focus on providing significant additional flow equalization and water quality treatment is a significant development with important implications for restoration of both water quality and flow in the central Everglades (see Chapter 3).
As described in Chapter 3, water from the STAs cannot be redistributed in the Central Everglades Planning Project unless it meets the water quality-based effluent limitation (WQBEL) set forth in the National Pollutant Discharge Elimination System (NPDES) permit currently in effect.11 The NPDES permit covers discharges
______________
9 See http://www.sfwmd.gov/portal/page/portal/xweb protecting and restoring/restoration strategies#projects.
10 See http://www.sfwmd.gov/portal/page/portal/xrepository/sfwmd_repository_pdf/restoration_strategies_update_2013_nov.pdf.
11 After release of the report in prepublication form, it was pointed out that this sentence was not clear about which agencies are responsible for permit compliance decisions. As noted in Chapter 3, FDEP, with oversight from EPA, is the permitting authority that would interpret compliance associated with the redistribution of water.
from all STAs. However, as described above, the STAs currently operate at very different levels of efficacy. Certain STAs, such as STA-2 and STA-3/4 (Figure 4-25) in the central flow path, are the best performing and consistently have outputs that are approaching the limitations prescribed by the WQBEL in the NPDES permit (not to exceed an annual flow-weighted mean (FWM) of 13 μg/L total phosphorus in more than 3 out of 5 years, and an annual FWM of 19 μg/L in any water year). Other STAs are not performing as well and it could take more time and work to bring the discharges from these STAs into compliance with NPDES permit requirements. While the committee recognizes the need to comply with all applicable law, including federally approved water quality standards and the WQBEL set forth in the NPDES permit, the agencies may be unnecessarily constraining themselves (and restoration progress) by concluding that all STA discharges must comply with the WQBEL before any water from any STA can be released to the Everglades. As discussed in Chapter 3, the agencies should consider permitting mechanisms and, if necessary, design and implementation alternatives that would allow discharge and redistribution of water from a flow path that meets the WQBEL rather than postponing the redistribution of WQBEL-compliant discharge until all STAs are WQBEL-compliant. If a revision to the NPDES permit is necessary to authorize each STA (or subsets of the STAs, by flow path) to discharge as soon as the WQBEL requirements are met, the agencies should take the necessary steps to revise the permit to expedite restoration in the central Everglades and avert ongoing ecosystem declines caused by a reduced flow (NRC, 2012a).
Kissimmee River Restoration
The Kissimmee River drains the northern extremity of the entire Everglades watershed, rising from lakes in the vicinity of Orlando, and flowing south to empty into Lake Okeechobee. The Central and Southern Florida Project caused widespread changes in the hydrology, geomorphology, and ecology of the Kissimmee River. The previously meandering, 103-mile-long channel was replaced by an artificial channel 55 miles long, control gates and pumps were installed, and much of the floodplain was drained (USACE, 2012b). Unforeseen consequences included a wholesale change in the bed and banks of the river from sandy conditions to organic-rich fine materials with an accompanying loss of native fishes. The replacement of freshwater wetlands with drained pasture lands on the floodplain resulted in the loss of habitat for numerous waterfowl and wading birds. Seventy-five percent of the historically active floodplain was disconnected from the river; waterfowl populations declined by 90 percent (Blake, 1980). Additionally, the river became a major source of phosphorus for Lake Okeechobee, derived from drainage from agricultural lands.
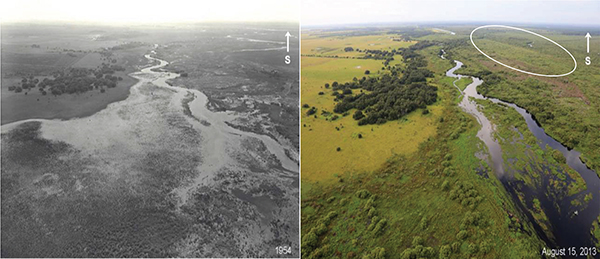
FIGURE 4-26 Photos showing the natural historic Kissimmee River and floodplain in 1954 prior to channelization of the river (left), and the same view after canal filling and river restoration (right). The filled channel is circled in the right-hand figure.
SOURCE: T. Morgan, SFWMD, personal communication, 2013.
Two restoration projects were designed to reverse these impacts. The Kissimmee Headwaters Revitalization Project refined operations in the headwaters of the basin by canal refinements, construction of supplemental levees, and improved management of control gates that regulated the outflow of the four primary lakes in the region, and was completed in 2012. The more extensive Kissimmee River Restoration Project was congressionally authorized in 1992 and sought to replace the straight constructed channel with a 40-mile meandering one more similar to the original geomorphology, backfilling of 22 miles of canal, recarving 10 miles of river, and removing control structures that segmented the lower reaches of the river (Figure 4-26). The first phase of its construction began in 1999, with a 2001 completion date. Two additional phases of the project were completed in 2007 and 2009 (Jones et al., 2014). The final project phase began in 2012 but was recently delayed and is now expected to be completed in 2019.
Of all the projects described in this chapter, the Kissimmee River restoration is probably the most advanced in demonstrating substantial restoration of the natural system, and the long-term monitoring of restoration progress is a useful example for many CERP projects. Jones et al. (2014) and USACE (2012b) report recent insights on the project’s hydrologic and ecological benefits since the committee’s last report:
• The project has met the target of connecting the floodplain to the channel 180 days during WY 2013 at four of the five observation sites.
• Wetland plants are thriving in the floodplain (see Figure 4-27), including pickerelweed, arrowhead, Carolina willow, and buttonbush.
• Dissolved oxygen has met the targets for mean concentrations in the 2012-2013 year, and the dissolved oxygen concentration target of 2.0 mg/L was met almost 90 percent of the time.
• The total phosphorus load into Lake Okeechobee remained virtually unchanged.
• Native largemouth bass and various native sunfishes now make up 63 percent of the fish community; prior to restoration, they represented only 38 percent.
• Organic deposits on the river bottom decreased by 71 percent, reestablishing sand bars and providing new habitat for shorebirds and invertebrates, including native clams.
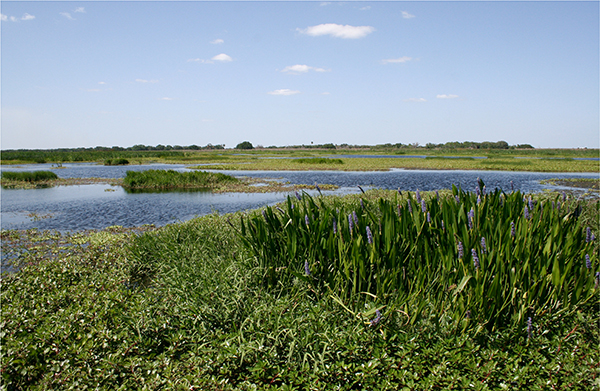
FIGURE 4-27 A functional wetland restored to an area that once was a pasture on the floodplain of the Kissimmee River.
SOURCE: Lawrence Glenn, SFWMD.
• Eight shorebird species, absent before restoration, have returned to the river and floodplain, including breeding black-necked stilts.
• The 3-year running average for wading bird abundance was above the target of 30.6 birds per square kilometer, although the target was missed during WY 2013.
• Waterfowl abundance was more than double the target WY 2012 and WY 2013.
The Kissimmee River restoration has made substantial construction progress that has already resulted in measureable natural system benefits, and even more benefits are anticipated once final control structures are finished and changes to the water control schedule are implemented. Several project features that remain to be completed include additional canal filling, removal of S-65C, and construction of the S-69 weir. The agreement on a water control schedule for the headwaters areas will also institute a more natural flow regime in the river with additional natural system benefits.
Restoration progress on the Kissimmee River restoration (and the C-111 South Dade project) had been delayed for about 2 years by cost-sharing issues between the SFWMD and the USACE. However, in April 2014 the agencies reached agreement on the issues that separated them, and construction is now set to move forward (USACE, 2014). These issues and their resolution continue a record of solving management issues through interagency negotiation that requires time (and delays), but that allows the project to eventually move forward with full support of both partners.
Seminole Big Cypress Reservation Water Conservation Plan Critical Project
The Seminole Big Cypress Reservation Water Conservation Plan Critical Project (Big Cypress Project, authorized by the 1996 WRDA) is a non-CERP project focused on the Seminole Big Cypress Reservation located near the northwest corner of WCA-3A. The project was intended to address water quality issues in agricultural runoff on the reservation, enhance water storage, and thereby improve conditions for native vegetation on the reservation (USACE and SFWMD, 2013d). The project included construction of new water storage areas designed to capture stormwater discharges, a series of culverts and canals, and 24 pump stations. The Big Cypress Project addresses the quality of water flowing eastward from the Seminole Reservation into the Everglades ecosystem in WCA-3A and the Miccosukee lands (USACE, 2012d; Figure 4-28). The project also provides additional water to rehydrate wetlands in the northern portion of the Big Cypress National Preserve.
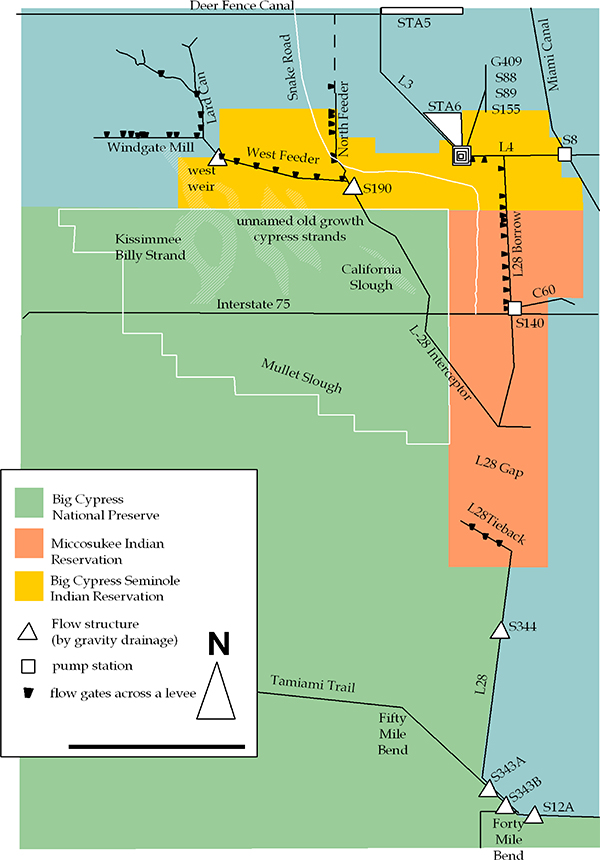
FIGURE 4-28 The Western Glades and the L-28 levee system at the northwest corner of WCA-3A.
SOURCE: Florida Gulf Coast University, http://www.fgcu.edu/bcw/Restore/History/History_L28.htm.
Construction of the Phase 1 conveyance canal system was completed in 2003. Phase 2 of this project has been divided into four basins north of the West Feeder Canal (Figure 4-28). In 2008 the USACE completed construction of the largest basin, Basin 1, which was transferred to the tribe for operations and maintenance in 2010. The basin has failed to perform as designed, which necessitated design modifications for the other three basins (SFERTF, 2012). Construction of Basin 4 was completed in 2013, and Basin 2 is currently under construction (USACE, 2014d). After tribal frustrations over the poor performance of Basin 1, federal, state, and tribal leaders held multiple meetings in 2013 in efforts to resolve these technical issues, and that process is ongoing.
CONCLUSIONS AND RECOMMENDATIONS
The infrequency of Water Resources Development Acts (WRDAs) has impeded CERP progress over the past 2 years. Seven years have elapsed since the last WRDA was passed, and four Generation 2 CERP projects with approved project plans awaited congressional authorization between 2012 and June 2014 when WRRDA 2014 was signed into law. Additionally, two of the previously authorized CERP projects require reauthorization due to cost escalations; thus, prior to WRRDA 2014, only one CERP project—Indian River Lagoon-South—was eligible for sizeable (>$25 million) construction funding. With the passage of WRRDA 2014, four additional projects are able to proceed with federal funding, although the Central Everglades Planning Project was not completed in time to be included. Lack of authorizations also had important implications for the cost-sharing balance, discussed below.
Availability of funding also impeded CERP progress in the past 2 years. State CERP expenditures have declined substantially in recent years, because of reduced SFWMD revenues and the need to fund non-CERP water quality projects to meet a 2012 Consent Order. Even though the state has spent significantly more than the federal government on the CERP since its inception, the state has been precariously close to the mandated 50-50 cost-sharing requirement because, prior to WRRDA 2014, land acquisition and construction expenditures could only be credited for the four congressionally authorized Generation 1 projects. Declining state funding for CERP projects over the past 2 years has contributed to cost-sharing challenges, and as of September 2013, the state’s “creditable expenditures” exceeded those of the federal government by only $98 million. As a result, the federal government significantly reduced spending in FY 2014 so as not to exceed the 50-50 cost share. Passage of WRRDA 2014 could allow the state to realize approximately $400 million in additional cost-sharing credits for prior spending, thereby easing an impending constraint on federal contributions toward the CERP.
CERP planners need to revisit the Integrated Delivery Schedule with a renewed urgency to advance projects with the greatest potential to avert ongoing ecosystem degradation and those that promise the largest restoration benefits. The current draft Integrated Delivery Schedule has not been updated since 2011, and difficult decisions will need to be made to integrate the four Generation 2 CERP projects and the Central Everglades Planning Project (and related project dependencies) with existing CERP and non-CERP efforts. To expedite Everglades restoration amid limited funding, all authorized projects cannot be advanced equally. Some projects may be more beneficial in light of climate change and sea-level rise and others less so, and these factors should be considered in the prioritization of restoration funding.
The restoration progress made by CERP projects to date remains fairly modest in scope. Ecosystem responses have been detected after phased implementation in the Picayune Strand, Biscayne Bay Coastal Wetlands, and C-111 Spreader Canal projects, although many of these improvements are limited. In some cases, such as Biscayne Bay, the scope of the restoration increment to date is simply so limited in area that ecological responses are equally small. In other cases, such as Picayune Strand, additional time may be needed to achieve full ecosystem responses to the restoration measures in place. Taylor Slough has seen significant hydrologic improvements due to restoration efforts, but the documented benefits to date are primarily derived from the C-111 South Dade Project, a non-CERP project. For all three of these projects, ecological responses would be expected to increase with construction and operation of additional project increments as well as additional time for ecosystem recovery.
Several non-CERP projects have faced bureaucratic and policy issues that hindered implementation progress. Agency disagreements about cost-sharing arrangements and legal requirements affected progress on the Kissimmee River Restoration and the C-111 South Dade project by delaying them for almost 2 years. However, the SFWMD and the USACE have made important progress to resolve these differences, and resume construction. Meanwhile, water quality compliance issues and the lack of an operational plan are preventing realization of restoration benefits in the Mod Waters project. Scientific knowledge is adequate for success, and engineering problems in construction and operation appear not to be impeding restoration progress. These non-CERP foundation projects offer large potential restoration benefits once fully implemented. Renewed attention is needed to resolve the remaining bureaucratic challenges to expedite restoration progress and realize the ecological returns from substantial financial investments to date.
STA performance shows signs of improvement under recent management. Long-term sustainable performance, however, will be directly influenced by loading rates. Additional treatment area and flow equalization basins in the
Restoration Strategies project are likely to further reduce loading rates and outflow concentrations. Continued adaptive management, including implementation of new strategies developed through ongoing research, is needed to meet water quality standards and maintain sustained performance of these treatment systems.


