
Appendix A
Overview of Methodological Approaches, Data Sources, and Survey Tools
This report on the Small Business Innovation Research (SBIR) program at the Department of Defense (DoD), is a part of a series of reports on SBIR at the National Institutes of Health (NIH), National Aeronautics and Space Administration (NASA), Department of Energy (DoE), and National Science Foundation (NSF). Collectively, they represent a second-round assessment of the program by the National Research Council (NRC).
The first-round assessment, conducted under a separate ad hoc committee, resulted in a series of reports released from 2004 to 2009, including a framework methodology for that study and on which the current methodology builds.1 Thus, as in the first-round study, the objective of this second round study is “not to consider if SBIR should exist or not”—Congress has already decided affirmatively on this question, most recently in the 2011 reauthorization of the program.2 “Rather, the NRC Committee conducting this study is charged with “providing assessmentǦbased findings of the benefits and costs of SBIR … to improve public understanding of the program, as well as recommendations to improve the program’s effectiveness.” As with the first-round, this study “will not seek to compare the value of one area with other areas; this task is the prerogative of the Congress and the Administration acting through the agencies. Instead, the study is concerned with the effective review of each area.”
These areas refer to the four legislative objectives of the SBIR program:3
__________________
1National Research Council, An Assessment of the Small Business Innovation Research Program: Project Methodology, Washington, DC: The National Academies Press, 2004.
2National Defense Authorization Act of 2012 (NDAA) HR.1540, Title LI.
3The most current description of these legislative objectives is in the Policy Guidance provided by SBA to the agencies. SBA Section 1.(c) SBIR Policy Directive, October 18, 2012, p. 3.
- Commercialize government-funded research
- Expand the U.S. technical knowledge base
- Improve the participation of women and minorities
- Support agency missions
The SBIR program, on the basis of highly competitive solicitations, provides modest initial funding for selected Phase I projects (up to $150,000) for feasibility testing and further Phase II funding (up to $1 million) for about one-half of Phase I projects.
From a methodology perspective, assessing this program presents formidable challenges. Among the more difficult are the following:
- Lack of data. Only DoD and NSF track outcomes data, and DoD’s tracking is insufficient for careful analysis. There are no systematic efforts by agencies to collect feedback from awardees. No systematic efforts have addressed qualitative data.
- Intervening variables. Analysis of small businesses suggests that they are often very path dependent and, hence, can be deflected from a given development path by a wide range of positive and negative variables. A single breakthrough contract—or technical delay—can make or break a company.
- Lags. Not only do outcomes lag awards by a number of years, but also the lag itself is highly variable. Some companies commercialize within 6 months of award conclusion; others take decades. And often the biggest impacts take many years to peak even after products have reached markets.
ESTABLISHING A METHODOLOGY
The methodology utilized in this second-round study of the SBIR program builds on the methodology established by the NRC committee that completed the first-round study.
Publication of the 2004 Methodology
The committee that undertook the first-round study and the agencies under study formally acknowledged the difficulties involved in assessing SBIR programs. Accordingly, that study began with development of the formal volume on methodology, which was published in 2004 after completing the standard National Academies peer-review process.4
__________________
4National Research Council, An Assessment of the Small Business Innovation Research Program: Project Methodology, op. cit., p. 2.
The established methodology stressed the importance of adopting a varied range of tools, which meshes with the methodology originally defined by the study committee to include a broad range of tools, based on prior work in this area. The committee concluded that appropriate methodological approaches
build from the precedents established in several key studies already undertaken to evaluate various aspects of the SBIR. These studies have been successful because they identified the need for utilizing not just a single methodological approach, but rather a broad spectrum of approaches, in order to evaluate the SBIR from a number of different perspectives and criteria.
This diversity and flexibility in methodological approach are particularly appropriate given the heterogeneity of goals and procedures across the five agencies involved in the evaluation. Consequently, this document suggests a broad framework for methodological approaches that can serve to guide the research team when evaluating each particular agency in terms of the four criteria stated above. [Table APP A-1] illustrates some key assessment parameters and related measures to be considered in this study.5
The tools identified in the illustration above include many of those used by the NRC committee conducting the first-round study of the SBIR program. Other tools emerged since the initial methodology review.
Tools Utilized in the Current SBIR Study
Quantitative and qualitative tools being utilized in the current study of the SBIR program include the following:
- Case studies. The committee commissioned in-depth case studies of 20 SBIR recipients at DoD. These companies are geographically diverse, demographically diverse, funded by several different components at DoD, and at different stages of the company lifecycle.
- Workshops. The committee convened a number of workshops to allow stakeholders, agency staff, and academic experts to provide unique insights into the program’s operations, as well as to identify questions that need to be addressed.
- Analysis of agency data. A range of datasets covering various aspects of agency SBIR activities were obtained from DoD or DoD components. The committee has analyzed and included these data as appropriate.
__________________
5National Research Council, An Assessment of the Small Business Innovation Research Program: Project Methodology, op. cit., p. 2.
TABLE APP A-1 Overview of Approach to SBIR Program Assessment
| SBIR Assessment Parameters → |
Quality of Research | Commercialization of SBIR Funded Research/Economic and Non-economic Benefits | Small Business Innovation/Growth | Use of Small Businesses to Advance Agency Missions |
| Questions | How does the quality of SBIR funded research compare with that of other government funded R&D? | What is the overall economic impact of SBIR funded research? What fraction of that impact is attributable to SBIR funding? | How to broaden participation and replenish contractors? What is the link between SBIR and state/regional programs? | How to increase agency uptake while continuing to support high risk research |
| Measures | Peer review scores, Publication counts, Citation analysis | Sales; follow up funding; progress; IPO | Patent counts and other IP/employment growth, number of new technology firms | Agency procurement of products resulting from SBIR work |
| Tools | Case studies, agency program studies, study of repeat winners, bibliometric analysis | Phase II surveys, program manager surveys, case studies, study of repeat winners | Phase I and Phase II surveys, case studies, study of repeat winners, bibliometric analysis | Program manager surveys, case studies, agency program studies, study of repeat winners |
| Key Research Challenges | Difficulty of measuring quality and of identifying proper reference group | Skew of returns; significant interagency and inter-industry differences | Measures of actual success and failure at the project and firm level; relationship of federal and state programs in this context | Major interagency differences in use of SBIR to meet agency missions |
NOTE: Supplementary tools may be developed and used as needed.
SOURCE: National Research Council, An Assessment of the Small Business Innovation Research Program: Project Methodology, Washington, DC: The National Academies Press, 2004, Table 1, p. 3.
- Open-ended responses from SBIR recipients. For the first time, the committee solicited textual responses in the context of the 2011 survey, drawing more than 700 observations by firms on the SBIR program.
- Agency interviews. Agency staff were consulted on the operation of the SBIR program, and most were helpful in providing information both about the program and about the challenges that they faced.
- Literature review. In the time period since the start of NRC research in this area, a number of papers have been published addressing various aspects of the SBIR program. In addition, other organizations, such as the Government Accountability Office (GAO), have reviewed particular parts of the SBIR program. We have referenced these works in the course of this analysis.
Taken together with our committee deliberations and the expertise brought to bear by individual committee members, these tools provide the primary inputs into the analysis.
We would stress that, for the first-round study and for our current study, multiple research methodologies feed into every finding and recommendation. No findings or recommendations rest solely on data and analysis from NRC surveys; conversely, data from the survey are used to support analysis throughout the report.
COMMERCIALIZATION METRICS AND DATA COLLECTION
Recent Congressional interest in the DoD SBIR program has reflected strong interest in the commercialization of technologies funded through SBIR. This enhanced focus is understandable: the investment made should be reflected in outcomes approved by Congress.
However, no simple definition of “commercialization” exists.6 Broadly speaking, it means funding for technology development beyond that provided under Phase II SBIR funding. Given the diversity of components within DoD, it is not surprising that there is considerable variation in the definition of commercialization and in the collection of data that can be used for assessment and measurement.
While all of the components measure “transition,” it is not clear that this means the same thing across DoD. Possible meanings and elements include the following:
- issuance of a certified Phase III contract by a Service or DoD agency (collectively “components”) directly to the small firm;
- adoption of a technology by a program of record (Air Force [AF] simply counts technologies that are flown on AF aircraft);
__________________
6See Chapter 4 for related analysis of commercialization in the SBIR program.
- utilization of a technology in weapons systems that are delivered to the war fighter;
- licensing of technologies to prime contractors (primes) and other parties serving DoD components;
- sale of products and services to primes for use on DoD systems (this may or may not include sale of data rights); and
- any sale of goods or services derived from SBIR-funded technologies, to DoD or to other purchases, including the U.S. private sector, other U.S.-based government agencies, and foreign buyers.
Different kinds of commercialization are recorded and reported differently as well. Figure A-1 shows the different kinds of commercialization and the data sources that can be used to track them. Numbers in the figure are as follows:
- All commercialization: including both DoD-related and private-sector sales and licensing.
- All DoD-related commercialization: including sales and licensing revenues generated from either DoD directly or through primes to DoD.
- DoD-only sales and revenues: from small business directly to the DoD (excludes sales through primes).
- Defense-related sales to the primes only: excluding DoD-direct sales.
- Non-DoD related sales: including all sales in the U.S. private sector and all exports (to both public- and private-sector entities abroad). These sales may be in the defense sector but not to DoD or the primes.
- DoD Phase III contracts: This box represents all the DoD sales resulting from SBIR awards that should be designated as Phase III contracts. However, Phase III currently only rarely covers downstream impacts of SBIR awards beyond the first Phase III contract.
- DoD-sales correctly certified as Phase III: this is the share of all Phase III sales that are correctly entered into the Federal Procurement Data System (FPDS).
- Exports: part of non-DoD commercialization.
Challenges in Tracking Commercialization
The nested boxes in Figure A-1 indicate something of the scale and complexity of the challenges involved in accurately tracking commercialization. So it is useful to break the tracking issue into three broad components:
- within DoD;
- in the DoD primes; and
- all remaining commercialization.
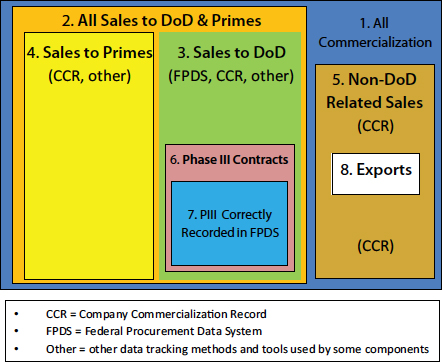
FIGURE A-1 Accounting for commercialization in the DoD SBIR program.
SOURCE: Committee-generated.
Tracking Commercialization Within DoD
The Federal Procurement Data System (FPDS) is the primary tool for tracking commercialization within DoD. FPDS is designed to contain all federal contracts, including all SBIR contracts and all subsequent direct contracts between the federal government and small businesses.7,8
All federal contracts for more than $3,000 must be entered into the FPDS.9 However, while Phase I and Phase II contracts are almost always entered accurately as SBIR contracts, that is not the case for Phase III.
__________________
7Information about DoD use of FPDS is drawn from <http://www.acq.osd.mil/dpap/pdi/eb/federal_procurement_data_system__next_generation_fpds-ng.html>, accessed July 3, 2013, and from interviews with Navy SBIR staff and with the Navy civilian FPDS contractor.
8Detailed information about FPDS is contained in the FPDS-NG User Manual, <http://www.fpds-ng.com/wiki/index.php/FPDS-NG_User_Manual>, accessed July 3, 2013.
9GAO FPDS-Next Generation FAQ, <https://www.fpds.gov/wiki/index2.php/FPDSNG_FAQ>, accessed July 7, 2013.
Interviews with senior Services SBIR staff confirm that Contracting Officers (COs) do not always recognize that a follow-on SBIR contract with a small firm is a “Phase III contract” and hence do not mark the contract as such in FPDS.
In October 2012, the DoD Inspector General (IG) office reported that SBIR and Small Business Technology Transfer (STTR) awards were often incorrectly labeled under the requirements for effective competition; the report stated that SBIR and STTR awards should be viewed as having been competed, but that they were often not marked as such in the FPDS by contracting officers.10 As a result, SBIR Phase III contracts are not completely reflected in FPDS, and hence that data and analysis based on FPDS systematically undercount the impact of SBIR transitions within DoD.
Some components have tried to address this problem. In Navy, a civilian contractor has been assigned full time to work with FPDS. The contractor double-checks to ensure that all Phase III contracts with DoD are marked as such in FPDS. So far as can be determined, none of the other DoD components uses a full-time contractor or staff member for this purpose. Because the Navy process consistently finds errors, it seems very likely that an unknown number of SBIR Phase III contracts at other components go unrecorded as such. No estimate is available for the amount of under-reporting that can be attributed to this problem.
There is a second and perhaps more important difficulty in tracking commercialization within DoD itself: the limits of Phase III certification. Phase III certification typically covers only the first contract after the end of Phase II. In some cases, Phase III certification extends beyond the first contract, but that does not appear to be typical. For many technologies, this first Phase III contract is only the start of a long journey for the company and the technology. For the most successful technologies, subsequent contracts may cover thousands of units and tens of millions of dollars. This extensive commercialization is not recorded through FPDS. In some ways this is understandable, because there is no obvious way for contracting officers to certify the original sources of complex technologies. Yet as a result, the long-term impact of SBIR awards eludes capture in FPDS.
The DoD Acquisitions Desk Reference defines Phase III as follows:
SBIR Phase III refers to work that derives from, extends, or logically concludes effort(s) performed under prior SBIR funding agreements, but is funded by sources other than the SBIR Program. Phase III work is typically oriented towards commercialization of SBIR research or technology.
1. Each of the following types of activity constitutes SBIR Phase III work:
__________________
10DoD IG Report, DODIG-2013-002, “Improvement Needed With DoD Single-Bid Program to Increase Effective Competition for Contracts,” October 4, 2012, p. 12.
i. commercial application of SBIR-funded R/R&D financed by non-Federal sources of capital (Note: The guidance in this Policy Directive regarding SBIR Phase III pertains to the non-SBIR federally-funded work described in (ii) and (iii) below. It does not address the nature of private agreements the SBIR firm may make in the commercialization of its technology.);
ii. SBIR-derived products or services intended for use by the Federal Government, funded by non-SBIR sources of Federal funding;
iii. continuation of R/R&D that has been competitively selected using peer review or scientific review criteria, funded by non-SBIR Federal funding sources.11
Although in principle there is no time limit on Phase III certified technologies—and the Small Business Administration (SBA) Policy Guidance document makes this clear—in practice DoD struggles even to make the link between Phase II and the first Phase III contract. There appears to be no standard process in place at any component to help small businesses ensure that subsequent contracts are also certified as Phase III.
Tracking Through the Primes—The Importance of the Company Commercialization Record (CCR)
Once beyond DoD itself, the ability to track commercialization declines substantially. FPDS no longer applies because primes are not required to enter subcontracts into FPDS. As the Air Force (AF) SBIR program manager said, “We have no vision into private-sector transactions between small businesses and prime contractors.”12 Primes are not required to identify or to track SBIR award contracts. There are indeed currently no incentives to do so, and some significant incentives not to.
Primes are sometimes required to meet contracting goals focused on small businesses, among other demographics.13 However, there is no separate breakout for SBIR contracts. It is doubtful whether the primes themselves track SBIR-related contracts. According to Navy staff, one—but only one—of the primes that serve Navy maintains a database of SBIR-related subcontracts.
__________________
11DoD Acquisitions Desk References, Annex A, Section 3, “Definitions,” <http://www.acq.osd.mil/osbp/sbir/sb/resources/deskreference/annex_a.shtml#Target3>, accessed July 9, 2013.
12Interview with David Sikora and Richard Flake, June 28, 2013.
13In fiscal year (FY)2012, the target for small business subcontracts at DoD was 36.7 percent of total contract value. See DoD Office of Small Business Programs, “Small Business Goal and Objectives,” <http://www.acq.osd.mil/osbp/about/sbProgramGoals.shtml>, accessed July 9, 2013.
Some other primes appear to be actively hostile to the notion of tracking and including SBIR-based technologies.14
The data rights attached to SBIR-based technologies provide a substantial disincentive for primes to track and identify Phase III commercialization. Technologies certified as SBIR bestow significant data rights on their owners, which may mean that small businesses have substantially more leverage in negotiations with primes.
In the Navy system commands with the deepest commitment to tracking SBIR outcomes, program managers readily admit that they have very limited capacity to track outcomes through the primes. It appears that primes account for a considerable—though uncountable—share of overall commercialization. Estimates from Navy staff at different program executive offices (PEOs) suggested that this share ranges from 25 percent to 50 percent.
Data from both the current and the previous (2005) NRC survey indicate that about 60 percent of Phase II respondents with sales generated revenues either directly to DoD or to DoD primes. Of these, about two-thirds of revenues came directly from DoD, and one-third through the primes. So FPDS misses the approximately one-third of the overall sales made by SBIR companies that through the primes.
Sales and revenues from the primes are collected through the Company Commercialization Record (CCR) (see Box A-1). CCR was introduced in the early 2000s precisely to capture more of the company’s commercialization activities, beyond direct DoD contracts. It is the only DoD-wide activity to do so.
However, CCR has some important weaknesses. It is entirely self-reported. Although the contractor managing the database seeks to cross-check reported sales above a benchmark amount, no systematic cross-checks are made between reported sales and FPDS or other data sources. In addition, although companies must sign off on their CCR reports under penalty of perjury, there are nonetheless incentives that would encourage firms to overstate their commercial results: CCR scores are sometimes taken into account in determining funding for subsequent projects, and very low scores are expected to exclude companies from the program altogether. However, it is also fair to say that the inherently fuzzy nature of commercialization reporting allows considerable room for leeway, so companies can interpret commercialization results in the most positive light.
On the other hand, updating CCR is a burden, and it is not clear how comprehensive this process has been: firms that have stopped applying for SBIR funding, have graduated from the program, or have been acquired have no incentive to participate. As a result—as with other data sources—the depth and the completeness of the information captured declines over time. It does not appear that DoD has conducted any recent analysis that would help to determine
__________________
14Interview with Dean Putnam, NAVSEA SBIR Program Manager, June 25, 2013.
BOX A-1
Company Commercialization Record (CCR)
Every company receiving an SBIR award from DoD becomes contractually obligated to enter subsequent outcomes data into CCR. Companies are contractually required to update this information for a period of 5 years after the end of the Phase II contract.
DoD has limited sanctions against firms that do not provide the required updates. These firms are not allowed to receive any subsequent SBIR awards until they have updated their CCR information. Note that this information must be updated for every previous SBIR award. For some companies, this means updating information on dozens of previous awards every year.
CCR is maintained by a DoD contractor. According to DoD, efforts are made to verify the largest reported commercialization contracts by contacting the firm directly. Firms are also required to enter the contract number for each claimed commercialization contract within DoD. An additional field requires that the firm enter information about the program of record into which the technology is being inserted.
CCR provides information about awards made at other agencies as well, to the extent that firms receiving awards at DoD also received awards at other agencies. Estimates from the contractor suggest considerable overlap with awards at the National Aeronautics and Space Administration (NASA) and to a lesser degree at the Department of Energy (DoE) and the National Science Foundation (NSF). There is minimal overlap with awards at the National Institutes of Health (NIH) in each case. Each DoD awardee is required to report commercialization information about its awards at other agencies as well. It does not appear that other agencies utilize the information collected about commercialization in the CCR database.
CCR data are aggregated, that is, when a company updates a record, all previous data are expunged. This means that the data are not directly compatible with the fiscal year (FY) data collected through FPDS. In addition, there is no automatic linkage between FPDS, the applications and awards datasets, CCR, and DoD topics. This makes it difficult to integrate the data from these multiple sources and to extract relevant information for comprehensive tracking.
____________________________
SOURCE: Interviews with BRTRC and Navy staff, June 2013.
the extent to which CCR continues to provide useful and important information, or indeed whether the burden on companies should be changed.
Yet despite these weaknesses, CCR remains the only systematic source of information about SBIR commercialization outside FPDS. Therefore not only
is it the best source of information about commercialization through the primes, but also it provides a view into commercialization within DoD beyond Phase III and outside DoD.
Unfortunately, perhaps as a result of resource constraints, very little appears to have been done in terms of utilizing CCR results for assessing commercialization. Although Navy has been comparing commercialization outcomes between Program Executive Offices (PEO) for a number of years, using both the Federal Procurement Data System (FPDS) and the Company Commercialization Record (CCR), this has not been the case at other Services or apparently at Office of Small Business Program.
The existence of these different outcome metrics makes it possible at least in theory to compare SBIR-related outcomes across different Services, different topics, different sponsoring organizations, different primes, and indeed different types of technologies. Perhaps now that the additional administrative resources are available, these opportunities to understand how different variables affect program success will be exploited more fully.
Other Tracking Tools
Some components have developed additional tools for tracking outcomes. Although mostly focused on ensuring that the award process runs smoothly, the Navy program managers’ database does allow program managers to track contracts that they know about.15 According to the Navy SBIR Program Office,
The purpose of this Database is to provide principal support for execution, management and monitoring of the Navy’s SBIR/STTR program. The Database is a continuously refreshed repository of data regarding topics, topic generation, and solicitation development; proposal acceptance and maintenance, and evaluation system design; award tracking and reporting; budget planning, monitoring and reporting; computer hardware, software and license maintenance for web and database components; and provision of program technical and administrative support. It includes tools that facilitate the analysis and reporting of program statistics and trends, which support the design and development of program improvement strategies and efforts.16
The Navy program managers’ database is thus a well-developed tool for helping those responsible for various aspects of SBIR manage the program at Navy. It is not, however, primarily designed for tracking outcomes; to the extent that it does so, it relies primarily on data from FPDS. Some program managers—for example, at the PEO Integrated Warfare Systems (IWS)—also maintain their own database and indeed devote considerable resources to
__________________
15Private communication, July 11, 2013.
16Navy SBIR program support staff, private communication.
consistently populating it. IWS tasks a junior staffer to call SBIR recipients on a regular basis after the end of their Phase II contract to determine whether there has been further commercialization, which is then tracked in the IWS database.17 This intensive data-gathering approach is similar to that adopted in the past at NSF.18
Why New Data Sources Are Needed
Congress often seeks evidence about the effectiveness of programs or indeed about whether they work at all. This interest has in the past helped to drive the development of tools such as CCR. However, in the long term the importance of tracking lies in its use to support program management. By carefully analyzing outcomes and CCR’s associated program variables, program managers will be able to manage more successfully.
We have seen significant limitations to all of the available data sources. FPDS captures a limited dataset, and even that is not accurate especially with regard to Phase III. CCR is self-reported and subject to a range of conflicting incentives and its own additional limitations. It is also an aggregate measure, not an FY measure, and hence is not compatible with FPDS. In addition, DoD does not make data from CCR and from FPDS available for review, at least not at the disaggregated level necessary for detailed statistical analysis.
OVERVIEW OF THE NRC SURVEY
Our analysis of the SBIR program at DoD makes use of case studies, interviews, and other qualitative methods of assessment. These remain important components of our overall methodology, and a chapter in this report is devoted to lessons drawn from case studies. But qualitative assessment alone is insufficient.
The Role of the NRC Survey
The NRC survey offers some significant advantages over other data sources. It—
- covers all kinds of commercialization inside and outside of DoD;
- provides a rich source of textual information in response to open-ended questions;
- permits some quantitative analysis based on the development of a comparison group, even though the comparison group has limitations;
- probes more deeply into company demographics and agency processes;
__________________
17Douglas Marker, SBIR Program Manager, IWS, presentation to NRC, June 25, 2013.
18See National Research Council, An Assessment of the SBIR Program at the National Science Foundation, Washington, DC: The National Academies Press, 2008, Table 5.2-12.
- addresses principal investigators (PIs), not just company business officials;
- allows comparisons with previous data-collection exercises; and
- addresses other Congressional objectives for the program beyond commercialization.
At the same time, however, we are fully cognizant of the limitations of this type of observational survey research in this case. To address these issues while retaining the utility and indeed explanatory power of survey-based methodology, this report contextualizes the data by comparing results to those from the NRC survey conducted as part of the first-round assessment of the SBIR program (referred to below as the “2005 NRC Survey”19). This report also adds transparency by publishing the number of responses for each question and indeed each subgroup, thus allowing readers to draw their own conclusions about the power of the statistical conclusions being drawn.
We contracted with Grunwald Associates LLC to administer a survey to DoD award recipients.20 This survey is built closely on the 2005 NRC survey but is also adapted to lessons learned and includes some important changes discussed in detail below. A methodology subgroup of the committee was charged with reviewing the survey and the reported results for best practice and accuracy. The survey was carried out simultaneously to a survey focused on the SBIR programs at NSF and NASA.21
The primary objectives of the survey were as follows:
- Provide an update of the program “snapshot” taken in 2005, maximizing the opportunity to identify trends within the program;
- Probe more deeply into program processes, with the help of expanded feedback from participants and better understanding of program demographics;
- Improve the utility of the survey by including a comparison group; and
__________________
19The survey conducted as part of the current, second-round assessment of the SBIR program is referred to below as the “2011 NRC Survey” or simply the “survey.” In general, throughout the report, any survey references are understood to be to the 2011 NRC Survey unless specifically noted otherwise.
20Grunwald Associates LLC is a research and consulting firm located in Bethesda, Md. The firm specializes in assignments that require an in-depth understanding of multiple market segments, and is experienced in deploying state-of-the-art research methodologies. Grunwald Associates has conducted the annual PBS Survey on Educational Technology and Media for eight years. Grunwald Associates is also one of the core partners on the U.S. Department of Education’s Connected Online Communities of Practice initiative, and works with clients such as the National Park Service, AT&T, Adobe, Microsoft, and smaller companies.
21Delays at NIH and DoE in contracting with the NRC combined with the need to complete work contracted with DoD NSF and NASA led the Committee to proceed with the survey at three agencies only.
BOX A-2
Multiple Sources of Bias in Survey Responsea
Large innovation surveys involve multiple sources of potential bias that can skew the results in different directions. Some potential survey biases are noted below.
- Successful and more recently funded firms more likely to respond. Research by Link and Scott demonstrates that the probability of obtaining research project information by survey decreases for less recently funded projects, and it increases the greater the award amount.b Nearly 75 percent of Phase II respondents to the 2011 NRC Survey received awards after 2003, largely because winners from more distant years are more difficult to reach: small businesses regularly cease operations, are acquired, merge, or lose staff with knowledge of SBIR awards. This may skew commercialization results downward, because more recent awards will be less likely to have completed the commercialization phase.
- Non-respondent bias. Very limited information is available about SBIR awardees: company name, location, and contact information for the PI and the company point of contact, agency name, and date of award (data on woman and minority ownership are not considered reliable). Detailed data is not available on applicants who did not win awards, as the agencies routinely discard failed applications on privacy grounds. DoD rejected NRC efforts to acquire these data, on those grounds. It is therefore not feasible to undertake detailed analysis of non-respondents, but the possibility exists that they would present a different profile than would respondents.
- Success self-reported. Self-reporting can be a source of bias, although the dimensions and direction of that bias are not necessarily clear. In any case, policy analysis has a long history of relying on self-reported performance measures to represent market-based performance measures. Participants in such retrospective analyses are believed to be able to consider a broader set of allocation options, thus making the evaluation more realistic than data based on third-party observation.c In short, company founders and/or PIs are in many cases simply the best source of information available.
- Survey sampled projects from PIs with multiple awards. Projects from PIs with large numbers of awards were under-represented in the sample, because PIs could not be expected to complete a questionnaire for each of numerous awards over a 10-year time frame.
- Failed firms difficult to contact. Survey experts point to an “asymmetry” in the survey’s ability to include failed firms for follow-up surveys in cases where the firms no longer exist.d It is worth noting
-
that one cannot necessarily infer that the SBIR project failed; what is known is only that the firm no longer exists.
- Not all successful projects captured. For similar reasons, the survey could not include ongoing results from successful projects in firms that merged or were acquired before and/or after commercialization of the project’s technology.
- Some firms unwilling to fully acknowledge SBIR contribution to project success. Some firms may be unwilling to acknowledge that they received important benefits from participating in public programs for a variety of reasons. For example, some may understandably attribute success exclusively to their own efforts.
- Commercialization lag. Although the 2005 NRC Survey broke new ground in data collection, the amount of sales made—and indeed the number of projects that generate sales —are inevitably undercounted in a snapshot survey taken at a single point in time. On the basis of successive datasets collected from NIH SBIR award recipients, it is estimated that total sales from all responding projects will be considerably greater than can be captured in a single survey, because technologies continue to generate revenue after the date of the survey, and these positive outcomes are therefore not included in any single survey result.e This underscores the importance of follow-on research based on the now-established survey methodology. Figure Box A-1 illustrates this impact in practice: projects from 2006 onward had not yet completed commercialization as of August 2013.
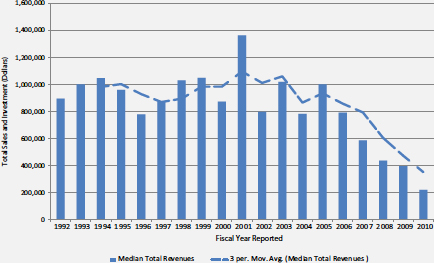
FIGURE Box A-1 The impact of commercialization lag.
SOURCE: DoD Company Commercialization Database.
a The limitations described here are drawn from the methodology outlined for the previous NRC survey in NRC, An Assessment of the SBIR Program at the Department of Defense, Washington, DC: The National Academies Press, 2009.
b A.N. Link and J.T. Scott, Evaluating Public Research Institutions: The U.S. Advanced Technology Program’s Intramural Research Initiative, London: Routledge, 2005.
c While economic theory is formulated on what is called “revealed preferences,” meaning that individuals and companies reveal how they value scarce resources by how they allocate those resources within a market framework, quite often expressed preferences are a better source of information, especially from an evaluation perspective. Strict adherence to a revealed preference paradigm could lead to misguided policy conclusions because the paradigm assumes that all policy choices are known and understood at the time that an individual or firm reveals its preferences and that all relevant markets for such preferences are operational. See (1) G.G. Dess and D.W. Beard, “Dimensions of Organizational Task Environments,” Administrative Science Quarterly, 29: 52-73, 1984; (2) A.N. Link and J.T. Scott, Public Accountability: Evaluating Technology-Based Institutions Norwell, MA: Kluwer Academic Publishers, 1998.
d A.N. Link and J.T. Scott, Evaluating Public Research Institutions: The US Advanced Technology Program’s Intramural, Research Initiative London: Routledge 2005
e Data from the NRC assessment of the SBIR program at NIH indicate that a subsequent survey taken 2 years later would reveal substantial increases in both the percentage of firms reaching the market and in the amount of sales per project. See NRC, An Assessment of the SBIR Program at the National Institutes of Health, Washington, DC: The National Academies Press, 2009.
- Reduce costs and shrink the time required by combining three 2005 survey questionnaires—for the firm, Phase I, and Phase II awards—into a single questionnaire.
Survey Characteristics
In order to ensure maximum comparability for a time series analysis, the survey for the current assessment was based as closely as possible on previous surveys, including the 2005 NRC Survey and the 1992 GAO survey.
Given the limited population of winners, the starting point for consideration was to deploy one questionnaire per successful project. However, we were also aware that the survey imposes burdens on respondents. Given the detailed and hence time-consuming nature of the survey, it would not be appropriate to over-burden potential recipients, some of whom were responsible for many awards over the years.
An additional point of consideration was that this survey was intended to add detail on program operations, rather than the original primary focus on program outcomes. Agency clients were especially interested in probing operations more deeply. We decided that it would be more useful and effective to administer the survey to PIs—the lead researcher on each project—rather than to the registered company point of contact (POC), who in many cases would be an administrator rather than a researcher. This decision was reinforced by DoD’s decision on privacy grounds not to provide company-level access to the DoD commercialization database, which contains current POC information.
The survey was therefore designed to collect the maximum amount of relevant data, consistent with our commitment to minimizing the burden on individual respondents and to maintaining maximum continuity between surveys. Survey questionnaires were to be sent to PIs of all projects that met selection characteristics, with a maximum of two questionnaires per PI.
Based on reviewer feedback about the previous round of assessments, we determined that for purposes of contextualization, comparison groups would be developed that would provide the basis for further statistical analysis.
Key similarities and differences between the 2005 and 2011 NRC surveys are captured in Table A-2.
The 2011 NRC Survey included awards made from FY1998 to FY2007 inclusive. This end date allowed completion of Phase II awards (which nominally fund 2 years of research) and provided a further 2 years for commercialization. This time frame was consistent with the 2005 NRC survey, which surveyed awards from FY1992 to FY2001. It was also consistent with a previous GAO study, published in 1992, which surveyed awards made through 1987.
The aim of setting the overall time frame at 10 years was to reduce the impact of difficulties generating information about older awards, because some companies and PIs may no longer in place and because memories fade over time. Reaching back to awards made in 1998, while ensuring comparability, generated few results from older awards.
Determining the Survey Population
Following the precedent set by both the original GAO study and the first-round NRC study of the SBIR program, we differentiated between the total population of SBIR recipients, the preliminary survey target population, and the effective population for this study, which is the population of respondents that were reachable.
The effective survey population was the denominator for the survey, used to determine both response rates and the limits of statistical precision that are achievable given the number of responses received.
Initial Filters for Potential Recipients
Determining the effective study population required the following steps:
- acquisition of data from the sponsoring agencies (DoD, NSF, and NASA) covering record-level lists of award recipients;
- elimination of records that did not fit the protocol agreed upon by the committee—namely, a maximum of two questionnaires per PI (in cases where PIs received more than two awards, the awards were selected by agency [NASA, NSF, DoD, in that order], then by year [oldest], and finally by random number); and
TABLE A-2 Similarities and Differences: 2005 and 2011 NRC Surveys
|
Item |
2005 NRC Survey | 2011 NRC Survey |
| Respondent selection | ||
|
Focus on Phase II winners |
✓ | ✓ |
|
Inclusion of Phase I winners |
✓ | ✓ |
|
All qualifying awards |
✓ | |
|
Respondent = PI |
✓ | |
|
Respondent = POC |
✓ | |
|
Max number of questionnaires |
<20 | 2 |
| Distribution | ||
|
|
✓ | No |
|
|
✓ | ✓ |
|
Telephone follow-up |
✓ | ✓ |
| Questionnaire | ||
|
Company demographics |
Identical | Identical |
|
Commercialization outcomes |
Identical | Identical |
|
IP outcomes |
Identical | Identical |
|
Women and minority participation |
✓ | ✓ |
|
Additional detail on minorities |
✓ | |
|
Additional detail on PIs |
✓ | |
|
New section on agency staff |
✓ | |
|
New section on company recommendations for SBIR |
✓ | |
|
New section capturing open-ended responses |
✓ | |
| Comparisons and contextualization | ||
|
Comparison group |
✓ | |
|
Use of statistical comparisons between groups |
✓ |
- elimination of records for which there were significant missing data—in particular, where emails and/or contact telephone numbers were absent.
Note that this approach does not directly limit the number of responses from a single firm, only from a single PI. This process of excluding awards either because they did not fit the selection profile or because the agencies did not provide sufficient or current contact information reduced the total award list
provided by the agencies to a preliminary survey population of approximately 15,000 awards.
Secondary Filters to Identify Recipients with Active Contact Information
This nominal population still included many potential respondents whose contact information was complete, but who were no longer associated with the contact information provided and hence effectively unreachable. This is unsurprising given that there is considerable turnover in both the existence of and the personnel working at small businesses and that the survey reaches back 13 years to awards made in FY1998. Recipients may have switched companies, the company may have ceased to exist or been acquired, or telephone and email contacts may have changed, for example. Consequently, two further filters were utilized to help identify the effective survey population.
- First, contacts were eliminated for which the email address bounced twice. Because the survey was delivered via email, the absence of a working email address disqualified the recipient. This eliminated approximately 30 percent of the preliminary population.
- Second, efforts were made to determine whether non-bouncing emails were in fact still operative. Email addresses that did not officially “bounce” (i.e., return to sender) may still in fact not be active. Some email systems are configured to delete unrecognized email without sending a reply; in other cases, email addresses are inactive but not deleted. So a non-bouncing email address did not equal a contactable PI. In order to identify not contactable PIs, we undertook an extensive telephone survey. Telephone calls were made to every awardee in the preliminary survey population at NASA and NSF and to a random sample of 1,000 thousand awardees at DoD. On the basis of responses to the telephone survey, we were able to ascertain that on average 47 percent of the respondents with ostensibly not bouncing email addresses were in fact not contactable.
There was little variation between agencies or between programs in the quality of the lists provided by the agencies, based on these criteria, although there was, not surprisingly, considerable variation between Phase I and Phase II awards, especially for DoD.22
__________________
22The share of preliminary contacts that turned out to be not contactable was higher for this survey than for the previous NRC survey in 2005. We believe this is primarily because company points of contact (POCs) have less churn than do program managers (PMs) (often being senior company executives).
Deployment
The survey opened on October 4, 2011, and was deployed by email, with voice follow-up support. Up to four emails were sent to the effective population (emails discontinued once responses were received). In addition, two voice mails were delivered to non-respondents between the second and third and between the third and fourth rounds of email. In total, up to six efforts were made to reach each questionnaire recipient.
After members of the data subgroup of the committee determined that sufficient responses had been received and that additional efforts to acquire new responses were not likely to be cost effective, the survey was closed on December 19, 2011. The survey was therefore open for a total of 11 weeks.
Response Rates
Standard procedures were followed to conduct the survey. These data collection procedures were designed to increase response to the extent possible within the constraints of a voluntary survey and the survey budget. The population surveyed is a difficult one to contact and obtain responses from as evidence from the literature shows.23 Under these circumstances, the inability to contact and obtain responses always raises questions about potential bias of the estimates that cannot be quantified without substantial extra efforts that would require resources beyond those available for this work.
The lack of detailed applications data from the agency makes it impossible to estimate the possible impact of non-response bias. We, therefore, no have evidence either that non-response bias exists or that it does not. For the areas where the survey overlaps with other data sources - notably DoD's mandatory Company Commercialization database - results from the survey and the DoD data are similar.
Table A-3 shows the response rates at DoD by phase, based on the effective study population after all adjustments. The extent to which a given response rate is sufficient depends entirely on the uses to which the survey is being put and on the degree of statistical precision required. These issues are addressed below. For purposes of comparison, we provide the response rates for the previous survey and for all three agencies surveyed (see Table A-4).
The higher response rates at NSF for 2011 appear to result from extended agency efforts to encourage participation and from a closer focus on
__________________
23Many surveys of entrepreneurial firms have low response rates. For example, Aldrich and Baker (1997) found that nearly a third of surveys of entrepreneurial firms (whose results were reported in the academic literature) had response rates below 25 percent. See Howard E. Aldrich and Ted Baker. 1997. Blinded by the Cites? Has There Been Progress in Entrepreneurship Research? pp. 377-400 in Donald L. Sexton and Raymond W. Smilor (eds.), Entrepreneurship 2000. Chicago: Upstart Publishing Company.
TABLE A-3 Response Rates by Agency, Program, Phase, and Population
| Phases | Number of Responses | Effective Response Rate (Percent) |
| DoD SBIR (all) | 1,170 | 28.5 |
| DoD SBIR I | 390 | 22.6 |
| DoD SBIR II | 780 | 32.8 |
SOURCE: 2011 NRC Survey.
identifying respondents. The higher response rates for Phase I at DoD in 2011 result from more extensive efforts to qualify potential respondents. More current contact data were provided by DoD in 2005, which were not available on privacy grounds in 2011. This may explain the somewhat lower response rate for DoD Phase II respondents in 2011.
Note that all subsequent references to the 2011 NRC Survey in this appendix address only responses for awards made by DoD.
TABLE A-4 Comparing Response Rates for 2005 and 2011
| Phase II 2011 NRC Survey | 2005 NRC Survey | |||||
| Effective Population | Number of Responses | Response Rate (Percent) | Effective Population | Number of Responses | Response Rate (Percent) | |
| DoD | 2,375 | 780 | 32.8 | 2,191 | 920 | 42.0 |
| NSF | 411 | 186 | 45.3 | 336 | 162 | 48.2 |
| NASA | 490 | 179 | 36.5 | 543 | 181 | 33.3 |
| Phase I 2011 NRC Survey | 2005 NRC Survey | |||||
| Effective Population | Number of Responses | Response Rate (Percent) | Effective Population | Number of Responses | Response Rate (Percent) | |
| DoD | 1,728 | 390 | 22.6 | 8,843 | 1,198 | 13.5 |
| NSF | 440 | 207 | 47.0 | 2,270 | 248 | 10.9 |
| NASA | 426 | 119 | 27.9 | 1,659 | 303 | 18.3 |
SOURCES: 2005 NRC Survey and 2011 NRC Survey.
DOD RESPONSES AND RESPONDENTS
Responses by Year of Award
The distribution of responses by year is largely comparable between Phase I and Phase II, except for 2007, which accounts for a much higher percentage of Phase I awards. There were more Phase II awards from 2004 and 2006. Table A-5 shows DoD SBIR responses by year of award.
For both Phase I and Phase II, more responses were received from more recent years. This is not surprising, because it is easier to successfully contact PIs from more recent awards and the probability of survival increases.
Statistical testing indicates that the year of award is significantly different depending on whether the company received a Phase I or Phase II award, at the .05 level of statistical significance.
The survey primarily reached companies that were still in business: overall, 97 percent of respondents indicated that the companies were still in business.24
Effort at Comparison Group Analysis
Several readers of the reports in the first round analysis of SBIR suggested the inclusion of comparison groups in the analysis. There is no simple and easy way to acquire a comparison group for Phase II SBIR awardees. These are technology based companies at an early stage of company development,
TABLE A-5 DoD SBIR Responses by Year of Award
| Year | DoD SBIR Phase I (Percent) | DoD SBIR Phase II (Percent) |
| 2000 or earlier | 3.8 | 2.7 |
| 2001 | 3.8 | 5.6 |
| 2002 | 5.4 | 6.9 |
| 2003 | 7.7 | 10.3 |
| 2004 | 9.0 | 15.2 |
| 2005 | 16.2 | 16.2 |
| 2006 | 16.4 | 22.7 |
| 2007 | 37.7 | 20.3 |
| 100.0 | 100.0 | |
| N= | 390 | 765 |
SOURCE: 2011 NRC Survey.
__________________
242011 NRC Survey, Question 4A.
which have the demonstrated capacity to undertake challenging technical research and to provide evidence that they are potentially successful commercializers. Given that the operations of the SBIR program are defined in legislation and limited by the Policy Guidance provided by SBA, randomly assigned control groups were not a possible alternative. Efforts to identify a pool of SBIR-like companies were made by contacting the most likely sources - Dunn and Bradstreet and Hoovers—but these efforts were not successful, as insufficiently detailed and structured information about companies was available.
In response, we sought to develop a comparison group from among Phase I awardees that had not received a Phase II award from the three surveyed agencies (DoD, NSF, and NASA) during the award period covered by the survey (1999-2008). After considerable review, however, we concluded that the Phase I-only group was also not appropriate for use as a statistical comparison group. In the interests of providing researchers with a full view of the data collected, Appendix G includes tables showing both the Phase I only and Phase II survey responses for questions where both groups were surveyed.


