
Social and Economic Effects of the U.S. Food System
As with the environmental and health indicators discussed in earlier chapters, most social and economic outcomes reflect complex causal processes, and they can vary widely based on time period, spatial organization, market conditions, regulatory forces, and adaptive mechanisms of actors in the system. In this section, we outline major classes of social and economic effects that can be linked to characteristics of the U.S. food system and present summary information about the overall performance of the system. We focus on three broad classes of social and economic effects:
- Levels of income, wealth, and distributional equity;
- Broader indicators of quality of life, such as working conditions, job satisfaction, and freedom of choice to pursue taste and lifestyle preferences; and
- Associated impacts on worker health and well-being.
Affected individuals fall into three groups: (1) people involved directly in agricultural food production (e.g., farmers); (2) people involved in the rest of the food system (e.g., processing, manufacturing, food service, and retailing); and (3) consumers. Food production, processing, and availability also can affect community-level measures, such as economic growth and social infrastructure.
Although social and economic dimensions of effects are distinct, they are more closely interrelated than other dimensions. For this reason, we are presenting them in one chapter. This chapter begins with an overview
of the social and economic impacts of the food system on key sectors of the food system. To discuss these impacts, select data sources and metrics are described. Tables B-1 through B-4 in Appendix B provide more details on these data sources. The committee has focused in this chapter on market-based economic effects, including measurable changes in the financial well-being of key actors in the food system and broader indicators of market performance by sector (e.g., output, efficiency), but it did not attempt to estimate non-market economic values for social impacts. However, a discussion of non-market valuation methods for environmental effects is included in Chapter 4. In addition, while the chapter identifies the importance of capturing differential impacts on distinct social groups (e.g., women, minorities, immigrants), the committee did not review the moral and ethical or legal aspects of different outcomes. Consideration of whether particular types of social and economic effects are better than others should be guided by the best available information about those effects and by the cultural, political, and ethical views of stakeholders and decision makers.
POTENTIAL SOCIAL AND ECONOMIC EFFECTS ON THE FOOD PRODUCTION SECTOR
Income, Wealth, and Distributional Equity
The food production sector includes farmers, ranchers, fishers, hired workers, their family members, and residents in the communities in which these individuals reside (primarily, but not exclusively, rural or small town). Occupations in this sector involve planting, caring for, and harvesting raw food items, livestock, and seafood (FCWA, 2012). About 40 percent of the U.S. land area is used for farming, with 2.1 million farm operations generating nearly $400 billion in sales (55 percent from crops and 45 percent from livestock) and more than $100 billion in net farm income in 2013 (ERS, 2014i; USDA, 2014b).
Taken as a whole, the U.S. farm sector has experienced remarkable growth in output, rising by 2.5 times over the past 60 years (see Figure 5-1). More impressive is the fact that this growth in output has occurred with relatively little increase in the total combined use of factor inputs (capital, labor, purchased inputs) (Wang and Ball, 2014). The increase in output can be attributed mostly to an increase in the quality of labor, capital, and technology inputs. As a result the “factor productivity” (the amount of output per unit of input) of U.S. farming has grown by an average of 1.49 percent per year since 1948 (ERS, 2014a), although it has slowed noticeably during the past 20 years, declining to significantly less than 1 percent over the most recent decade. Declines in the rate of productivity increase have been linked to reductions in agricultural research investments (particularly by the
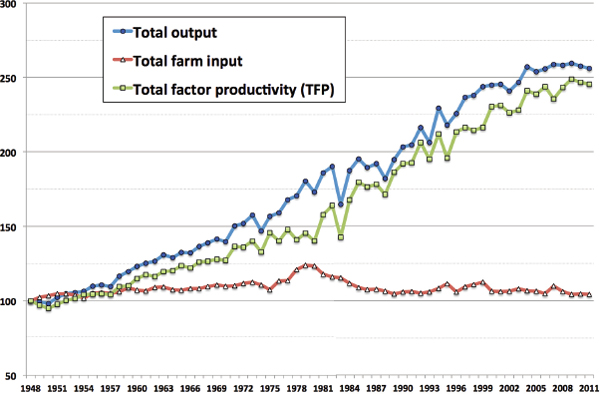
FIGURE 5-1 Indexes of total farm output, input use, and factor productivity in the United States, 1948-2011.
SOURCES: ERS, 2014a; Wang and Ball, 2014.
public sector) and possible biological yield plateaus of major agricultural crops (Alston et al., 2009).
Interestingly, the mix of inputs used to produce growth in food output has changed dramatically since the mid-20th century (see Figure 5-2). Specifically, the use of labor has declined by nearly 80 percent, the use of capital inputs has remained roughly the same (a decrease of 12 percent), and the use of purchased variable inputs has more than doubled. The mix of capital inputs has also shifted, with land inputs slowly declining throughout the past 60 years but the importance of capital equipment growing rapidly through the 1970s, then declining in importance in the latter 20th century. Finally, the use of fertilizer accounts for a significant portion of the increased use of purchased inputs—growing nearly three-fold by the mid-1970s and then remaining at that level (with significant annual fluctuations) through 2011. It appears that the reduced impact in productivity growth from a decline in the use of labor and land inputs has been offset by the positive impact of increased use of other inputs (e.g., technology, computerization, fertilizer, pesticide).
Economic returns and competitiveness in U.S. agriculture are shaped
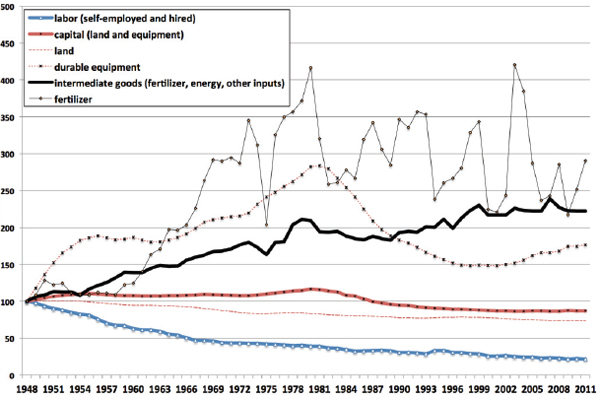
FIGURE 5-2 Index of use of different farm inputs by type in the United States, 1948-2011.
SOURCE: ERS, 2014a.
by heterogeneous public policies that support commodity prices, subsidize crop insurance, promote export markets, and influence labor and environmental practices (see Chapter 2). Public investments in infrastructure for energy, transportation, communication, price information, market coordination, financing opportunities, and tax benefits also shape farm sector performance. Public investments in basic and applied research throughout most of the 20th century have provided high rates of economic return to taxpayers and undergirded a period of rapid technological change and increases in productivity (Fuglie and Heisey, 2007; Kinsey, 2013).
Despite significant increases in total output and factor productivity over this period of time, after adjusting for inflation, aggregate net income in the U.S. farm sector has remained relatively stable over the past 40 years (see Figure 5-3). Because their largest asset is usually land, farm businesses have gained significant wealth over the past 50 years from capital gains associated with rising asset values that increased by 170 percent in real terms between 1960 and 2012.
The distribution of net farm income varies widely by farm type and
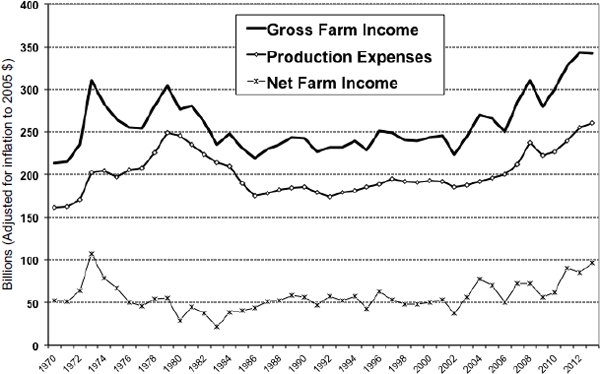
FIGURE 5-3 Inflation-adjusted value of gross farm sales, production expenses, and net farm income, 1970-2013.
SOURCE: ERS, 2014i.
farm size (O’Donoghue et al., 2011). The largest farms in the United States (with gross sales of more than $1 million) represented roughly 4 percent of operations in 2012 but generated about 66 percent of the total market sales of U.S. farm products and accounted for an even larger share of the aggregate total national net farm income in that year (USDA, 2014b).
As a group, farm-operator households have seen their economic well-being rise in recent decades, particularly relative to the average U.S. household (see Figure 5-4) (ERS, 2014b). However, these average statistics for the sector as a whole mask considerable variation among actual farm households and the fact that most farm households rely on off-farm income as the principle basis for household survival (see Figure 5-4). For instance, 57 percent of U.S. farm operations in 2012 had gross farm sales below $10,000, and these operations typically reported net losses from their farming business (USDA, 2014b). Some of these farms are operated as hobbies by urban dwellers who are employed in other occupations and rely on off-farm income (Fernandez-Cornejo, 2007; Hoppe et al., 2010). For farms with less than $250,000 in gross sales, nearly all of the roughly $70,000 gross average household income comes from off-farm employment and
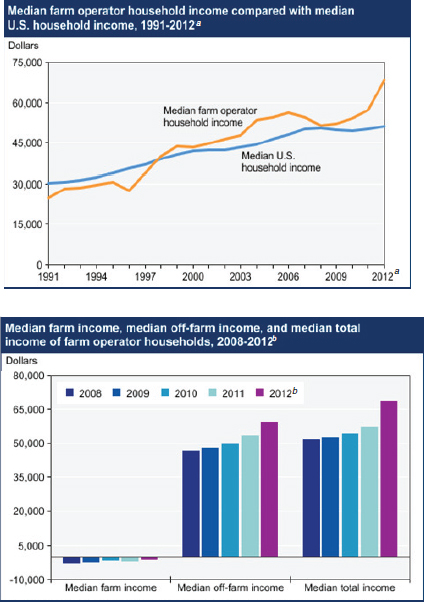
FIGURE 5-4 Farm operator household income and average household income of family farms.
NOTE: Data as of November 26, 2013.
a Differences between 2012 estimates and estimates from prior years reflect changes in survey methodology and implementation associated with the 2012 Agricultural Resource Management Survey in addition to changes in the economic situation of farm households. Source: USDA, Economic Research Service and National Agricultural Statistics Service, Agricultural Resource Management Survey and U.S. Census Bureau, Current Population Survey.
b Differences between 2012 estimates and estimates from prior years reflect changes in survey methodology and implementation associated with the 2012 Agricultural Resource Management Survey in addition to changes in the economic situation of farm households. Source: USDA, Economic Research Service and National Agricultural Statistics Service, Agricultural Resource Management Survey.
SOURCE: ERS, 2014b.
unearned income (Hoppe et al., 2010). In the latest estimates from the U.S. Department of Agriculture (USDA), roughly 60 percent of off-farm income in farm households comes from wages and salary payments to the operator or other adults in the household. Another 20 percent is derived from transfer payments (e.g., Social Security) or interest and dividends on investments. Most of the remaining portion is from non-farm business income (ERS, 2014b). By contrast, among commercial farms with gross sales greater than $350,000, the average farm household in 2012 made more than $200,000 in total income, with nearly 75 percent of this total accounted for by net farm income (ERS, 2014b).
As the U.S. food system has evolved, the overall efficiency and relative economic power of each subsector in the food supply chain has shifted (Marion, 1986; Reardon and Timmer, 2012; Sexton, 2000, 2013). As discussed in Chapter 2 (see Figure 2-5), the farming sector receives an average of 17 percent of the consumer food dollar as gross farm receipts, down from about 40 percent of consumer food spending in 1950 (Schnepf, 2013). The change primarily reflects the pronounced shift toward food consumed away from home (where a higher share of food expenditures cover the cost of preparation and service), but it also reflects an increased number and technical sophistication of processing and marketing channels between farmers and consumers. Although a smaller fraction of consumer food dollars flow into agriculture, the economic well-being of farm households has not always suffered. Large commercial farmers typically earn incomes higher than the average U.S. household, and many are wealthy. The largest and most technically sophisticated farming operations provide an increasingly large share of the nation’s output, and they are better equipped to meet the demands of first line handlers and processors (as transaction costs are lower when larger volumes of consistent quality product can be acquired from fewer producers). However, changes in the structure of first-line handlers and processors can affect returns to some farmers. For example, in the highly consolidated meat and poultry industry, the processors/manufacturers can wield both monopsony and monopoly power. That is, they can set the prices they pay for supplies and the prices they charge for their products (MacDonald, 2008). In this sector, payment for farmers’ product has evolved into a “tournament system” whereby poultry producers are paid according to their productivity relative to other farmers. In this system, farmers have much less certainty about the price they will receive at the end of a season (Leonard, 2014). Other concerns with increased concentration of market shares in the hands of few firms are the potential loss in competition and decline in the transparency of markets. In the meat packing sector, a small number of firms control most of the business and independent farmers (without production contracts from packing firms) can find it difficult to access open and competitive markets for their livestock
(Key and McBride, 2007; Marion and Geithman, 1995; McEowen et al., 2002). Recent reviews of the literature suggest that adverse impacts on meat prices or consumer welfare have been relatively small, but the distribution of economic returns among different-sized actors or segments of the food supply chain can be affected (Sexton, 2013; U.S. GAO, 2009).
Because many workers on U.S. farms are unpaid family members of farm operators, it is difficult to determine the exact number of people involved in production agriculture. The 2012 Census of Agriculture estimated 3.2 million self-described “operators” on the nation’s 2.1 million farms (USDA, 2014b). Combined with unpaid family laborers and paid employees, a recent study by the University of Minnesota’s Food Industry Center estimated a total of nearly 6 million workers in the farm sector, or 5 percent of the nation’s work force (TFIC, 2014). By contrast, the Farm Labor Survey of the National Agricultural Statistics Service estimates that roughly 2 million self-employed operators and family members work on the nation’s farms, and slightly more than 1 million people are hired non-family farm workers (ERS, 2013b).
Although hired workers are a minority of the overall farm workforce, many farm operators and family members do not work full time on their farms, and hired farm workers are now estimated to contribute nearly 60 percent of total full-time equivalent labor on U.S. farms (Martin and Jackson-Smith, 2013); their contributions are increasingly important (Henderson, 2012; O’Donoghue et al., 2011; Sommers and Franklin, 2012). Between 60 to 80 percent of hired farm workers are employed on crop farms, most are foreign born, and more than half are unauthorized to work in the United States (Martin, 2013; Wainer, 2011).
Hired farm workers in the United States tend to work for relatively low wages and for fewer days a year than most of the U.S. workforce, which has led to chronic levels of underemployment, unemployment, and poverty in many farm worker households. The vast majority of hired crop workers are engaged in the fruit, vegetable, and horticulture industries, where labor-intensive crop management practices are still widespread. In 2010, the average hired crop worker earned less than $10 per hour, and median weekly earnings were about two-thirds of the average U.S. wage or salary worker’s (Martin and Jackson-Smith, 2013). As a result, poverty rates for farm workers are estimated at between 30 and 40 percent, among the highest of any occupational category in the United States (Pena, 2010; USDOL, 2005). Poverty rates for noncitizen farm laborers are even higher, nearly triple that of citizen farm workers (Kandel, 2008).
Quality of Life
Farm Owners
Because economic returns to agriculture have generally been volatile and below prevailing market rates of return to capital and labor (Cochrane, 1993), economists and sociologists have long sought to understand the motivation of farm operators to persist in farming (Gardner, 2002; Reinhardt and Barlett, 1989). Motivations to enter and remain in farming include a desire to maintain a family tradition, be one’s own boss, work outdoors, and spend time with and teach work ethics to one’s children (Barlett, 1993; Gasson and Errington, 1993).
Concern is growing, however, that the high capital costs and uncertain economic returns associated with modern agriculture have made it difficult for young farmers to successfully enter the sector. The average age of U.S. farmers has risen from 50 in 1978 to 58 in 2012, and a diminishing fraction of U.S. principal farm operators are younger than age 35 (see Figure 5-5) (USDA, 2014b). To some extent, this shifting demographic reflects the overall aging of the population, but it also results from a steady decline in the rate of new farm entry and the reduced number of transfers of family farm businesses across generations over the past 40 years.
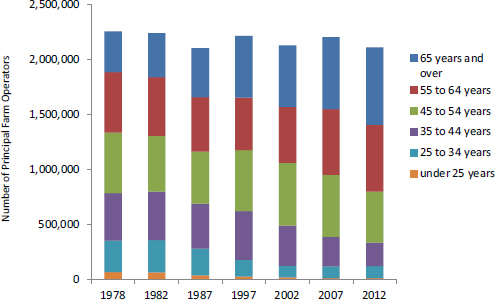
FIGURE 5-5 Age distribution of principal farm operators.
SOURCES: USDA, 2009, 2014b.
Although qualitative research on farm households in the United States consistently underscores the importance of quality of life outcomes to farm sector dynamics, quantitative indicators of positive quality of life effects on farmers and farm households are more difficult to find. One indicator is the degree of decision-making control that farmer operators have over day-to-day work allocation or production practices. A major example is the steady rise of contract production in U.S. agriculture, where production and marketing contracts now cover nearly 40 percent of U.S. production (MacDonald and Korb, 2011). In some livestock sectors—particularly beef cattle, hogs, and poultry—the vast majority of production is marketed under contract. The traditional spot market (non-negotiated) transactions by independent producers (Lawrence, 2010) has shifted to marketing contracts to highly consolidated meat packing industry and, eventually, to vertical integration (see Chapter 2 and below), which has both benefits and costs. Some of the benefits from vertical integration are higher efficiencies and a reliable supply of product (for the integrators) and more price certainty and aid with decisions about inputs and planting/management strategy (for the farmers). Other benefits or costs vary by contract (ERS, 1996). Farmers, however, have lost some entrepreneurial autonomy and decision-making power over assets due to unbalanced relationships in bargaining power with agribusiness firms (Stofferahn, 2006). For example, producers often assume most of the fixed capital investment costs, but they have less control over production practices and depend on the availability of future contracts to survive (MacDonald and Korb, 2008; MacDonald and McBride, 2009). In addition, independent farmers find it increasingly difficult to gain access to competitive cash markets for their products (Key and McBride, 2007; MacDonald and McBride, 2009; Marion and Geithman, 1995; Sexton, 2000; Ward, 2007).
Farm Workers
Hired farm laborers face particularly difficult working conditions and experience a quality of life that is well below that of most others in the U.S. population. Many farm workers live in substandard housing and have relatively little control over their work schedule or labor practices. About 15 percent of U.S. crop workers migrate from farm to farm to find continuous employment (Seattle Global Justice, 2014). This can disrupt family structure and educational experiences for children (Kandel, 2008).
As noted above, more than half of the farm worker population is foreign born, and many do not have legal permission to work in the United States. The insecure citizenship and immigration status of many farm workers often results in a lack of economic and political power and leaves them vulnerable to exploitation (Hall and Greenman, 2014). Estimates from
the Bureau of Labor Statistics indicate that unions represent only 1.2 percent of all private-sector employees in agriculture and related industries, and 1.8 percent of employees in food service and beverage establishments (BLS, 2014c). Good estimates of the number of foreign born or illegal farm workers affiliated with unions are lacking, but groups such as the United Farm Workers of America, founded in 1962 by migrant farm laborer Cesar Chavez, are still organizing to improve working conditions and wages for farm workers.
Women and Racial/Ethnic Groups
According to the 2012 Census of Agriculture, almost 83 percent of “primary” farm operators in the United States are white and male (USDA, 2014b). However, women are the principal operators of another 14 percent of all U.S. farms, up from roughly 5 percent in 1982 (Hoppe and Korb, 2013). Moreover, when principal, secondary, and tertiary operators are counted, nearly 1 million women (of all races) were engaged in running U.S. farms in 2012 (30 percent of the total) (USDA, 2014b). The role of women in U.S. agriculture has always been significant, though their presence in official statistics has often underestimated their contributions because until recently the Census only enumerated characteristics of the primary farm operator on each farm (Hoppe and Korb, 2013).
Farmers from racial and ethnic groups that are historically underrepresented in farming have also shifted in recent years. Historically, the number of African American farmers and sharecroppers in the United States declined by 98 percent since 1920 (Banks, 1986), a trend that is linked to political, economic, and cultural discrimination (Wood and Gilbert, 2000). More recently, the number of farms owned by Hispanics, American Indians, African Americans, and Asians all increased over the number owned by each of these subpopulations in 2007 (USDA, 2014b). The number of Hispanic-owned farms, in particular, has increased by 21 percent between 2007 and 2012. Although the share of farms operated by women and these racial and ethnic groups has increased over time, many of these farms had sales below $50,000 (an indication of smaller farms) (USDA, 2014b). Specifically, the percentage of farms that made less than $50,000 was 91 percent for women-owned farms, 85 percent for Hispanic-owned farms, 92 percent for American Indian-owned farms, 94 percent for black-owned farms, and 65 percent for Asian-owned farms.
Rural Communities
The economic performance and quality of life for farm operators and hired farm workers can be an important contributor for community life
and well-being, particularly in rural areas where farming is a major driver of local social and economic activity. Researchers know that rural communities that rely most heavily on farming for their local economic base are more likely to experience economic stagnation and population declines (Isserman et al., 2009). Growing farm size and specialization of production may be associated with declining local purchasing patterns and reduced landscape amenities that could attract non-farm development (Foltz et al., 2002; McGranahan and Sullivan, 2005). Traditionally, family farming systems with relatively equitable patterns of asset ownership and reliance on a family labor force have been linked to healthy dynamics in community social arenas and local businesses (Goldschmidt, 1978; Labao and Stofferahn, 2008; Lyson, 2004). Evidence also suggests that more diversified farming systems can generate ecological and aesthetic landscape benefits and increase reported quality of life (Deller et al., 2001; Flora, 1995; Santelmann et al., 2004).
Rural communities that host large farm worker populations often struggle to meet this group’s unique social service and educational needs (Findeis et al., 2002). Farm worker towns in the Central Valley of California experience some of the lowest per capita income, poorest public services, and most stressed local fiscal conditions of any rural communities in America (Martin, 2009).
Health
Access to Health Care and Health Care Benefits
Farm operators and households Farm operators and their families, like millions of other Americans, deal with issues related to accessing affordable health care as well as health and safety considerations specific to this occupation. Patterns of health insurance coverage are changing for most individuals and families in the United States with implementation of the Patient Protection and Affordable Care Act (ACA).1 Presumably, farm households that lacked access to affordable health insurance are now eligible to obtain coverage through the ACA. A comprehensive report by USDA found that before implementation of the ACA, 9.3 percent of all people living in farm-operator households did not have health insurance, a lower share than in the U.S. population as a whole (ERS, 2014j). Households where farming was the primary occupation, such as in the dairy industry, were the most likely to lack health insurance (ERS, 2014j). Farm households without
_____________
1 Patient Protection and Affordable Care Act, Public Law 111-148, 111th Cong., 2nd session (March 23, 2010).
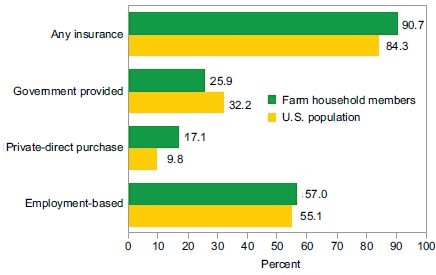
FIGURE 5-6 Source of health insurance coverage for farm and U.S. persons.
NOTE: Individuals may have more than one source of health insurance.
SOURCE: http://www.ers.usda.gov/data-products/chart-gallery/detailaspx?chartId=33728 (accessed November 24, 2014).
access to employer-sponsored health insurance (typically from non-farm work) paid an average of $6,000 annually in insurance premiums.
A large body of literature has documented unequal access to health care by individuals who live in rural areas (Murray et al., 2006; Probst et al., 2007; Syed et al., 2013). Because most farmers reside in rural areas, many of them must travel significant distances to interact with the medical system. Approximately 60 percent of farm-operator households are located in rural areas, which have known physician shortages (Jones et al., 2009b). According to data from the U.S. Department of Health and Human Services’ Health Professional Shortage Areas, 17 percent of the farm population resides in shortage areas for primary care access (HRSA, 2014; Jones et al., 2009a). Dental and mental health care is also not easily accessible to farmers compared to the general population (Jones et al., 2009a). However, prior to the ACA, farm households had health insurance coverage at about the same rate as the general U.S. population (see Figure 5-6).
Farm laborers Migrant and seasonal farm workers are distinct worker populations: most migrant workers are foreign born, typically from Mexico and Central America, and live in temporary housing, whereas seasonal workers are primarily U.S. born and are permanent residents of a commu-
nity (Seattle Global Justice, 2014). Both face challenges in accessing social and health care services. For instance, few migrant workers are provided with health insurance. Lack of transportation, inconvenient hours, cost, language barriers, and frequent relocation are other barriers (Seattle Global Justice, 2014). Delaying care because of concerns related to immigration status results in worsened health conditions (Bail et al., 2012).
In addition to low wages, seasonal farm workers and migrant workers rarely have access to important protections such as workers’ compensation (NCFH, 2012). According to data compiled by the advocacy group Farmworker Justice, only 13 states plus the District of Columbia, Puerto Rico, and the Virgin Islands require employers to provide workers’ compensation insurance or equivalent benefits to migrant and seasonal workers; this coverage is optional in 16 states (Farmworker Justice, 2009). This lack of coverage is important because when workers are sick or injured, they do not receive compensation; workers who miss work also are likely to lose their job. Most food system workers, including farm laborers, do not have paid sick days or do not know if they do and have worked when sick (FCWA, 2012). Non-American citizens cannot obtain insurance under the ACA, and because the food system employs so many undocumented immigrants, they will remain part of the uninsured population (NILC, 2014). Immigrants who are lawfully present in the United States may receive only limited federal coverage for health care (NILC, 2014).
Health and Safety Effects
Agricultural production has recognized health and safety risks. Modern agriculture involves the use of large machinery and potentially dangerous agrichemical inputs. Farming is one of the most hazardous occupations in the United States2 (McCurdy and Carroll, 2000; NIOSH, 2010). From 2006-2009, the occupational fatality rate for workers in agriculture, forestry, and fishing was significantly higher than for all other industries (see Figure 5-7). Recognizing the hazards in this industry, Congress in 1990 directed the National Institute for Occupational Safety and Health (NIOSH) to develop specific strategies to address the high risks of injuries and illness to agricultural workers and their families. Under the NIOSH portfolio, the Agriculture, Forestry, and Fishing sector has a number of strategic goals to guide research and partnership efforts targeting priority areas, including traumatic injury and hearing loss (CDC, 2014b). Commercial fishing also receives specific attention from NIOSH, as the fatality rate
_____________
2 In 2004, an estimated 9.2 injuries occurred every hour on U.S. farms, with a fatality rate of nearly 26 per 100,000.
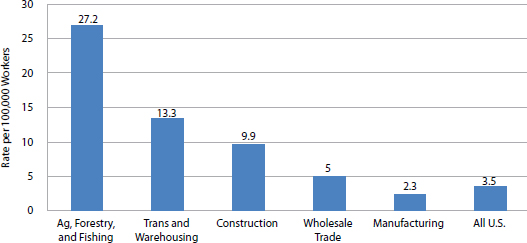
FIGURE 5-7 Occupational fatality rate, 2006-2009.
SOURCE: http://www.cdc.gov/niosh/programs/agff (accessed November 24, 2014).
of 124 per 100,000 workers is well above the overall fatality rate among all U.S. workers of 4 per 100,000 workers (NIOSH, 2014).
Chemical-related exposures also are important, and efforts are underway to conduct better surveillance of these exposures, as episodes of pesticide-related intoxications are not well captured in any national surveillance system (Geiser and Rosenberg, 2006; NIOSH, 2011). According to Calvert and colleagues (2008), the overall incidence of poisoning events was 53.6/100,000 farm workers compared to 1.38/100,000 for non-farm workers. About one-third of the affected workers were pesticide handlers and the rest were farm workers exposed to off-target drift of pesticide applications or exposed to treated plant or animal material. A wide array of signs and symptoms were reported (most of them low severity), with the most frequent being nervous or sensory symptoms, gastrointestinal irritation, eye problems, and skin and respiratory irritation. Acute poisoning is most frequent in processing and packing plant workers compared to other workers in agriculture. The scale of the problem is not easy to track. California, where large numbers of farm workers are employed, is the only state that requires mandatory reporting of pesticide-related intoxications (Geiser and Rosenberg, 2006; NIH/EPA/NIOSH, 2014).
Although farmers have a lower incidence of smoking, cancer, and cardiovascular disease compared to non-farm workers (Jones et al., 2009a), some evidence exists that they also experience high levels of anxiety, stress, depression, and suicide (Fraser et al., 2005; Freire and Koifman, 2013; Roberts et al., 2013). Respiratory disorders, dermatitis, and chronic pain associated with muscle and skeletal damage are also common. Agriculture also is unique among most industries in the significant levels of involve-
ment of children and other family members who work and live on farms, which can lead to additional health and safety risks. Agricultural work may increase their risk of injury, illness, and exposure to toxic chemicals.
POTENTIAL SOCIAL AND ECONOMIC EFFECTS ON THE FOOD INDUSTRY
As noted in Chapter 2, the heterogeneous U.S. food and fiber system accounts for roughly 5 percent of the gross domestic product (GDP) (ERS, 2014e) and nearly one in five jobs in the United States (King et al., 2012). The non-farm sectors of the food industry have become the most significant sources of employment. In 2012, they contributed to approximately 90 percent of the economic value added to the food products purchased by U.S. consumers (see Figure 2-6 in Chapter 2). The primary functions of the non-farm sectors are to transport and transform raw agricultural products into edible foodstuffs. These subsectors (see Figure 2-1 in Chapter 2) are the technology and input suppliers, first line handlers and food manufacturers, wholesale/logistic suppliers, retail food stores, and food service establishments. In addition, a secondary market exists for food recovery in the form of food banks and food shelves plus the food disposal and waste sector.
Income, Wealth, and Social Well-Being of Workers and Communities
In this section, we highlight some of the differences in social and economic outcomes for participants in each of the major post-farming subsectors of the U.S. food supply chain. These sectors are highly interdependent, and changes in any one sector influence the performance of other sectors as well as the price and availability of food. Competitive pressures within each sector (and across sectors) have been major drivers of changes in technology and organizational structure (e.g., consolidation, vertical integration, market expansion, and market differentiation). These, in turn, drive economic efficiencies, opportunities and rewards to labor, and food options to consumers.
A recent study by Robert King et al. (2012) provides an overview of the total and heterogeneous employment opportunities and wages/benefits in each major subsector of the U.S. food industry. They find that about 23 million workers are involved in food system jobs, with average annual earnings of slightly more than $19,000 per year (less than half the average annual income of all workers in the United States in 2007) (see Figure 5-8). By far the largest number of workers is found in the retailing and food service sectors, where annual average earnings tend to be low. Two subsectors—distribution/wholesale and waste recovery—have mean payrolls slightly above the national average income of $41,525; food processing

FIGURE 5-8 Number of U.S. food industry employees.
SOURCES: King et al., 2012; data from 2007. http://foodindustrycenter.umn.edu/prod/groups/cfans/@pub/@cfans/@tfic/documents/article/cfans_article_404726.pdf (accessed November 24, 2014).
and manufacturing workers and input supply workers have mean payrolls slightly below.
Technology and Agricultural Input Sector
Farmers in the primary production sector, discussed above, obtain a wide range of materials and services from the agricultural input sector. These inputs include seeds, chemicals, equipment, animal health services, animal breeding/genetics, financing, and information needed for modern commercial farming. As discussed in Chapter 2, over the past few decades, the agricultural input sector has consolidated as a result of numerous mergers and acquisitions. Many agricultural input firms are now global in scope, with diverse types of inputs integrated under relatively few corporate umbrellas.
Structure and profitability of the sector Historically, many first line–handling firms as well as input suppliers were organized as agricultural cooperatives that provided fuel, chemicals, seed, and other inputs to their members. Members of a cooperative are paid a dividend annually that depends on company profits. Cooperative organizations enabled many small producers to band together to gain bulk discounts on farm input purchases and to find markets for their products. The total number of marketing, supply, and service cooperatives declined from 4,663 in 1990 to 2,549 in 2007 as cooperatives merged and farmers shifted to selling through other channels (USDA, 2014a). Concomitantly, the number of members declined from 4.1 million to 2.5 million as net sales rose from $77.3 billion to $127.8 billion. The average returns to the members in 2007 were more than three times as much as they were in 1990 (USDA, 2014a).
Globalization, technological innovation, and organizational restructuring have created competitive advantages for large agribusiness firms with superior products that thrive with economies of scale. In addition to providing inputs, many major agricultural input suppliers contract with farmers to purchase their output. Closer coordination of production, processing, and distribution in vertically integrated operations can lead to gains (e.g., increased efficiency, more uniform food products, and reduced prices for consumers). Consolidation, however, can lead to costs to the workforce (e.g., less employment opportunities in the sector) and to smaller operations that might not have the resources to compete.
Concentration of food and agricultural input firms can lead to shifts in market power and affect the distribution of economic returns among food chain sectors (Myers et al., 2010; Sexton, 2013). Because larger firms generally incur more research and development costs than do most small firms, they must recover these costs as well as capital, regulatory, labor, and other costs. Because these larger firms also experience economies of scale, their ability to raise prices does not always mean that they do raise prices. Moreover, when fewer firms operate in an industry sector, they compete fiercely with each other, which can hold down prices to their customers (Chung and Tostao, 2012; Sexton, 2013). However, in the case of agricultural input suppliers, farmers are willing to pay higher prices if doing so results in greater yields on crops and livestock or results in higher prices for better quality output. As shown in Figure 5-9, the prices of most farm inputs rose more rapidly than the commodity prices received by farmers between 1990 and 2012 (Fuglie et al., 2012).
Workers As shown in Figure 5-8, this sector has relatively few workers compared to other subsectors of the U.S. food supply chain. The average incomes of half a million workers in the farm input sector are the third highest in the overall food industry at about $30,000 per year.
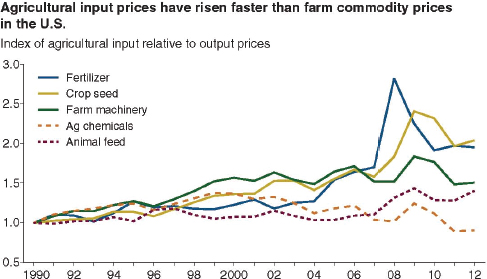
FIGURE 5-9 Agricultural input prices.
NOTE: Prices paid by U.S. farmers for farm inputs divided by prices received from farm commodities (indexes, 1990 = 1.00).
SOURCE: Fuglie et al., 2012.
Given the global nature of many farm input companies, as well as the skills in chemistry and biological systems needed, it seems likely that demand for workers with higher education levels to fill these jobs will grow.
Communities Agricultural input industries have historically contributed to the economic health and employment of rural communities, particularly when they are locally owned and managed or at least maintain production and sales operations in local trade centers. The restructuring of the input industries has led to some consolidation of retail outlets (e.g., for farm machinery and farm chemical inputs), and larger farming operations are known to source their inputs in bulk (at a discount) at greater distances from nonlocal businesses (Foltz et al., 2002; Sfiligoj, 2012). The net result of changes in the structure of both farming and farm input businesses has been to diminish economic opportunities for locally owned agricultural input and supply businesses in many rural communities, particularly those located further from industrial and transportation centers (Drabenstott, 2000; Foltz and Zeuli, 2005; Kilkenny, 2010; Lambert et al., 2009).
Food Processing and Manufacturing
This sector is composed of first line handlers who receive, package, and store raw agricultural products in preparation for shipment to the next party down the food supply chain and of food processors and manufacturers who turn ingredients into edible, packaged, storable, and safe food for final preparation and consumption by consumers or food service establishments (see Chapter 2).
Many companies that buy farmers’ goods do so through contracts that guarantee the purchase of a certain amount of product for a predetermined price, assuming that the raw goods meet the quality specifications of the buyer. The benefit of this arrangement is that it alleviates the farmer’s risk of not finding a market and of not knowing what the price will be at harvest time. It also can provide an opportunity to hedge against price declines in case of unforeseen market circumstances. The companies’ contracts also provide technical advice and set standards of quality and safety that help to ensure a uniform supply of product that will be accepted by the downstream market. The demand from processors and retailers for uniform size and quality of product plays a large role in the benefits from contract farming.
Structure of the sector Changes in the structure of first line handlers can affect competitive pressures and returns to farmers. One example is the livestock supply chain, where vertical coordination has led to changes in the business relationships. In the poultry industry, producers are paid according to their productivity relative to other farmers and have much less certainty about the price they will receive at the end of a season (Leonard, 2014). Concentration of market shares in the hands of few firms can also lead to potential loss in competition and decline in the transparency of markets.
Food processors and manufacturers tend to be large corporations, and many are multinational in scope. They are focused on learning consumer preferences and designing foods to increase their market share. Food and beverage plants in the United States are widely distributed throughout the country, but some areas have seen a decrease in numbers since the 1980s (Edmonson, 2004; ERS, 2014c).
The food processing and manufacturing sector ships about 14 percent of the value shipped by all U.S. manufacturing plants (ERS, 2014c). Food processors and manufacturers are constantly adapting to feedback from retailers’ sales and orders. As shown in Figure 2-6 in Chapter 2, food manufacturing adds about 16 percent of all value added in the food supply chain, the second highest amount after the food service sector. In 2011, processing and manufacturing of meat products composed the largest part of that value added by food manufacturers (17 percent), followed by beverages (16
percent), bakery and tortilla products (11 percent), fruits and vegetables (10 percent), and dairy products (10 percent) (ERS, 2014c). The U.S. Census reports 14,487 food processing and manufacturing companies, including 1,510 meat and 421 poultry companies, 3,097 beverage companies, 2,813 bakeries, 1,798 fruit and vegetable preserving companies, 1,007 dairy firms, and 4,050 soft drink manufacturers in 2011 (U.S. Census Bureau, 2014).
Workers Overall, the food processing and manufacturing subsector employs 1.5 million workers. This represents 14 percent of the total manufacturing sector workforce and about 1 percent of the non-farm labor in the United States. Thirty-two percent of these workers are in the meat processing sector, 9 percent are in dairy product manufacturing, 17 percent are in bakery, and 11 percent are in fruits and vegetables (ERS, 2014f). The payroll per employee in the meat and poultry sectors was $41,000 and $29,000, respectively, in 2011 (U.S. Census Bureau, 2014). The payroll per employee in grains and oilseed milling is higher than the national average at $73,000 per year. The payroll per employee in the fruit and vegetable processing sector was $57,000 in 2011 (U.S. Census Bureau, 2014).
Census statistics report that U.S. food manufacturing establishments had an average of 2,661 employees per establishment (plant), with a payroll per employee of $53,090 in 2011. Thirteen percent of the sales receipts were dedicated to payroll in the food manufacturing sector (U.S. Census Bureau, 2014). U.S. manufacturers overall had an average of 2,102 employees per establishment, with an average payroll per employee of $70,000 (U.S. Census Bureau, 2014).
A typical hourly wage worker in a food manufacturing plant earned approximately $12.50 to $14.00 per hour in 2013 (BLS, 2013). At $13.00 per hour, a full-time worker would make an income of $27,040 per year. Plants use a mix of skilled and unskilled labor, though even unskilled workers must be familiar with handling animals, foods, heavy equipment, and/or computerized equipment. Skilled labor requires some formal education in food science, chemistry, management, and marketing.
A recent survey of 2,456 food scientists and technologists, 66 percent of whom were employed in the food industry, shows a median salary of $90,000 in 2013. These employees have degrees in higher education, such as a bachelor’s or a graduate degree. About 90 percent reported receiving health insurance and a retirement investment plan (Kuhn, 2014). This illustrates some of the more attractive employment opportunities in this industry. In contrast, this industry also has many part-time workers making minimum wages.
Worker health and safety Food processing workers tend to work in manufacturing facilities and operate equipment that mixes, cooks, or processes
ingredients used to manufacture food (BLS, 2014b). The meat and poultry slaughtering and processing industries have long been associated with a high rate of injuries, fatalities, and illnesses (OSHA, 2014). Processing workers are typically exposed to noise as well as extreme heat—for workers interfacing with cooking machinery—or extreme cold—for employees involved with frozen or refrigerated goods. Workers are usually standing for most of these shifts and needing to stretch and reach to clean or operate large equipment. Musculoskeletal injuries, especially low back pain, are therefore a major problem. Injuries related to repetitive motion also are significant, especially in processing plants where employees are working the line and have to conduct the same motion repeatedly during a single shift. Other risks include hazards on the plant floors that increase the risk of slips, trips, and falls.
Communities Because community social and economic well-being is influenced by a wide range of factors, it is often difficult to link community outcomes with the presence or absence of any single business or firm. Because they have relatively small and less diversified economies, rural communities are more affected by changes in local business or employment opportunities. One recent example of this type of change is the dramatic shift in the location of meat processing plants from major urban areas to rural towns during the 1980s and 1990s, which has been linked to a wide range of social and economic impacts (Artz, 2012; Stull et al., 1995).
Wholesale and Logistic Suppliers (Distribution Subsector)
This sector of the food system provides the transportation and warehousing of food and agricultural products between the other sectors. It involves warehousing, trucking and other transportation, and procurement services. This sector is critical to the availability of food in remote areas and in cities far from production location. It also is vital to global trade.
Structure of the sector The total number of companies in the wholesale business related to food, beverage, and agricultural products was 3,810 in 2011 (U.S. Census Bureau, 2014).
On the food service side, traditional wholesalers still dominate because they serve many small retail enterprises with specialized orders. The agricultural input sector also has wholesalers. Nine percent of the wholesale companies listed in the Census data deliver farm supplies and another 9 percent deal in raw farm products destined for processors (U.S. Census Bureau, 2014).
Not traditionally counted among the wholesale sector are the numerous food banks that act as wholesalers to food shelves around the country.
The largest nonprofit wholesaler in this business is Feeding America and its members, such as Second Harvest Heartland. Feeding America has 200 member food banks that collect food and redistribute it to food shelves, soup kitchens, and other charitable feeding establishments in every county in the United States. In 2013, they distributed more than 3,878 million pounds of food (Feeding America, 2014a). This amount is only 0.06 percent of the total edible food listed in Figure 2-2, but it provides more than 3 billion meals per year. In addition to the additional meals provided, food companies and individuals who donate food or cash receive a charitable tax deduction and companies save waste disposal costs.
Workers Wholesale companies related to food and agricultural products employ at least 357,790 people, an average of 78 per establishment (U.S. Census Bureau, 2014). They are among the higher paid workers in the food industry, with an average payroll per employee of $57,000. Six percent of sales receipts is dedicated to payroll in the wholesale sector.
The skills required in the wholesale sector are heterogeneous, from laborers to truck drivers, forklift operators, warehouse managers, computer programmers who optimize the efficiency of loading trucks and truck routes, sales and procurement experts, and food safety experts (e.g., cold chain managers). The distribution of wages across all of these types of workers varies according to their skills, the alternative market for their skills, and where they are located in the country. In addition, Feeding America reports using 8.6 million hours of volunteer labor in 2013 (Feeding America, 2013).
Worker health and safety A significant component of distribution involves transportation, in addition to warehousing (FCWA, 2012). The health and safety risks faced by these workers, especially those involved in warehousing, are repetitive motion and lifting. Warehouse workers have the highest rates of chronic debilitating injuries due to repetitive motion, bending and squatting, and improper lifting techniques (Free Library, 2014). Safety reports indicate a lack of personal protective equipment among these workers, which places them at risk of injury by allowing exposure to injury-producing hazards. Workers load most warehouses and trucks with forklifts that alleviate heavy lifting, but the speed of operation in closed spaces is a potential hazard. Because distribution involves the transport of goods, motor vehicle crashes are a significant cause of death and injury. Motor vehicle-related crashes are the leading cause of work-related fatalities in the United States (CDC/NIOSH, 2014). Truckers who haul food products are exposed to all of the hazards of trucking, including stress and fatigue due to routes and schedules, illness, night driving, and risk of back injuries from heavy lifting.
Retail Food Stores
This subsector includes traditional grocery stores and, increasingly, the large box retailers who sell food as part of a vast mix of general merchandise. Retail stores also include convenience stores and a host of newer venues, such as drug stores, gas stations with convenience stores, specialty foods, and online food companies. Retail food stores had a total of $742.3 billion in sales in 2013. Food sales in retail stores represent 53 percent of all food sales of $1.4 trillion, with the rest of food sales taking place in some form of food service establishment (ERS, 2014d).
Structure of the sector Due in large part to price competition from “big box” stores, stores in this sector have been consolidating to adapt to information and transportation technologies that allow them to minimize in-store inventories. New strategies to attract and hold customers began in the mid-1990s. They involved using information technologies to track customer purchases, instituting loyalty programs, and lowering prices and/or finding market niches that larger stores do not fill. Competition was fierce and the structure of the retail industry began to bifurcate into big companies with generally lower priced goods and companies specializing in smaller stores with specialty products and services at higher prices. In the big box stores, lower food prices can be sustained because they are balanced by more profitable sales of general merchandise. The volume and velocity of turnover of foods that move through retail food stores calls for efficient logistics, efficient aggregation and analysis of data, and energy savings in transportation. It facilitates great buying power, including the power to dictate product quality and safety specifications, quantities, timing, and price. Suppliers are obligated to adapt to the demands of large retailers. For example, roughly one-third of all products sold by major manufacturers are sold through the largest retail company in the United States, which is also the second largest publicly traded company in the world. Retailers are increasingly buying products with their own brand label, further diminishing the market power of food manufacturers with national and international brand names.
Large food retailers (those with more than 100 stores) have developed their own distribution warehouses, cutting out the wholesaler for most products. This enables them to cut costs and compete on price. Nationally, prices at discount stores are 7.5 percent lower than at traditional grocery stores, which puts price pressure on all retail food sellers (ERS, 2014h).
Workers Overall, 56,786 retail food and beverage companies employ more than 2.4 million people, for an average of 43 people per establishment (U.S. Census Bureau, 2014). These employees include stockers, checkers, and managers. This sector also includes workers who cook and prepare
food for bakeries and delis within the retail outlets, as well as those who clean the facilities (FCWA, 2012). The payroll per employee is $25,600, or 19 percent of sales receipts. Payroll per employee is lower than in retail businesses in general, where payroll per employee is $28,000, or 11 percent of sales receipts (U.S. Census Bureau, 2014).
The labor in this sector is not generally highly skilled except for management. Although the ubiquitous nature of retail food stores provides employment opportunities in most communities, wages tend to be near minimum wage for many workers. The average earnings of $25,600 is 114 percent of the U.S. poverty level for a single person in 2014 and almost equal to the poverty level of $23,850 for a household of four people (HHS, 2014).
Worker health and safety Jobs in retailing involve heavy lifting and the use of potentially hazardous equipment, which places workers at risk of back injuries and lacerations or amputations. In addition, psychosocial factors, such as work-related stress and shift work, are important considerations for these employees.
Food Service Establishments
This sector includes individually owned restaurants, mid-priced chains, quick service (fast food) establishments, hotels, and beverage establishments. They cater to the tastes of their particular customers and are often leaders of food innovation. Also in this sector are institutional food service establishments such as schools, hospitals, prisons, food (soup) kitchens, and Meals on Wheels.
Structure of the sector The food service sector has at least 125,951 companies and approximately 4 million employees. It employs an average of 32 people per establishment; payroll is more than 27 percent of their sales revenue (U.S. Census Bureau, 2014). It is a labor-intensive business, mostly because it is largely a service business with few opportunities to substitute capital for labor. The cost of the food in most food service places is no more than one-third of their total costs.
In 2013, 47 percent of all food sales were in this sector, consistent with the division of sales over the past several decades (ERS, 2014g). As data from USDA’s Economic Research Service show, however, sales at fast food establishments increased the most in the mid-1980s, while institutional food sales were down (see Figure 5-10).
Workers The average income of food service workers, $24,857, is about the same as the poverty level for a household of four persons, $23,850 in
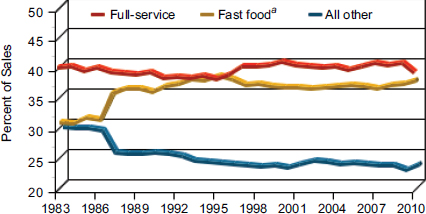
FIGURE 5-10 Sales of food.
a Fast food excludes contract feeding and concessions.
SOURCE: ERS, 2014g.
2014 (HHS, 2014; U.S. Census Bureau, 2014). The skill level in this sector is relatively low except for management and a few very skilled chefs. This sector provides employment in nearly every community.
Not surprisingly, turnover also is a problem among retail workers, especially among those who experience wage theft (e.g., not receiving overtime payments, tip misappropriations) (FCWA, 2012). For the most part, these wage inequities are present at the largest companies (Kelly et al., 2012). It is important to note, however, that while many wage violations occur, this sector also demonstrates promising examples of best practices for worker wages, career mobility, and good supply chain policies and programs (Kelly et al., 2012; Liu, 2012).
Worker health and safety Food service workers perform a variety of customer service, food preparation, and cleaning duties. Shift work is very common, and in 2012, about half of these workers were employed part time (BLS, 2014b). Food and beverage serving and related workers are on their feet most of the time and they have to lift heavy objects, such as trays of food. During busy dining periods throughout the day, workers are called to serve customers quickly and efficiently. Injuries among these workers tend to be nonfatal and are mainly due to slips/trips/falls, burns, and lacerations that may lead to time away from work.
Teen workers are overrepresented in this sector, primarily because the option to work various shifts allows for flexible schedules. Young workers
have high occupational injury rates, which are partially attributed to the number of injury hazards in food service establishments (e.g., slippery floors and use of knives and cooking equipment) (CDC, 2014c). The rate for occupational injuries of young workers treated in emergency departments from 1998 to 2006 was approximately two times higher than among workers age 25 and older (CDC, 2014c). In addition to these hazards, inexperience and lack of safety training also may increase workplace injury risks for young workers (CDC, 2014c).
Many food service workers also report having no access to paid sick days. One survey of more than 600 food system workers in the United States found that only 21 percent confirmed they had paid sick days (the rest either did not have them or were unaware if they had them) (FCWA, 2012). Reports also have documented working long hours and the inability to take breaks because of a need to maintain the output demands (CDC, 2014a). Employees who work with food when infected by norovirus or other contagious illnesses can spread disease to others by easily contaminating food and drinks that are touched. Because of the lack of sick leave, food service workers have an economic incentive to return to work as soon as possible. Food establishments are generally very busy, and not showing up during a busy time (e.g., holidays and weekends) can potentially lead to losing a job.
Overall Worker Well-Being in U.S. Food System
Poverty and injustice in the food system has been described in the literature for centuries (VanDeCruze and Wiggins, 2008). Evidence shows that 40 percent of food industry jobs provide a wage at the federal poverty level; only 13.5 percent of the jobs provide wages that yield an annual income at 150 percent of the poverty level (FCWA, 2012). As the previous sections of this chapter have described, some food system workers receive a livable wage, but many do not, and they have little or no career mobility in these jobs. Estimates from 2010 indicate that median hourly wages for employees in U.S. food industry sectors vary slightly by segment (median hourly wages of approximately $9.00 to $13.00 for workers in production, processing, distribution, and services), but incomes for positions within the sectors vary greatly (Kelly et al., 2012). For example, of the top 100 chief executive officers in the United States, 8 are from the food system and their total salaries in 2012 equaled that of more than 10,300 food service workers (FCWA, 2012).
Among the top five companies taking the lead globally with promising policies and programs, four are European companies. This suggests that U.S. companies can learn important lessons about promoting fair wages, mobility, and other social and economic advancements for food system
workers (Kelly et al., 2012). Fortune magazine publishes an annual list of the 100 best companies to work for in the United States. In 2014, three grocery companies, two restaurant chains, and two food manufacturing companies were on the list. Among these seven companies, average salaries ranged from $45,684 to $115,007, while the average hourly workers’ annual wage income ranged from $26,240 to $52,318. Of note, none of these companies offered wage benefits or paid for health insurance, but amenities that employees praised were flexible work hours, training and upward mobility in the company, on-site child care and fitness centers, or paid health club benefits (Fortune magazine, 2014).
Food Company Performance and Contribution to the Economy
Two measures of the performance of companies are size and profitability. The Fortune 500 is an annual list of the top 500 publicly traded companies registered in the United States with U.S. operations. This list does not include privately held companies in any industry, but it serves to compare food firms to firms in other U.S. industries. Firms are ranked by total revenue, and profitability also is reported (Fortune magazine, 2014). The profitability of each of these companies indicates their contribution to the economy in general and to the wealth of their stockholders as well as the stability of employment for their employees. For 2013, 39 of the top 500 companies were in the food industry. Annual revenue of these 39 food companies ranged from $6.5 to $469.3 billion. Table 5-1 shows the distribution of Fortune 500 food system companies across the food supply chain. The most numerous firms represent the food manufacturing and retail food sectors.
In general, the largest profits are found in the food manufacturing sector, primarily among large multinational companies and in the food service sector. Economic returns to manufacturing companies and their investors are larger than in most other sectors partly because this sector has relatively high concentration through merger and acquisition and global markets. In the food service sector, consumers pay for experiences and convenience as well as food; several of the chain operations operate on a global scale.
Trends that mitigate the profits in this sector are fluctuating raw commodity prices and the trend toward private retail store labels instead of (inter-) national brands. Rising commodity prices are often hedged forward to reduce uncertainty and smooth out manufacturing costs and wholesale prices of product. Food manufacturers that are producing the products are skilled in selling them under various private labels to mitigate competition from other private store labels. Wholesalers are perhaps the most vulnerable sector and struggle for profitability as retailers contract directly with processors to deliver product to stores and/or set up their own distribution
TABLE 5-1 Number of Food and Agriculture Firms in the Fortune 500 List, Ranking by Total Revenue and Profitability
| # of Firms in Fortune 500 | Ranking Range in Fortune 500 | Profits as % of Revenue | |||||
| High | Low | Average | Low | High | |||
| Agricultural input firms | 2 | 27 | 69 | 2.0 | |||
| Food manufacturing | 18 | 43 | 452 | 6.7 | –2.0 | 19.0 | |
| Food wholesale and distribution | 4 | 65 | 500 | 2.0 | –2.0 | 5.0 | |
| Retail food companies | 10 | 1 | 378 | 2.6 | –3.0 | 6.0 | |
| Food service | 5 | 111 | 328 | 10.0 | 1.0 | 20.0 | |
| All food system companies | 39 | 27 | 600 | ||||
SOURCE: Fortune magazine, 2014.
centers and logistics operations. The exception to this is in the wholesale business for the food service sector.
Retail food stores traditionally struggle for profitability mostly because of fierce horizontal competition. Many stores go out of business as consumers seek the lowest prices for homogeneous products or unique shopping experiences and products in upscale stores. The bifurcation of retailers has been occurring since the 1990s, with the big box stores on one side and unique food offerings like organic and total private labels on the other. Retailers that try to supply middle-of-the-road grocery stores are disappearing. Profits on grocery store sales are traditionally stated as 2 percent, meaning they operate at very small margins (FMI, 2013).
POTENTIAL SOCIAL AND ECONOMIC EFFECTS ON U.S. CONSUMERS
Perhaps the primary indicator of social and economic success in any food system is the ability to provide a population with an abundant supply of affordable, safe, high-quality, and nutritious food. This review suggests that the U.S. food system meets these goals most of the time for most people, but significant diet-related disease (see Chapter 3) and food insecurity point to areas needing improvement. Researchers have understood for decades that all of the decisions made regarding food, purchasing, and
consumption depend on multiple variables. These include the communities in which people live; the food available in those communities; the influences to which they are exposed, such as advertising and marketing; and their beliefs about the environment, farming, globalization, and many other factors. The food system is dynamic and the changing eating habits and cultural and environmental dispositions among U.S. consumers over the past several decades signal a shift in preferences. This shift will be necessary to assess in future decades.
Food Costs and Expenditures
Compared to other social and economic variables, income arguably has the strongest marginal impact on dietary behavior: higher-income households spend more for food and eat higher-quality diets; lower-income households buy more generic brands and discounted foods (Contento, 2010) and prepare more of their food at home. In 2009, the lowest quintile households spent $3,500 on food, while households in the highest quintile spent more than three times that at $10,800 (BLS, 2010). However, those in the lowest quintile of income spend a much higher share of their total income on food (nearly 35 percent in 2012) than do those in the highest quintile (7 percent) (BLS, 2014a) (see Figure 5-11), despite the fact that over the past 50 years, the average share of income spent on food has fallen from approximately 18 percent to approximately 10 percent (ERS, 2013a).
The foods purchased and consumed by lower- and higher-income households are different, as is the percentage of food dollars spent on food at home (FAH) compared to food away from home (FAFH). Actual expenditures on all food product categories, including fruits and vegetables (Ludwig and Pollack, 2009), increase at every income level and are 2.5 times higher for the highest income levels (BLS, 2012).
One measure of how the U.S. food system serves the needs of consumers is the rate of change in food prices and the percentage of income required to purchase food. Historically, the Consumer Price Index3 (CPI) for food at retail stores was below or the same as overall inflation, running at about 2 to 3 percent between 1990 and 2005 (Volpe, 2013). Since 2005, the CPI for food has been more volatile due in part to international market shortages, weather, and other factors. Between 2006 and 2012, the CPI for food rose 20 percent compared to 14 percent overall. This led to the percentage of disposable income spent on food rising from an average of 9.5 to over 10 percent (Volpe, 2013).
The costs of producing, processing, and transporting food to consumers
_____________
3 The Consumer Price Index is the measure of the average change over time in the prices paid by urban consumers for a market basket of consumer goods and services.
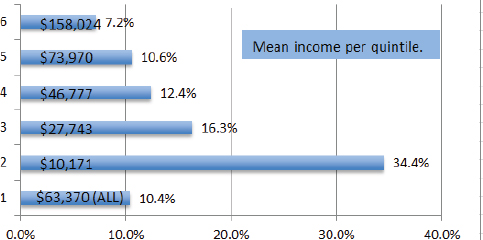
FIGURE 5-11 Food expenditure by income.
NOTE: 1 = Total population; 2 = Lowest income quintile; 3 = 2nd income quintile; 4 = 3rd income quintile; 5 = 4th income quintile; 6 = Highest income quintile.
SOURCE: BLS, 2014a.
all influence the food price and the CPI for food. Reducing these costs can lower food prices and food price inflation. Figure 5-12 displays the CPI for food relative to the overall CPI from 2006 to 2012.
Food Security and Food Access
Most U.S. households are food secure—that is, they have access to a dependable food supply. Since 2000, USDA has monitored the extent and severity of food insecurity through an annual national representative survey (Gundersen et al., 2011). In a 2012 survey documenting food security in the United States (Coleman-Jensen et al., 2013), about 8.8 percent of households (10.6 million) were described as having low food security (reports of “reduced quality, variety, or desirability of diet, with little or no indication of reduced food intake”) (USDA, 2014c). Another 5.7 percent of households (7 million) were described as having very low food security in which the food intake of some household members “was reduced and normal eating patterns were disrupted at times during the year due to limited resources” (Coleman-Jensen et al., 2013, p. v). About 10 percent of U.S. households that had children were classified as food insecure. The prevalence of food insecurity was lower in the year 2000 than it is now. It substantially increased in 2007-2008 as the recession started and has been essentially unchanged since then. In 2012, 1.2 percent of households
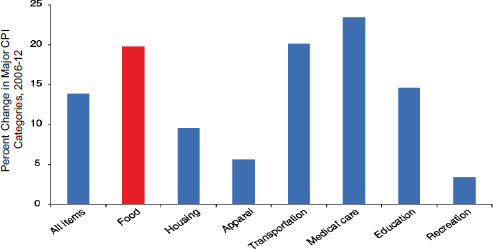
FIGURE 5-12 Consumer Price Index for food.
NOTES: Between 2006 and 2012, food price inflation was greater than overall price inflation. CPI = Consumer Price Index.
SOURCE: Volpe, 2013.
with children experienced very low food security sometime during the year (Coleman-Jensen et al., 2013).
Food insecurity is determined by multiple variables. One of the most important is income; 40 percent of households with incomes lower than the federal poverty level are food insecure, while only 7 percent of households with income above 185 percent of the poverty level are food insecure (Coleman-Jensen et al., 2013). However, income is not the only factor in predicting food insecurity: households without liquid assets are much more likely to be food insecure, and income volatility is associated with food insecurity (Gundersen et al., 2011). Not surprisingly, housing instability is also a factor (Ma et al., 2008). Other characteristics that correlate with food insecure households are those headed by an African American, a Hispanic, a younger person, or a less educated person (Gundersen et al., 2011). Further analysis of data on food insecurity by the Economic Research Service found that three national-level economic measures—changes in unemployment, inflation, and the price of food—accounted for 92 percent of the year-to-year variation in the national prevalence of food insecurity from 2001 to 2012 (Nord et al., 2014).
Numerous studies have shown that food insecurity increases the risk of a range of health and psychosocial problems among children, adolescents, and adults (Gundersen and Kreider, 2009; Huang et al., 2010; Kirkpatrick et al., 2010; Nord, 2009; Seligman et al., 2007, 2010; Whitaker et al.,
2006). Children who are food insecure have increased risk of asthma, cognitive impairment, and behavioral problems; have lower math scores; and are twice as likely to repeat a grade and three times as likely to be suspended from school as children who are food secure (Alaimo et al., 2001). Teens who reported being food insecure were found to be twice as likely to suffer from depression and five times as likely to commit suicide as were food secure teens (Alaimo et al., 2002; Ashiabi, 2005). Food insecure adults have an increased risk of heart disease and depression or anxiety (Seligman et al., 2010; Whitaker et al., 2006) and, under the most severe levels of food insecurity, adults have more than twice the risk of diabetes compared to those who do not experience food insecurity (Seligman et al., 2007). Furthermore, diabetic individuals have more difficulties following a diabetic diet and need more medical attention if they are also food insecure (Nelson et al., 2001; Seligman et al., 2012). Due to these individual-level consequences, low food security also raises societal costs of providing education (e.g., due to higher educational investments needed when children are unable to learn because of food insecurity) and health care (Brown et al., 2007).
It is argued that food insecurity is a market failure that occurs when private markets do not provide enough food even when the benefits of providing it outweigh the social costs (Rocha, 2007). Food itself is a private good, but food security is a public good, so the government has stepped in to help alleviate some of the problem. Approximately 60 percent of food insecure households participate in one or more government nutrition or food programs (Feeding America, 2014b). These programs, such as the Supplemental Nutrition Assistance Program (SNAP), School Lunch Program (SLP), and the Special Supplemental Nutrition Program for Women, Infants, and Children (WIC), contribute to better food security for low-income households, increase revenue to producers and processors, and reduce expenditures on other public services (Kinsey, 2013). In 2013, more than 47 million individuals received SNAP benefits. About 70 percent of participants are families with children and more than 25 percent are households with seniors or people with disabilities (CBPP, 2014). In the same year, for the first time, working-age people made up the majority of households receiving benefits (Yen, 2014). It should be noted that the multiplier effect of SNAP is quite substantial. Taking into account direct and indirect effects, $1 billion of retail food expenditures by recipients generates $267 million in agricultural production, $87 million in value-added processing, and nearly 3,000 food and agricultural jobs (Hanson, 2010).
Even with their SNAP benefits, the typical food insecure households purchased significantly less food than did typical food secure households of the same size and composition in 2012 (Coleman-Jensen et al., 2013). Some of the difference can be explained by three critical barriers that con-
strain the ability of SNAP payments to guarantee good nutrition among low-income households: (1) a lack of time to prepare foods requires the purchase of value-added or prepared foods in many situations, (2) limited access to outlets (e.g., supermarkets and big box stores) in many areas hampers the ability to purchase nutritious foods at a reasonable cost, and (3) substantial variability in food prices by geographic region means that people living in high-cost areas benefit less from SNAP payments than do those in low-cost areas (IOM, 2013). In addition, the assumptions used to calculate food stamp benefits do not account for changes in other expenditures, such as those for housing, that have increased considerably over past decades, resulting in less money available to purchase adequate diets.
A corollary to food insecurity is limited food access, which has been defined as the inability to purchase nutritious, affordable foods within a prescribed distance from home. There are several different food access issues: a lack of supermarkets in low-income areas; a lack of transportation to supermarkets or superstores; and an abundance of smaller stores, which charge higher prices and carry few healthy foods (Ver Ploeg et al., 2009). This spatially complex phenomenon was first described in Great Britain as a “food desert” and defined variously as a situation where people live more than a certain distance from a supermarket and do not have access to a vehicle (Cummins and Macintyre, 1999). The findings from a study of the problem by a large team of researchers and policy analysts from several USDA agencies suggest that the term food desert is not accurate or useful in many cases (Ver Ploeg et al., 2009). In fact, USDA analysis found that access to a supermarket or a large grocery store is a problem for only a small percentage of low-income households in low-income areas (about 4 percent of the total U.S. population, many of them in rural areas). Also, low-income households shop where food prices are lower when they can. Eighty-two percent of SNAP benefits were redeemed at supermarkets or large grocery stores in 2012 (CBPP, 2014). More recent research has found that in many places around the United States, low-income urban neighborhoods have more grocery stores, supermarkets, and full-service restaurants, along with more fast food restaurants and convenience stores, than do affluent areas (Lee, 2012). However, these findings do not mean that the quality of food in stores in low-income areas is as high as in more affluent areas, and low-income households, especially very low-income families, do not face many barriers in procuring and preparing nutritious meals (Ver Ploeg et al., 2009).
Factors Influencing Food Purchase Decisions
Consumers are the end of the food chain, and their health and wellness is the primary reason food production is absolutely necessary in every
society, from a subsistence-livelihood household to the global community. A scan of the literature on contemporary food systems offers many elements that consumers desire from the food system, including a low risk of illness from the consumption of unsafe food, a wide availability of a variety of food choices, low price, foods that meet taste preferences, foods that offer various types of convenience, the ability to act on desires for foods produced in environmentally sound ways that have not unduly harmed natural resources, accessibility to culturally desired food products and ingredients, and access to innovative culinary trends. These indicators are reflected in both the research findings over many decades of the major determinants of food choices (Contento, 2010) and the responses made year after year to the IFIC Foundation’s nationally representative Food and Health Survey (IFIC, 2014a). In the most recent survey, in response to a question about what factors have a significant or great impact on a decision to buy foods and beverages, the first choice is taste (90 percent choosing this). The second is price (73 percent), then healthfulness (71 percent), convenience (51 percent), and sustainability (38 percent) (IFIC, 2014a). These factors are described below.
Taste
Humans are born with a predisposition to like sweet and to reject sour or bitter flavors, and over time, they develop preferences for salt and fat (Contento, 2010). However, these biologically inherent tastes are not determinative. People’s likings for specific foods are largely learned. With repeated consumption a preference for a novel food tends to increase. Therefore if children (or adults) are frequently exposed to foods that are high in sugar, fat, and salt, they will become familiar and preferred over foods that are relatively unfamiliar (Contento, 2010). These research findings explain in part the heightened concern about television advertising to children of foods of low nutritional quality that are high in fat, added sugars, and sodium. In 2009, food advertisers spent $1.8 billion on marketing to youth ages 2 to 17 (Powell et al., 2013). People tend to like calorie-dense foods, which would have been adaptive when such food was scarce but is maladaptive where food is readily available (Contento, 2010). Retraining the U.S. palate to expect and accept foods and beverages with less salt and sugar is under way by many food companies, but it progresses slowly (Kinsey, 2013). Nutrition educators have been engaged in related efforts for many decades, but with quite limited resources compared to those of the food industry (Contento, 2010).
Price
Food prices change frequently for a number of reasons. Between 1980 and 2010, CPIs were much lower compared to the CPI over time for carbonated drinks, nonalcoholic beverages, and whole milk, and they were quite a bit higher for all fruits and vegetables and even higher for fresh fruits and vegetables (Wendt and Todd, 2011). A study by researchers at USDA, however, shows that the prices of many staple fruits and vegetables have not had disproportionate price increases (Kuchler and Stewart, 2008). Furthermore, when measured on either a weight or a serving basis, healthy foods can cost less than less healthy foods—defined as being high in saturated fat, added sugars, and sodium, or contributing little to meeting dietary recommendations (Carlson and Frazão, 2012).
Complementing the data on price indexes is a review of multiple estimates of price elasticities calculated between 1938 and 2007 (Andreyeva et al., 2010). Price elasticity is defined as the percentage change in quantity purchased as a result of a 1 percent change in the price of a product. Over time, the highest price elasticities are for food away from home, soft drinks, juices, beef, and pork. The lowest price elasticities are for fats and oils, cheese, sweets and sugars, and eggs, suggesting that purchase of the latter foods are more resistant to price changes.
Older, higher-income consumers and men are less likely to be influenced by price than are younger, low-income consumers and women (IFIC, 2013). Just and Payne (2009) argue that most consumers are not very responsive overall to changes in price and income, but that they tend to be more responsive to changes (especially a lowering) in the price of foods high in fat, salt, and sugar. Lowenstein (2013) reports that between 1980 and 2000 the relative price of food fell nearly 15 percent, and processed food prices declined the most. He states that several economic reports assign most of the increase in obesity over that time to the increase in calorie intake that resulted from the change in prices (Lowenstein, 2013).
Healthfulness
Healthfulness includes nutritional value as well as food safety from microbial contamination or elements such as pesticide residues and other toxicants. In the most recent IFIC survey (IFIC, 2014a), the importance of healthfulness as a factor affecting food and beverage purchases increased significantly over the prior 2 years. Higher-income shoppers, on average, purchase slightly more healthful foods than do lower-income shoppers, but all subgroups fall far short of purchasing a food basket that meets USDA dietary guidelines (Volpe and Okrent, 2012). Women and older consumers are more likely to use healthfulness as a key factor in food purchasing.
However, few consumers understand health issues at more than a superficial level (Just, 2013), and they may choose many products that are not health enhancing. Manufacturers and marketers study and analyze models of consumer behavior, including deliberate and slow purchases versus those that are emotional and heuristic (Shiv and Fedorikhin, 1999). Manufacturers understand that consumers respond to a variety of factors, such as the price, the price of substitutes and complements, the number of calories, the size of a portion, the shape and color of containers, product placement, and others, and can make changes in their marketing approaches if they wish to do so (Just, 2013).
Convenience
Beginning in the 1950s, the growing presence of women in the workforce and other social and cultural changes created a demand for foods that would be easy to acquire and convenient and quick to prepare. Since then, convenience foods have become a staple feature of the food landscape. Convenience foods—defined as those processed foods that need little preparation, are preprepared, and are preserved for long-term storage—are popular among consumers because meal preparation requires little time and effort, and some are less expensive than their home-prepared counterparts (Kinsey, 2013). Consumers recognize that these foods are shelf stable and amenable to long-distance transportation and long-term storage in the home and other institutions (Kinsey, 2013). In the latest IFIC survey, three-quarters of respondents believe that processing can help food stay fresh longer; 63 percent believe they benefit from modern food production and processing, with the top two benefits being improved food safety and prolonged freshness (IFIC, 2014a).
Convenience foods also are popular among food manufacturers because these products are very high earners. For example, of the 10 most profitable food production categories in the United States, 6 are convenience/snack foods: snack foods; cookies, crackers, and pasta; chocolate; sugar processing; ice cream; and candy (Cohen, 2013). The majority of these foods are high in sugar, salt, saturated fat, or total fat, or they are of low nutrient density. Food companies are continually expanding their offerings of convenience foods through line extensions, new packaging, and some genuinely new products. The average number of new food and beverage products introduced to the market between 2006 and 2010 was 21,368 per year (ERS, 2013c). This proliferation of processed and convenience foods means that food corporations have increasingly shaped what and how consumers eat (Belasco and Scranton, 2002). Because the number of items in stores is so high, consumers must spend much more time in the store making decisions (Kinsey, 2013). Furthermore, consumers make more
than 200 food-related decisions every day, and often fall back on habits and perceptions or misperceptions that lead them to make poor choices (Wansink and Sobal, 2007).
Meeting the desire for convenience has also led to the rise of fast food outlets and the ubiquitous presence of food for sale in all types of stores and public places. In addition, busy lives mean that consumers are increasingly combining eating with other activities, such as working, driving, watching TV, and interacting with the Internet, e-mail, or phones (Kinsey, 2013), thus increasing the desire for foods that are convenient and easy to eat. These behaviors appear to have contributed to the obesity problem in the United States (Harvard School of Public Health, 2012).
One way to consider the growing importance of convenience in food choices is to examine the relative expenditures on food at home and food away from home. In 2012, the average share of total food expenditures spent on FAFH by U.S. households was 49.5 percent (see Chapter 2, Figure 2-3). Of the total dollars spent on food in the lowest-income households, 30 percent was spent on FAFH and 70 percent on FAH, while in the highest income quintile the expenditures were closer to 50 percent in each category (BLS, 2014a).
Between 1977-1978 and 2005-2008, the share of calorie intake from FAFH increased from 18 to 32 percent (Lin and Guthrie, 2012). In addition, the percentage of fat calories of FAH declined substantially compared to fat from FAFH during that time. The highest percentage of calories from saturated fat occurred in fast foods compared to the percentage in restaurant foods, school food, and FAH (Lin and Guthrie, 2012).
Concurrent with the increase in eating at restaurants and fast food establishments, the percentage of time spent on food preparation, along with the daily number of calories consumed from food eaten at home, decreased in all socioeconomic groups from 1965 to 2008 (Smith et al., 2013). The largest decline occurred between 1965 and 1992 and has leveled off since, but many Americans do not know how to cook anymore. Other research indicates that changes in time spent on preparing food may differ by income, for one study found that more than 60 percent of low-income consumers prepare main meals from scratch an average of four times per week (more often than do moderate-income families), and they use some forms of preprepared foods twice per week (Share Our Strength, 2012).
Sustainability
A loss of confidence in the safety and healthfulness of food (short term and long term), as well as the government’s apparent inability to ensure it, has led consumers to look for foods that espouse certain priorities, including organic production practices, humane treatment of animals and fish,
and many different sustainability practices (Kinsey, 2013). The percentage of consumers who claim to know something about sustainability has continued to rise and many say that sustainability is somewhat or very important to them (IFIC, 2014a). The aspects of sustainability reported as most important are conserving the natural habitat, ensuring an affordable and sufficient global food supply, and reducing the amount of pesticides (IFIC, 2014a). Another national survey (Cone Communications, 2014) has found that 77 percent of the U.S. population says that sustainability does factor into their food purchasing decisions. Thirty-five percent of consumers report that they purchase foods and beverages advertised as local, 32 percent buy foods and beverages labeled as organic, and 20 percent purchase foods and beverages in recycled or recyclable packaging, despite the price premium that is often attached to these products (IFIC, 2014b).
In 2011, 78 percent of U.S. adults were buying organic foods at least occasionally and 40 percent were buying more organic food than they had in the past year (OTA, 2011). Fruits and vegetables are approximately 35 percent of all organic food sales, and the preponderance is fresh produce (OTA, 2014). Organic food sales were $32 billion in 2013, equal to 4 percent of all sales of food at home (OTA, 2014). Studies have found that consumers who have higher levels of education are more likely to buy organic products than are less educated consumers, but other factors (e.g., race) do not have a consistent effect on purchasing organic products (Dimitri and Oberholtzer, 2009). For example, African Americans are somewhat less likely to purchase organic foods, but when they do they purchase much greater quantities than do white consumers (Stevens-Garmon et al., 2007).
Questions about the ability of organic agriculture to produce comparable food yields have persisted for many years. However, a large analysis, including almost 300 research comparisons between organic and nonorganic production around the world, shows that the yield indexes were similar between the two different production methods (Badgley et al., 2007). However, a recent comprehensive meta-analysis shows that, overall, organic yields are typically lower than conventional yields, with the differences depending on the site and systems characteristics (Seufert et al., 2012). The debate about this will continue as other analyses are completed on organic as well as other alternative/sustainable food production systems. The debate is important because using organic methods versus nonorganic practices involves trade-offs in other domains that should be explored. For example, choosing organic methods might result in lower productivity, but also in better outcomes in the health and environmental domains; these trade-offs are important but challenging to measure (e.g., see Chapter 7, Annex 4, “Nitrogen in Agroecosystems”). A comparison of multiple environmental effects measured in Europe demonstrated significant differences between organic and conventional systems: organic systems
were higher in soil organic matter and lower in energy use. Conventional systems were lower in nitrogen leaching, nitrous oxide emissions, and land use. The authors also report that most studies that compared biodiversity demonstrated lower impacts from organic farming (Tuomisto et al., 2012). The use of synthetic pesticides in nonorganic systems—to control or kill potential disease-causing organisms—pose a number of concerns for environmental health, including water quality impairment by pesticides in 90 percent of water bodies in the United States, in 80 percent of the fish that have been studied, and in 33 percent of major aquifers (U.S. Fish and Wildlife Service, 2014). Pesticides also are producing negative effects on endangered and threatened species and on pollinators (EPA, 2014).
Some consumers express concerns about the perceived loss of direct social and economic ties to local producers and business owners, an increasingly homogenized food retail environment, and lack of transparency in how food is produced and distributed. Local food, which has no generally accepted definition, is a small but growing sector in the United States. In 2008, local sales were $4.8 billion, or about 1.9 percent of total gross farm sales (Low and Vogel, 2011). Most sales are made in metropolitan areas, and in the Northeast and on the West Coast (Tropp, 2014). The majority of local food sales are made through intermediated commercial markets—less than 25 percent come from direct marketing, such as in farmers’ markets (Low and Vogel, 2011). About 75 percent of consumers consume locally produced food at least once per month, and almost 90 percent think local foods are very or somewhat important (Tropp, 2014). The motivations for local purchasing, according to a number of surveys, are freshness/superior quality, support for the local economy and local farms, and knowing the source of a product (Martinez et al., 2010).
Consumer concerns about sustainability have contributed to greater calls for corporate social responsibility among mainstream food supply chain firms. Corporate social responsibility (sustainability) programs aimed to improve social and environmental performance have led to significant (and largely unanticipated) changes in the practices of many food processors and retailers. Decisions by retail firms to demand certification of the use of sustainable production and business practices from their suppliers has become one of the most significant drivers of change in the modern U.S. food system.
COMPLEXITIES OF THE SOCIAL AND ECONOMIC EFFECTS
As this chapter shows, any food system configuration will generate positive and negative social and economic effects, and the selection of any of them will invariably result in various trade-offs that need to be compared. Comparing alternative configurations of the U.S. food system
is complicated by the fact that, for any one configuration, the various populations and industry sectors might be affected in different ways, both positively and negatively. For example, the efficiencies in the system that have reduced costs for the industry and food prices for consumers have had trade-offs, such as lost jobs and low food-worker wages. These complexities, then, have implications for the methodological approaches used to estimate effects, as it is challenging to tease apart multiple influences and determine the effects of combined exposures. In this section, we highlight some representative examples of the distributions of costs and benefits that occur within the social and economic dimensions as well as interactions that occur between this and the health and environmental dimensions.
Diversity of Impacts
Differences Across Social Groups
The social and economic effects explored in this chapter differentially affect individuals across sociodemographic groups. These disparities have been extensively documented, particularly regarding their effects on health (NIH/HHS, 2014). To appreciate the influence of sociodemographic factors—such as income, race, ethnicity, gender, and citizenship status—when exploring the social and economic effects of the food system, one must acknowledge the statistical correlation of race and ethnicity with socioeconomic status (SES, a construct measuring education, income, and occupation) (LaVeist, 2005). For example, SES tends to be lower among African Americans and Hispanic Americans than white Americans (LaVeist, 2005). In addition, racial residential segregation among the U.S. population has been linked to health and economic disparities (White et al., 2012; Williams and Collins, 2001). The social and economic effects and differences that result from education, occupational working conditions, income, or other factors are closely tied to where people live (LaVeist et al., 2011). Thus, along with the confounding effects of social factors, the geographic and community- or neighborhood-level effects are important to consider when understanding and determining the social and economic effects of the food system. As these effects are measured when applying the framework that the committee developed (see Chapter 4), it is important to at least acknowledge that these social and economic complexities exist and, when feasible, adequately account for them using appropriate statistical methods.
Regional and Global Differences in Impacts on Food Availability and Access
In 2012, the food system produced, on average, 3,688 calories per person per day in the United States (Economist Intelligence Unit, 2013) and approximately 2,700 calories per person per day, globally. As discussed above, this average availability is not distributed equally (Coleman-Jensen et al., 2013; Economist Intelligence Unit, 2013). The accessibility to and affordability of foods globally also is highly diverse. Approximately 842 million people are food insecure worldwide, but the level of insecurity varies substantially depending on the area of the world, with the majority of them living in developing areas (FAO, 2013). In addition, countries differ in the progress made over the years (FAO, 2013). The poverty level is well correlated with the prevalence of undernourishment (FAO, 2013), a factor that can create detrimental feedbacks. The Global Food Security Index (GFSI), created by the Economist Intelligence Unit in 2012, is a measure of food security across the three dimensions of affordability, availability, and use (quality and safety) that integrates 27 indicators.4 Measured by the GFSI, Asia/the Pacific and sub-Saharan Africa are the areas with the most food insecure people, by numbers and concentration, respectively (Economist Intelligence Unit, 2014).
On the other side of the spectrum are developed countries, namely, the United States and most northern European countries. In each country, the mechanisms for differences in the indicators are rooted in many circumstances related to social, political, and economic drivers that lead to poverty and food insecurity. However, against this background, food-related interventions in developed countries also can have important reverberations in other parts of the world, affecting the poor severely. For example, the global food crisis of 2008 stemmed in part from U.S. biofuels policies. The increase in food prices disproportionally affected some countries like Cambodia, a net importer of rice, where most citizens are net buyers who are already close to the poverty line. The increase in rice prices in 2007-2008 led many Cambodians to levels below the poverty line (Maltsoglou et al., 2010). In addition, the FAO reports that food producers, and especially small holders, are more vulnerable to price increases than are consumers.
Another indicator of global food security is the safety and quality of food. Compared to poorer countries, improvements in diversity and safety of the food supply in the developed world have resulted in much improvement in the adequacy of diets. In developing countries, however,
_____________
4 As an example, food affordability is measured by food consumption as a percentage of total household expenditure, proportion of the population living under the poverty line, GDP per capita, agricultural import tariffs, presence of food safety net programs, and access to financing for farmers.
micronutrient availability, protein quality, and diet diversification are more problematic (Economist Intelligence Unit, 2013). A recent paper warned about the increased similarity in diets worldwide being a threat to health and food security, as many countries, especially those less developed, are forsaking traditional crops in favor of a more narrow diversity of crop species (Khoury et al., 2014).
Regional Differences in Social and Economic Impacts of Structural Change
The impacts of structural changes in size and organization of firms in the food supply chain are not experienced equally in all places. In general, rural areas are disadvantaged and have a relatively difficult time adjusting to economic changes associated with industry integration, consolidation, and globalization. This is because their economies are less diversified, lack the agglomeration benefits of urban areas, and offer fewer options to individual employees or firm owners who are displaced by competitive forces. Rural areas are more expensive to service, and it is rare for more than one major retail grocery chain to be able to survive in one area, leading to lower levels of competition, less diverse offerings, and higher prices for many food products.
Different regions also have fared better or worse during recent periods of change. Areas with good soils, favorable climatic conditions, and well-developed agribusiness infrastructure have seen more rapid consolidation in farming and concentration of high-value production systems. Those with better proximity to urban markets have been better able to capitalize on the growth of local and regional food marketing opportunities. Trends that benefit particular commodities will provide benefits for regions that specialize or have competitive advantages in the production of those commodities. For example, the rapid rise of the corn ethanol market in the 2000s could result in significant gains for corn-producing areas but also drive up costs of production and reduced profitability in livestock production regions that had used corn as a major feed source.
Interactions Among Social, Economic, and Environmental Effects
There are many trade-offs between environmental outcomes and the level of profitability or efficiency across the food supply chain. In providing an abundant supply of inexpensive food, the U.S. food system also generates significant impacts on the environment. Conversely, efforts to address environmental problems associated with agricultural production are likely to increase costs to consumers and reduce production efficiencies. Not all gains in environmental performance come at the expense of efficiency,
however. For example, using nutrient inputs more efficiently (e.g., matching nutrient applications to crop needs more precisely) may reduce the risk of nutrient losses to the environment. The use of “precision agriculture” techniques can save producers some variable input costs and potentially reduce environmental damage, though rates of adoption have been slower than anticipated (Schimmelpfennig and Ebel, 2011).
Because agriculture is the dominant land use in most regions of the United States, the quality of life by rural residents can be affected by changes in production practices and cropping patterns. Traits of high-output, high-efficiency production systems (e.g., confinement agricultural operations or large-scale monoculture of field crops) can diminish landscape amenity qualities that make rural places desirable to nonagricultural residents. One environmental issue that is affecting producers and consumers alike is the diminished quantity and quality of water. Changes in water associated with farm production and food manufacturing have direct impacts on the cost and quality of water available to small town and urban residents (see also Chapter 3 on the interactions among social, economic, and health effects, and Chapter 7, Annex 4 for a detailed description of the trade-offs among crop productivity and environmental and health effects with different nitrogen management approaches).
Interactions Among Social, Economic, and Health Effects
Health, income, and SES are interrelated in multiple ways. On average, higher-income individuals live longer and are healthier than are lower-income individuals (Deaton and Paxson, 2001). This is in part because they spend more on safety (e.g., drive newer, bigger, safer cars; live in less polluted, safer neighborhoods) and may have better access to health care and insurance. Healthier individuals also may earn more because they lose fewer workdays to disability and illness and may have lower medical expenses, but this effect cannot explain the strength of the income–health relationship (Smith, 1999), nor can it explain the better health of children born to higher-income parents (Case et al., 2002). SES is related to health even after controlling for income (Marmot, 2002). One reason may be the adverse health effects of stress related to lack of control over one’s daily activities (e.g., a lower-status employee has less flexibility at work). Some of the associations between health and income and SES may also be related to education, as research shows that better educated individuals have better paying and safer jobs, a lower risk of chronic disease, positive health behaviors, and longer lives than do those with less education (RWJF, 2013).
METHODOLOGIES TO LINK THE FOOD SYSTEM WITH SOCIAL AND ECONOMIC EFFECTS
Determining the social and economic effects of the food system should involve the use of valid and reliable data measured at the necessary scale (e.g., national, regional, or local). However, several current data needs and gaps challenge the ability to accurately measure these effects. A more thorough discussion of the methods needed to comprehensively explore the effects of the food system is presented in Chapter 7. Here, we describe some of the key methodological issues that should be considered when measuring the social and economic effects of the food system.
Data Needs, Metrics, and Analytical Methodologies
To conduct an assessment of the social and economic effects of alternative configurations of the food system and propose interventions (see examples of interventions in Box 5-1), it is necessary to identify key metrics or indicators of social and economic effects. The broad categories outlined in Box 5-2 are well-documented examples of those metrics.
A wide range of food and agricultural data—including prices, costs, inputs, production levels, incomes, food availability, and environmental effects—are compiled by USDA and made available to the public by the National Agricultural Statistics Service and the Economic Research Service. Consumer food expenditures are available from annual surveys by the Bureau of Labor Statistics (BLS). A food prices database is available from USDA’s Center for Nutrition Policy and Promotion. Information on food producers is available from USDA surveys and Agricultural Census Data. The Agricultural Resource Management Survey tracks agricultural practices, including chemical and mechanical input use that affect agricultural productivity and environmental outcomes. Other federal agencies, including the BLS and the Centers for Disease Control and Prevention, collect data on occupational safety and health for workers across the food sector, although data are often at the industry level and not always by occupations. Appendix B includes information on where to find some of these key databases, as well as metrics to measure these effects.
However, many data gaps exist. Many of the current national datasets allow for aggregate estimates of economic and social outcomes, such as total number of workers, sector output, productivity, and profitability, especially for large-scale farms. Similar estimates are not easily generated for small-scale farms and by geography, over time, and for certain sectors due to lack of data. In addition, although some of the existing national datasets present data by key sociodemographic factors, such as race, ethnicity, gender, and immigration status, these measures are often lacking at the regional
BOX 5-1
Examples of Interventions with Social or Economic Effects
Policies
- Employment and Training program of the Farm Bill (Agricultural Act of 2014), which reallocates farm bill spending to emphasize rural community development over subsidies to farm operations.
- State minimum wage laws.
- Fair Labor Standards Act, which contains restrictions for minimum age for employment, the times of day youth may work, and the jobs they may perform.
- Government food assistance programs (e.g., SNAP [Supplemental Nutrition Assistance Program], WIC [Special Supplemental Nutrition Program for Women, Infants, and Children]).
- Nutrition Labeling and Education Act, which provides for the Nutrition Facts label to inform consumers about the nutrient content of packaged food products.
- Establishment of OSHA (Occupational Safety and Health Administration) in 1970 to ensure safe and healthful conditions for working men and women for some sectors.
- Immigration laws that might change the availability and cost of foreignborn workers for farm and food system employment.
- Labor laws that would increase protection of the health and safety of farm and food system workers.
- Antitrust regulation that ensure competitive marketing opportunities for independent livestock operators.
- Access to affordable health insurance through the ACA (Patient Protection and Affordable Care Act). (Does not apply to non-American citizens.)
- National Institute for Occupational Safety and Health (NIOSH) strategies to address the high risks of injuries and illness to agricultural workers, commercial fishers, and their families (e.g., efforts to conduct better surveillance of chemical-related exposures).
- NIOSH NORA (National Occupational Research Agenda) program that sets priorities for sector-specific workplace health and safety research to guide policy and practice.
Voluntary Programs
- Increased public investments in infrastructure and institutional support for emerging local food processing and marketing.
Education Efforts
- Nutritional information on the front of the product package to inform consumers about salient benefits of the products.
- NIOSH Education Research Centers and Agricultural and Safety Health Centers.
BOX 5-2
Selected Broad Categories of Metrics of Social and Economic Effects
Income, Wealth, and Equity
- Gross output (gross domestic product)
- Factor productivity
- Sector profitability
- Average net farm income
- Average and median household income
- Industry concentration
- Worker compensation
- Poverty rate
- Unemployment rate
Quality of Life
- Working conditions (hours, benefits, turnover, safety)
- Community well-being
- Entrepreneurship/managerial control (contracting, debt, vertical integration)
- Gender and racial equality
- Economic power (citizenship status, unionization)
- Occupational injury rates (nonfatal and fatal)
Food Availability
- Food costs and expenditures
- Food security
- Food access
- Food quality (taste, healthfulness, convenience, sustainability traits)
and local levels. Thus, the ability to produce stratified estimates by scale along with key sociodemographic factors for social and economic effects is also limited. As a result, when these measures are of interest, analyses often have to extrapolate findings from one scale to another to generate estimates of the effects. Furthermore, sometimes data are not even available to allow for extrapolation. For example, valid and reliable measures of variables that address some important social effects, such as a sense of well-being and career mobility opportunities, are lacking. These metrics are even more difficult to identify for immigrant populations, who are heavily represented among the farm worker population. Levels of income, wealth,
and distributional equity also are challenging to measure. These measures are almost always self-reported, and several datasets display a high degree of missing data for these variables because respondents consider the data too private or sensitive or they may not know their income (Davern et al., 2005). When data are missing, it is important to determine whether the data are missing at random and whether imputation techniques could be validly applied.
These gaps in existing data support a need to collect primary data using both quantitative methods (e.g., survey) and qualitative methods (e.g., focus groups and key informant interviews). Although primary data collection may be labor and resource intensive, collecting them is extremely valuable to fill data gaps as well as to add context to existing discrete secondary data. For example, in 2013, USDA published findings from in-depth interviews with SNAP households exploring their use of SNAP and overall food security (USDA, 2013). Many resources describe qualitative data collection and analysis, and investigators should review them before employing this methodology (Creswell, 2007; Miles and Huberman, 1994; Richards and Morse, 2012).
When it comes to consumers, information on freedom of choice to pursue taste and lifestyle preferences also are lacking from some datasets. However, methods that can be used to measure important economic principles have been published in numerous economics journals (Capps and Schmitz, 1991; Huang and Haidacher, 1983; Nelson, 1994; Phillips and Price, 1982; Reed and Levedahl, 2010; Reed et al., 2005; Richards and Padilla, 2009; Talukdar and Lindsey, 2013; Unnevehr et al., 2010). The economic theory of consumer behavior says that the quantity of a good (e.g., a food) will vary inversely with its price and directly with the consumer’s income. Price and income are the key variables in a consumer demand model typically analyzed using linear and nonlinear regression techniques—standard statistical tools. The quantity demanded is modeled as a function of price and income, along with other sociodemographic (e.g., gender, individual or household income) or environmental variables. Including these measures can help answer an important question when measuring economic effects: What is the percentage change in quantity that accompanies a 1 percent change in price or income? Demand analysis, a concept of market demand rather than individual behavior, is most useful in examining market trends and behavior. Time series datasets are typically used for this analysis. Appendix B provides a more detailed list of potential data, metrics, and methodologies.
Although price and income are useful variables, they do not entirely explain consumer food choices. Thus, analysts have used regression techniques to look at food consumption patterns and food choices/purchases/sales with numerous variables that may or may not include price and
income. These techniques provide insight into the degree of correlation that exists among variables, such as specific nutrient consumption and age, gender, or location. Because these models are not grounded in economic theory, they are not technically demand analysis, but they have been widely used to help understand how consumers choose food and how those choices affect their health and well-being. Data used for these models are typically cross-sectional measures on individual consumers or households and are usually collected by surveys. These types of data have several caveats, including recall bias that results in understatements of the amount of food eaten.
In addition to the traditional consumer demand and consumption studies, some investigators have conducted studies that use the theory of household economics, which incorporates “value of time” into the analysis (Andorka, 1987; Becker, 1965; Deaton and Paxson, 1998; Juster and Smith, 1997; Kinsey, 1983; Whitaker, 2009). This line of analysis, pioneered by Gary Becker, also has been used to study food consumption, as the amount of time required to obtain food is relevant to household food choices. The data used to analyze these models are almost always survey data on individual or household choice and behavior.
More recently, the theories of behavioral economics (Just and Wansink, 2009; Kahneman and Tversky, 1979; List, 2004; Riedl, 2010; Smith, 1985; Umberger and Feuz, 2004; Wansink, 2006) have informed the understanding of consumer choices of food. This is a combination of economics and psychology that improves the explanatory power of demand/consumption analysis by shedding light on why consumers make choices that appear irrational (e.g., they make choices that differ from what they say they want or for short-run gratification in the face of long-term harm). Prospect theory, which includes studies of how people manage risk and uncertainty, helps to inform this behavior.
One of the issues in analyzing food demand and food choices is a lack of data needed to answer many current questions. For example, to determine the correlates of obesity, detailed data about individual food consumption, food prices, and household characteristics as well as health habits and diseases is desirable. Rarely do all of these data on individuals occur in one dataset. A lack of secondary data is partly responsible for the growth of experimental economics, where researchers collect primary data through techniques such as auction games.5
Data for capturing effects of alternative food systems also are lacking. As research in this area has been limited, metrics related to the social and economic effects as they pertain to consumption patterns, workers, and production also are lacking. These data gaps may hamper the ability to
_____________
5 Auction games are situations in which actors independently bid on a commodity that is sold to the highest bidder.
measure the social and economic effects when proposals for alternative food systems are discussed.
The development and improvement of models to understand dynamics of farm and food markets and the behavior of key actors in the food supply chain are important in supporting efforts to assess the social and economic effects of changes in the food system. Food prices affect food access and choices, so they are hugely important to the food system. Prices change in response to supply and demand, especially in response to changes in policies, new technologies, and food industry structure. Market models simulate how supply and demand generate feedback for prices and quantities marketed. Some of these models have been adapted to predict not only price and food quantity effects but also likely greenhouse gas emissions due to land-use change. Two such computable general equilibrium models that simulate international trade and market effects are GTAP (Global Trade Analysis Project) and IMPACT (International Model for Policy Analysis of Agricultural Commodities and Trade), both included in Appendix B, Table B-4. The Forest and Agricultural Sector Optimization Model (FASOM) (Schneider et al., 2007) is a computable partial equilibrium model that simulates the agricultural and forest sector in greater detail than the other two, but it does not model feedbacks with the nonagricultural parts of the world economy. The Food and Agricultural Policy Research Institute maintains a proprietary econometric partial equilibrium simulation model that is used to generate detailed price and market forecasts based on current policy and market conditions (Meyers et al., 2010).
Standards of Evidence
Randomized controlled trials (RCTs) are limited in research on the social and economic effects of the food system. Nearly all social science research uses observational study designs, although in some instances, cluster randomized trials are used to explore differences by settings (e.g., schools). Because observational and even quasi-experimental studies are more the norm, social science scholars have posed questions about finding reliable evidence on a program or intervention, and about what the standard of evidence should be (Boruch and Rui, 2008; Flay et al., 2005). Over the past 2 years, a number of organizations have been created to develop an evidence grading scheme across various social science disciplines, including the Society for Prevention Research Committee on Standards and the What Works Clearinghouse of the U.S. Department of Education (Boruch and Rui, 2008).
The Campbell Collaboration was created in 2000 as “the younger sibling” to the Cochrane Collaboration, which was created in 1993 to review studies on the effectiveness of health and health care interventions
(Boruch and Rui, 2008). The Campbell Collaboration focuses on reviews from the social sciences. Unlike the Cochrane Collaboration, which tends to include RCTs, the Campbell Collaboration importantly admits quasi-experimental studies in its evidence standards. This presents an opportunity for additional reviews of the social science literature on relevant areas of the food system. Currently, reviews of the evidence on the role of farmer’s wealth and food security, land property rights, and water and sanitation are included in the Campbell Collaboration database (Campbell Collaboration, 2014).
Opportunities for Improvement
Many valuable and widely used national datasets are being eliminated or modified, or are at risk for being eliminated, because of funding limitations. Although a full description of these databases and the extent of the cuts is beyond the scope of this section, several databases that include important metrics for assessing agriculture and food systems are being reduced in length, changing methodology for sampling, or increasing time between data collection, all as part of cost-saving measures. Several reasons support maintaining these databases, including the tremendous benefits of surveillance. Surveillance data allow for monitoring of trends over time, determining changes in risks and outcomes to inform priority setting, developing targeted policies and programs, and evaluating interventions. Efforts to enhance funding to sustain these important national data systems should emphasize the value and necessity of data for evidence-informed decision making.
SUMMARY
As a substantial contributor to the larger bioeconomy, the U.S. food system carries social and economic effects that are both positive and negative. This chapter briefly describes a selected number of social and economic effects that can be partly attributed to the food system and that are mediated by policy contexts and responses. The effects were categorized into (1) levels of income, wealth, and distributional equity; (2) quality of life; and (3) worker health and well-being. To aid in the design of interventions that minimize negative consequences, approaches that consider these important effects, along with their distributions and interactions, are needed. For example: What are the impacts of a specific policy on overall economic wealth and income and the distribution of wealth and income? What are the impacts on worker well-being? What are the impacts on rural communities? Which subsectors of the food system will gain or lose? How will working conditions and employment opportunities for workers in different
sectors of the food system be affected? How will the cost and availability of food for consumers be affected? The analytical framework proposed in Chapter 7 is designed to ensure that the broad implications of these questions can be examined.
REFERENCES
Alaimo, K., C. M. Olson, and E. A. Frongillo. 2001. Food insufficiency and American school-aged children’s cognitive, academic, and psychosocial development. Pediatrics 108(1):44-53.
Alaimo, K., C. M. Olson, and E. A. Frongillo. 2002. Family food insufficiency, but not low family income, is positively associated with dysthymia and suicide symptoms in adolescents. Journal of Nutrition 132(4):719-725.
Alston, J. M., J. M. Beddow, and P. G. Pardey. 2009. Agriculture. Agricultural research, productivity, and food prices in the long run. Science 325(5945):1209-1210.
Andorka, R. 1987. Time budgets and their uses. Annual Review of Sociology 13:149-164.
Andreyeva, T., M. W. Long, and K. D. Brownell. 2010. The impact of food prices on consumption: A systematic review of research on the price elasticity of demand for food. American Journal of Public Health 100(2):216-222.
Artz, G. M. 2012. Immigration and meatpacking in the Midwest. Choices 27(2)1-5.
Ashiabi, G. 2005. Household food insecurity and children’s school engagement. Journal of Children and Poverty 11:1, 3-17.
Badgley, C., J. Moghtader, E. Quintero, E. Zakem, M. J. Chappell, K. Aviles-Vazquez, A. Samulon, and I. Perfecto. 2007. Organic agriculture and the global food supply. Renewable Agriculture and Food Systems 22(2):86-108.
Bail, K. M., J. Foster, S. G. Dalmida, U. Kelly, M. Howett, E. P. Ferranti, and J. Wold. 2012. The impact of invisibility on the health of migrant farmworkers in the southeastern United States: A case study from Georgia. Nursing Research and Practice 2012:760418.
Banks, V. J. 1986. Black farmers and their farms. Rural Development Research Report No. 59. Washington, DC: U.S. Department of Agriculture, Economic Research Service.
Barlett, P. F. 1993. American dreams, rural realities: Family farms in crisis. Chapel Hill, NC: University of North Carolina Press.
Becker, G. S. 1965. A theory of the allocation of time. Economic Journal 75(299):493-517.
Belasco, W., and P. Scranton. 2002. Food nations: Selling taste in consumer societies. New York: Routledge.
BLS (Bureau of Labor Statistics). 2010. Food for thought. Spotlight on statistics. November. http://www.bls.gov/spotlight/archive.htm (accessed February 11, 2014).
BLS. 2012. Consumer expenditure survey. Table 1202. Income before taxes: Annual expenditure means, shares, standard errors, and coefficient of variation. http://www.bls.gov/cex/2012/combined/income.pdf (accessed November 21, 2014).
BLS. 2013. Labor force statistics from the Current Population Survey. Table 39: Median weekly earnings of full-time wage and salary workers by detailed occupation and sex. http://www.bls.gov/cps/cpsaat39.htm (accessed November 24, 2014).
BLS. 2014a. Consumer expenditure survey. Table 1101. Quintiles of income before taxes: Annual expenditure means, shares, standard errors, and coefficient of variation, Consumer Expenditure Survey, 2012. http://www.bls.gov/cex/2012/combined/quintile.pdf (accessed November 21, 2014).
BLS. 2014b. Occupational outlook handbook, 2014-15 edition. http://www.bls.gov/ooh (accessed February 2, 2014).
BLS. 2014c. Union members–2013. News Release USDL-14-0095. http://www.bls.gov/news.release/pdf/union2.pdf (accessed November 21, 2014).
Boruch, R., and N. Rui. 2008. From randomized controlled trials to evidence grading schemes: Current state of evidence-based practice in social sciences. Journal of Evidence Based Medicine 1(1):41-49.
Brown, J. L., D. Shepard, T. Martin, and J. Orwat. 2007. The economic cost of domestic hunger. Sodexo Foundation. http://www.sodexofoundation.org/newsletter/pdf/economic_cost_of_domestic_hunger.pdf (accessed November 22, 2014).
Calvert, G. M., J. Karnik, L. Mehler, J. Beckman, B. Morrissey, J. Sievert, R. Barrett, M. Lackovic, L. Mabee, A. Schwartz, Y. Mitchell, and S. Moraga-McHaley. 2008. Acute pesticide poisoning among agricultural workers in the United States, 1998-2005. American Journal of Industrial Medicine 51(12):883-898.
Campbell Collaboration. 2014. The Campbell Collaboration library of systematic reviews. http://www.campbellcollaboration.org/lib (accessed November 22, 2014).
Capps, O., and J. D. Schmitz. 1991. A recognition of health and nutrition factors in food demand analysis. Western Journal of Agricultural Economics 16(1):21-35.
Carlson, A., and E. Frazão. 2012. Are healthy foods really more expensive?: It depends on how you measure the price. Economic Information Bulletin No. 96. Washington, DC: U.S. Department of Agriculture, Economic Research Service.
Case, A., D. Lubotsky, and C. Paxson. 2002. Economic status and health in childhood: The origins of the gradient. American Economic Review 92(5):1308-1334.
CBPP (Center on Budget and Policy Priorities). 2014. Policy basics: Introduction to SNAP. http://www.cbpp.org/cms/index.cfm?fa=view&id=2226 (accessed November 15, 2014).
CDC (Centers for Disease Control and Prevention). 2014a. For food handlers. Norovirus and working with food. http://www.cdc.gov/norovirus/food-handlers/work-with-food.html (accessed February 11, 2014).
CDC. 2014b. The National Institute for Occupational Safety and Health (NIOSH). http://www.cdc.gov/niosh (accessed February 11, 2014).
CDC. 2014c. Young worker safety and health. http://www.cdc.gov/niosh/topics/youth (accessed February 11, 2014).
CDC/NIOSH (CDC/National Institute for Occupational Safety and Health). 2014. Motor vehicle safety. http://www.cdc.gov/niosh/topics/motorvehicle (accessed November 22, 2014).
Chung, C., and E. Tostao. 2012. Effects of horizontal consolidation under bilateral imperfect competition between processors and retailers. Applied Economics 44(26):3379-3389.
Cochrane, W. W. 1993. The development of American agriculture: A historical analysis, 2nd ed. Minneapolis, MN: University of Minnesota Press.
Cohen, J. 2013. Food industries’ healthy margins. http://www.ibisworld.com/media/wp-content/uploads/2013/05/Food-Industries.pdf (accessed November 22, 2014).
Coleman-Jensen, A., M. Nord, and A. Singh. 2013. Household food security in the United States in 2012. Economic Research Report No. ERR-155. Washington, DC: U.S. Department of Agriculture, Economic Research Service.
Cone Communications. 2014. Food issues trend tracker. http://www.conecomm.com/2014-food-issues (accessed November 22, 2014).
Contento, I. 2010. Nutrition education: Linking research, theory, and practice, 2nd ed. Sud-bury, MA: Jones and Bartlett.
Creswell, J. W. 2007. Qualitative inquiry and research design. Choosing among five approaches, 2nd ed. Thousand Oaks, CA: Sage Publications, Inc.
Cummins, S., and S. Macintyre. 1999. The location of food stores in urban areas: A case study in Glasgow. British Food Journal 101:545-553.
Davern, M., H. Rodin, T. J. Beebe, and K. T. Call. 2005. The effect of income question design in health surveys on family income, poverty and eligibility estimates. Health Services Research 40(5):1534-1552.
Deaton, A., and C. Paxson. 1998. Economies of scale, household size, and the demand for food. Journal of Political Economy 106(5):897-930.
Deaton, A., and C. Paxson. 2001. Mortality, education, income and inequality among American cohorts. NBER Working Paper No. 7140. In Themes in the economics of aging, edited by D. A. Wise. Chicago, IL: University of Chicago Press. Pp. 129-165.
Deller, S. C., T. H. Tsai, D. W. Marcouiller, and D. B. K. English. 2001. The role of amenities and quality of life in rural economic growth. American Journal of Agricultural Economics 83(2):352-365.
Dimitri, C., and L. Oberholtzer. 2009. Marketing U.S. organic foods: Recent trends from farms to consumers. Economic Information Bulletin No. EIB-58. Washington, DC: U.S. Department of Agriculture, Economic Research Service.
Drabenstott, M. 2000. A new structure for agriculture: A revolution for rural America. Journal of Agribusiness 18(1):61-70.
Economist Intelligence Unit. 2013. Global food security index 2013: An annual measure of the state of global food security. http://foodsecurityindex.eiu.com/Resources (accessed November 18, 2014).
Economist Intelligence Unit. 2014. Global food security index. http://foodsecurityindex.eiu.com/ (accessed November 18, 2014).
Edmonson, W. 2004. Economics of the food and fiber system. Amber Waves. http://www.ers.usda.gov/amber-waves/2004-february/data-feature.aspx#.VFjiC8lNc3g (accessed November 22, 2014).
EPA (U.S. Environmental Protection Agency). 2014. Protecting bees and other pollinators from pesticides. http://www2.epa.gov/pollinator-protection (accessed November 22, 2014).
ERS (Economic Research Service). 1996. Farmers’ use of marketing and production contracts. Agricultural Economic Report No. (AER-747). http://www.ers.usda.gov/publications/aeragricultural-economic-report/aer747.aspx (accessed January 6, 2015).
ERS. 2013a. Ag and food statistics: Charting the essentials. http://www.ers.usda.gov/publications/ap-administrative-publication/ap062.aspx#.Uvo0oPvwv3s (accessed February 11, 2014).
ERS. 2013b. Farm labor. Background. http://www.ers.usda.gov/topics/farm-economy/farm-labor/background.aspx#.VEfDWxbYetM (accessed October 22, 2014).
ERS. 2013c. New products. http://www.ers.usda.gov/topics/food-markets-prices/processing-marketing/new-products.aspx (accessed November 22, 2014).
ERS. 2014a. Agricultural productivity in the U.S. Overview. http://www.ers.usda.gov/data-products/agricultural-productivity-in-the-us.aspx#.U_-SjWPkpQB (accessed November 24, 2014).
ERS. 2014b. Farm household income (historical). http://www.ers.usda.gov/topics/farm-economy/farm-household-well-being/farm-household-income-%28historical%29.aspx#.Uvl3pPvcjTp (accessed February 10, 2014).
ERS. 2014c. Food and beverage manufacturing. http://www.ers.usda.gov/topics/food-markets-prices/processing-marketing/manufacturing.aspx#.VEcFNEtd09c (accessed November 4, 2014).
ERS. 2014d. Food expenditures. http://www.ers.usda.gov/data-products/food-expenditures.aspx (accessed November 24, 2014).
ERS. 2014e. Indicator table. March 14, 2014. http://www.ers.usda.gov/amber-waves/2014-march/indicator-table.aspx#.VFjoypV0y71 (accessed November 4, 2014).
ERS. 2014f. Manufacturing. http://www.ers.usda.gov/topics/food-markets-prices/processing-marketing/manufacturing.aspx#.Uvowa_vwv3t (accessed February 11, 2014).
ERS. 2014g. Market segments. http://www.ers.usda.gov/topics/food-markets-prices/food-service-industry/market-segments.aspx#.Uvo36_vwv3t (accessed February 11, 2014).
ERS. 2014h. Policy issues. http://www.ers.usda.gov/topics/food-markets-prices/retailing-wholesaling/policy-issues.aspx#.UvowI_vwv3t (accessed February 11, 2014).
ERS. 2014i. U.S. and state farm income and wealth statistics. http://ers.usda.gov/data-products/farm-income-and-wealth-statistics.aspx#.Uvl1r_vcjTo (accessed February 10, 2014).
ERS. 2014j. Wealth, farm programs, and health insurance. http://www.ers.usda.gov/topics/farm-economy/farm-household-well-being/wealth,-farm-programs,-and-health-insurance.aspx#.Uvl7ZPvcjTp (accessed February 10, 2014).
FAO (Food and Agriculture Organization of the United Nations). 2013. The state of food insecurity in the world 2013. The multiple dimensions of food security. Rome, Italy: FAO.
Farmworker Justice. 2009. State workers’ compensation coverage for agricultural workers. http://www.farmworkerjustice.org/sites/default/files/documents/6.3.a.1State_Workers_Comp_Information_for_Health_Centers_11-09.pdf (accessed February 10, 2014).
FCWA (Food Chain Workers Alliance). 2012. The hands that feed us: Challenges and opportunities for workers along the food chain. Los Angeles, CA: FCWA.
Feeding America. 2013. Solving hunger together. 2013 annual report summary. http://www.feedingamerica.org/our-response/about-us/annual-report (accessed October 28, 2014).
Feeding America. 2014a. About us. http://feedingamerica.org/how-we-fight-hunger/about-us.aspx (accessed November 23, 2014).
Feeding America. 2014b. Hunger and poverty fact sheet. http://www.feedingamerica.org/hunger-in-america/impact-of-hunger/hunger-and-poverty/hunger-and-poverty-fact-sheet.html (accessed November 23, 2014).
Fernandez-Cornejo, J. 2007. Off-farm income, technology adaptation, and farm income performance. Economic Research Report No. ERR-36. Washington, DC: U.S. Department of Agriculture, Economic Research Service.
Findeis, J. L., A. M. Vandeman, J. M. Larson, and J. L. Runyan. 2002. The dynamics of hired farm labour: Constraints and community responses. New York: CABI Publishing.
Flay, B. R., A. Biglan, R. F. Boruch, F. G. Castro, D. Gottfredson, S. Kellam, E. K. Moscicki, S. Schinke, J. C. Valentine, and P. Ji. 2005. Standards of evidence: Criteria for efficacy, effectiveness and dissemination. Prevention Science 6(3):151-175.
Flora, C. B. 1995. Social capital and sustainability: Agriculture and communities in the Great Plains and Corn Belt. Research in Rural Sociology and Development 6(6):227-246.
FMI (Food Marketing Institute). 2013. Grocery store chains net profit—Percent of sales. http://www.fmi.org/docs/default-source/facts-figures/grocery-store-chains-net-profit_2013.pdf?sfvrsn=2 (accessed November 23, 2014).
Foltz, J., and K. Zeuli. 2005. The role of community and farm characteristics in farm input purchasing patterns. Review of Agricultural Economics 27(4):508-525.
Foltz, J. D., D. Jackson-Smith, and L. Chen. 2002. Do purchasing patterns differ between large and small dairy farms? Econometric evidence from three Wisconsin communities? Agricultural and Resource Economics Review 31(1):28-38.
Fortune magazine. 2014. 2014 top U.S. companies (Fortune 500 and 100 best companies to work for). http://money.cnn.com/magazines/fortune/fortune500/2013/full_list/index.html?iid=F500_sp_full (accessed November 23, 2014).
Fraser, C. E., K. B. Smith, F. Judd, J. S. Humphreys, L. J. Fragar, and A. Henderson. 2005. Farming and mental health problems and mental illness. International Journal of Social Psychiatry 51(4):340-349.
Free Library, The. 2014. Ergonomics in the warehouse. http://www.thefreelibrary.com/Ergonomics+in+the+warehouse%3a+warehouse+workers+face+the+highest+rates…-a092082589 (accessed February 11, 2014).
Freire, C., and S. Koifman. 2013. Pesticides, depression and suicide: A systematic review of the epidemiological evidence. International Journal of Hygiene and Environmental Health 216(4):445-460.
Fuglie, K., and P. Heisey. 2007. Economic returns to public agricultural research. Economic Brief No. EB-10. Washington, DC: U.S. Department of Agriculture, Economic Research Service.
Fuglie, K., P. Heisey, J. King, and D. Schimmelfennig. 2012. Rising concentration in agricultural input industries influences new farm technologies. Amber Waves 10(4):1-6.
Gardner, B. L. 2002. American agriculture in the twentieth century: How it flourished and what it cost. Cambridge, MA: Harvard University Press.
Gasson, R., and A. J. Errington. 1993. The farm family business. Wallingford, UK: CAB International.
Geiser, K., and B. J. Rosenberg. 2006. The social context of occupational and environmental health. In Occupational and environmental health: Recognizing and preventing disease and injury, edited by B. S. Levy, D. H. Wegman, S. L. Baron, and R. K. Sokas. Philadelphia, PA: Lippincott Williams & Wilkins. Pp. 21-39.
Goldschmidt, W. 1978. As you sow: Three studies in the social consequences of agribusiness. Montclair, NJ: Allanheld, Osmun, and Co.
Gundersen, C., and B. Kreider. 2009. Bounding the effects of food insecurity on children’s health outcomes. Journal of Health Economics 28:971-983.
Gundersen, C., B. Kreider, and J. Pepper. 2011. The economics of food insecurity in the United States. Applied Economic Perspectives and Policy 33(3):281-303.
Hall, M., and E. Greenman. 2014. The occupational cost of being illegal in the United States: Legal status, job hazards, and compensating differentials. International Migration Review. http://onlinelibrary.wiley.com/doi/10.1111/imre.12090/pdf (accessed November 23, 2014).
Hanson, K. 2010. The Food Assistance National Input-Output Multiplier (FANIOM) model and the stimulus effects of SNAP. Economic Research Report No. ERR-103. Washington, DC: U.S. Department of Agriculture, Economic Research Service.
Harvard School of Public Health. 2012. TV watching and “Sit Time.” http://www.hsph.harvard.edu/obesity-prevention-source/obesity-causes/television-and-sedentary-behavior-and-obesity (accessed November 24, 2014).
Henderson, R. 2012. Industry employment and output projections to 2020. Monthly Labor Review 135(1):65-83.
HHS (U.S. Department of Health and Human Services). 2014. Poverty guidelines. http://aspe.hhs.gov/poverty/14poverty.cfm (accessed March 6, 2014).
Hoppe, R. A., and P. Korb. 2013. Characteristics of women farm operators and their farms. Economic Information Bulletin No. 111. Washington, DC: U.S. Department of Agriculture, Economic Research Service.
Hoppe, R., J. MacDonald, and P. Korb. 2010. Small farms in the United States: Persistence under pressure. Economic Information Bulletin No. EIB-63. Washington, DC: U.S. Department of Agriculture, Economic Research Service.
HRSA (Health Resources and Services Administration). 2014. HPSA designation criteria. http://bhpr.hrsa.gov/shortage/hpsas/designationcriteria/designationcriteria.html (accessed February 10, 2014).
Huang, J., K. M. Mata Oshima, and Y. Kim. 2010. Does household food insecurity affect parenting and children’s behaviors? Evidence from the Panel Study of Income Dynamics (PSID). Social Service Review 84(3):381-401.
Huang, K. S., and R. C. Haidacher. 1983. Estimation of a composite food demand system for the United States. Journal of Business and Economic Statistics 1(4):285-291.
IFIC (International Food Information Council Foundation). 2013. 2013 Food and Health Survey. Consumer attitudes toward food safety, nutrition and health. http://www.foodinsight.org/articles/2013-food-and-health-survey (accessed November 24, 2014).
IFIC. 2014a. 2014 Food and Health Survey. Consumer attitudes toward food safety, nutrition and health. http://www.foodinsight.org/articles/2014-food-and-health-survey (accessed November 24, 2014).
IFIC. 2014b. 2014 IFIC consumer perceptions of Food Technology Survey. http://www.foodinsight.org/2014-foodtechsurvey (accessed November 24, 2014).
IOM (Institute of Medicine). 2013. Supplemental Nutrition Assistance Program: Examining the evidence to define benefit adequacy. Washington, DC: The National Academies Press.
Isserman, A. M., E. Feser, and D. E. Warren. 2009. Why some rural places prosper and others do not. International Regional Science Review 32(3):300-342.
Jones, C., T. Parker, M. Ahearn, A. Mishra, and J. Variyam. 2009a. Health status and healthcare access of farm and rural populations. Economic Information Bulletin No. EIB-57. Washington, DC: U.S. Department of Agriculture, Economic Research Service.
Jones, C., T. Parker, and M. Ahearn. 2009b. Taking the pulse of rural health care. Amber Waves September 1.
Just, D. 2013. Consumer preferences and marketing as drivers of the food system. Paper presented at the Institute of Medicine/National Research Council Committee on a Framework for Assessing the Health, Environmental, and Social Effects of the Food System Meeting, Washington, DC, September 16.
Just, D. R., and C. R. Payne. 2009. Obesity: Can behavioral economics help? Annals of Behavioral Medicine 38(Suppl 1):S47-S55.
Just, D. R., and B. Wansink. 2009. Smarter lunchrooms: Using behavioral economics to improve meal selection. Choices 24(3):1-7.
Juster, F. T., and J. P. Smith. 1997. Improving the quality of economic data: Lessons from the HRS and AHEAD. Journal of the American Statistical Association 92(440):1268-1278.
Kahneman, D., and A. Tversky. 1979. Prospect theory—Analysis of decision under risk. Econometrica 47(2):263-291.
Kandel, W. 2008. Profile of hired farmworkers. A 2008 update. Economic Research Report No. ERR-60. Washington, DC: U.S. Department of Agriculture, Economic Research Service.
Kelly, M., H. Lang, G. Bhandal, and C. Electris. 2012. Worker and social equity in food and agriculture. Practices at the 100 largest and most influential U.S. companies. Boston, MA: Tellus Institute and Sustainalytics.
Key, N., and W. D. McBride. 2007. The changing economics of U.S. hog production. Economic Research Report ERR-52. Washington, DC: U.S. Department of Agriculture, Economic Research Service.
Khoury, C. K., A. D. Bjorkman, H. Dempewolf, J. Ramirez-Villegas, L. Guarino, A. Jarvis, L. H. Rieseberg, and P. C. Struik. 2014. Increasing homogeneity in global food supplies and the implications for food security. Proceedings of the National Academy of Sciences of the United States of America 111(11):4001-4006.
Kilkenny, M. 2010. Urban/regional economics and rural development. Journal of Regional Science 50(1):449-470.
King, R. P., M. Anderson, G. DiGiacomo, D. Mulla, and D. Wallinga. 2012. State level food system indicators. http://foodindustrycenter.umn.edu/Research/foodsystemindicators/index.htm (accessed November 24, 2014).
Kinsey, J. 1983. Working wives and the marginal propensity to consume food away from home. American Journal of Agricultural Economics 65(1):10-19.
Kinsey, J. 2013. Expectations and realities of the food system. In U.S. programs affecting food and agricultural marketing, edited by W. J. Armbruster and R. Knutson. New York: Springer Science + Business Media. Pp. 11-42.
Kirkpatrick, S., L. McIntyre, and M. L. Potestio. 2010. Child hunger and long-term adverse consequences for health. Archives of Pediatric and Adolescent Medicine 164(8):754-762.
Kuchler, F., and H. Stewart. 2008. Price trends are similar for fruits, vegetables, and snack foods. Economic Research Report No. ERR-55. Washington, DC: U.S. Department of Agriculture, Economic Research Service.
Kuhn, M. E. 2014. Salaries back on track. Food Technology 68(2):22-30.
Labao, L., and C.W. Stofferahn. 2008. The community effects of industrialized farming: Social science research and challenges to corporate farming laws. Agriculture and Human Values 25:219-240.
Lambert, D., T. Wojan, and P. Sullivan. 2009. Farm business and household expenditure patterns and local communities: Evidence from a national farm survey. Review of Agricultural Economics 31(3):604-626.
LaVeist, T. A. 2005. Disentangling race and socioeconomic status: A key to understanding health inequalities. Journal of Urban Health 82(2 Suppl 3):iii26-iii34.
LaVeist, T., K. Pollack, R. Thorpe, Jr., R. Fesahazion, and D. Gaskin. 2011. Place, not race: Disparities dissipate in southwest Baltimore when Blacks and whites live under similar conditions. Health Affairs (Millwood) 30(10):1880-1887.
Lawrence, J. D. 2010. Hog marketing practices and competition. Choices 25(2):1-11.
Lee, H. 2012. The role of local food availability in explaining obesity risk among young school-aged children. Social Science and Medicine 74(8):1-11.
Leonard, C. 2014. The meat racket. New York: Simon & Schuster.
Lin, B.-H., and J. Guthrie. 2012. Nutritional quality of food prepared at home and away from home, 1977-2008. Economic Information Bulletin No. EIB-105. Washington, DC: U.S. Department of Agriculture, Economic Research Service.
List, J. A. 2004. Neoclassical theory versus prospect theory: Evidence from the marketplace. Econometrica 72(2):615-625.
Liu, Y. Y. 2012. Good food + good jobs for all. Challenges and opportunities to advance racial and economic equity in the food system. New York: Applied Research Center.
Low, S. A., and S. Vogel. 2011. Direct and intermediated marketing of local foods in the United States. Economic Research Report No. ERR-128. Washington, DC: U.S. Department of Agriculture, Economic Research Service.
Lowenstein, G. 2013. Behavioral economics: Implications for the food environment and choices. In Sustainable diets: Food for healthy people in a healthy planet: Workshop summary. Washington, DC: The National Academies Press. Pp. 108-116.
Ludwig, D. S., and H. A. Pollack. 2009. Obesity and the economy: From crisis to opportunity. Journal of the American Medical Association 301(5):533-535.
Lyson, T. 2004. Civic agriculture: Reconnecting farm, food, and community. Medford, MA: Tufts University Press.
Ma, C. T., L. Gee, and M. B. Kushel. 2008. Associations between housing instability and food insecurity with health care access in low-income children. Ambulatory Pediatrics 8(1):50-57.
MacDonald, J. M. 2008. The economic organization of U.S. broiler production. Economic Information Bulletin No. EIB-38. Washington, DC: U.S. Department of Agriculture, Economic Research Service.
MacDonald, J. M., and P. Korb. 2008. Agricultural contracting update, 2005. Economic Information Bulletin No. EIB-35. Washington, DC: U.S. Department of Agriculture, Economic Research Service.
MacDonald, J. M., and P. Korb. 2011. Agricultural contracting update: Contracts in 2008. Economic Information Bulletin No. EIB-72. Washington, DC: U.S. Department of Agriculture, Economic Research Service.
MacDonald, J. M., and W. D. McBride. 2009. The transformation of U.S. livestock agriculture: Scale, efficiency, and risks. Economic Information Bulletin No. EIB-43. Washington, DC: U.S. Department of Agriculture, Economic Research Service.
Maltsoglou, I., D. Dawe, and L. Tasciotti. 2010. Household level impacts of increasing food prices in Cambodia. Rome, Italy: The Bioenergy and Food Security Project, FAO.
Marion, B. W. 1986. The organization and performance of the U.S. food system. Lexington, MA: D.C. Heath.
Marion, B., and F. E. Geithman. 1995. Concentration-price relations in regional fed cattle markets. Review of Industrial Organization 10:1-19.
Marmot, M. 2002. The influence of income on health: Views of an epidemiologist. Health Affairs 21(2):31-46.
Martin, P. 2009. Importing poverty?: Immigration and the changing face of rural America. New Haven, CT: Yale University Press.
Martin, P. 2013. Immigration and farm labor: Policy options and consequences. American Journal of Agricultural Economics 95(2):470-475.
Martin, P., and D. Jackson-Smith. 2013. Immigration and farm labor in the U.S. National Agricultural and Rural Development Policy Center Policy Brief 4. http://www.nardep.info/uploads/Brief_FarmWorker.pdf (accessed November 24, 2014).
Martinez, S., M. S. Hand, M. Da Pra, S. Pollack, K. Ralston, T. Smith, S. Vogel, S. Clark, L. Tauer, L. Lohr, S. A. Low, and C. Newman. 2010. Local food systems: Concepts, impacts, and issues. Economic Research Report No. ERR-97. Washington, DC: U.S. Department of Agriculture, Economic Research Service.
McCurdy, S. A., and D. J. Carroll. 2000. Agricultural injury. American Journal of Industrial Medicine 38(4):463-480.
McEowen, R. A., P. C. Carstensen, and N. E. Harl. 2002. The 2002 Senate farm bill: The ban on packer ownership of livestock. Drake Journal of Agricultural Law 7:267-304.
McGranahan, D., and P. Sullivan. 2005. Farm programs, natural amenities and rural development. Amber Waves. http://www.ers.usda.gov/amber-waves/2005-february/farm-programs,-natural-amenities,-and-rural-development.aspx#.VKvZCXtWeT9 (accessed January 6, 2015).
Meyers, W. H., P. Westhoff, J. F. Fabiosa, and D. J. Hayes. 2010. The FAPRI global modeling system and outlook process. Journal of International Agricultural Trade and Development 6(1):1-20.
Miles, M. B., and A. M. Huberman. 1994. Qualitative data analysis: An expanded source-book, 2nd ed. Thousand Oaks, CA: Sage Publications, Inc.
Murray, C. J., S. C. Kulkarni, C. Michaud, N. Tomijima, M. T. Bulzacchelli, T. J. Iandiorio, and M. Ezzati. 2006. Eight Americas: Investigating mortality disparities across races, counties, and race-counties in the United States. PLoS Medicine 3(9):1513-1524.
Myers, R. J., R. J. Sexton, and W. G. Tomek. 2010. A century of research on agricultural markets. American Journal of Agricultural Economics 92(2):376-402.
NCFH (National Center for Farmworker Health). 2012. Facts about farmworkers. http://www.ncfh.org/docs/fs-Facts%20about%20Farmworkers.pdf (accessed November 24, 2014).
Nelson, J. A. 1994. Estimation of food demand elasticities using Hicksian composite commodity assumptions. Quarterly Journal of Business and Economics 33(3):51-68.
Nelson, K., W. Cunningham, R. Andersen, G. Harrison, and L. Gelberg. 2001. Is food insufficiency associated with health status and health care utilization among adults with diabetes? Journal of General Internal Medicine 16:404-411.
NIH/EPA/NIOSH (National Institutes of Health/Environmental Protection Agency/National Institute for Occupational Safety and Health). 2014. Agricultural health study. http://aghealth.nih.gov (accessed November 24, 2014).
NIH/HHS. 2014. NIH health disparities strategic plan and budget, fiscal years 2009-2013. http://www.nimhd.nih.gov/documents/NIH%20Health%20Disparities%20Strategic%20Plan%20and%20Budget%202009-2013.pdf (accessed April 30, 2014).
NILC (National Immigration Law Center). 2014. Affordable Care Act. http://www.nilc.org/immigrantshcr.html (accessed February 10, 2014).
NIOSH. 2010. Worker safety on the farm. DHHS (NIOSH) Publication No. 2010-137. http://www.cdc.gov/niosh/docs/2010-137 (accessed January 5, 2015).
NIOSH. 2011. NIOSH pesticide poisoning monitoring program protects farmworkers. DHHS (NIOSH) Publication No. 2012-108. http://www.cdc.gov/niosh/docs/2012-108 (accessed January 5, 2015).
NIOSH. 2014. Commercial fishing safety. http://www.cdc.gov/niosh/topics/fishing (accessed October 25, 2014).
Nord, M. 2009. Food insecurity in households with children: Prevalence, severity, and household characteristics. Economic Information Bulletin No. EIB-56. Washington, DC: U.S. Department of Agriculture, Economic Research Service.
Nord, M., A. Coleman-Jensen, and C. Gregory. 2014. Prevalence of U.S. food insecurity is related to changes in unemployment, inflation, and the price of food. Economic Research Report No. ERR-167. Washington, DC: U.S. Department of Agriculture, Economic Research Service.
O’Donoghue, E. J., R. A. Hoppe, D. E. Banker, R. Ebel, K. Fuglie, P. Korb, M. Livingston, C. J. Nickerson, and C. Sandretto. 2011. The changing organization of U.S. farming. Economic Information Bulletin No. EIB-88. Washington, DC: U.S. Department of Agriculture, Economic Research Service.
OSHA (Occupational Safety and Health Administration). 2014. Meat packing industry. https://www.osha.gov/SLTC/meatpacking/index.html (accessed February 11, 2014).
OTA (Organic Trade Association). 2011. Seventy-eight percent of U.S. families say they purchase organic food. http://www.organicnewsroom.com/2011/11/seventyeight_percent_of_us_fam.html (accessed November 24, 2014).
OTA. 2014. American appetite for organic products breaks through $35 billion mark. http://www.organicnewsroom.com/2014/05/american_appetite_for_organic.html (accessed November 24, 2014).
Pena, A. A. 2010. Poverty, legal status, and pay basis: The case of U.S. agriculture. Industrial Relations 49(3):429-456.
Phillips, K. S., and D. W. Price. 1982. A comparative theoretical analysis of the impact of the Food Stamp Program as opposed to cash transfers on the demand for food. Western Journal of Agricultural Economics 7(1):53-66.
Powell, L., J. Harris, and T. Fox. 2013. Food marketing expenditures aimed at youth. American Journal of Preventive Medicine 45(4):453-461.
Probst, J. C., S. B. Laditka, J. Y. Wang, and A. O. Johnson. 2007. Effects of residence and race on burden of travel for care: Cross sectional analysis of the 2001 U.S. National Household Travel Survey. BMC Health Services Research 7:40-53.
Reardon, T., and C. P. Timmer. 2012. The economics of the food system revolution. Annual Review of Resource Economics 4:224-263.
Reed, A. J., and J. W. Levedahl. 2010. Food Stamps and the market demand for food. American Journal of Agricultural Economics 92(5):1392-1400.
Reed, A. J., J. W. Levedahl, and C. Hallahan. 2005. The generalized composite commodity theorem and food demand estimation. American Journal of Agricultural Economics 87(1):28-37.
Reinhardt, N., and P. Barlett. 1989. The persistence of family farms in United States agriculture. Sociologia Ruralis 29(3-4):203-225.
Richards, L., and J. Morse. 2012. README FIRST for a user’s guide to qualitative research, 3rd ed. Thousand Oaks, CA: Sage Publications, Inc.
Richards, T. J., and L. Padilla. 2009. Promotion and fast food demand. American Journal of Agricultural Economics 91(1):168-183.
Riedl, A. 2010. Behavioral and experimental economics do inform public policy. Finanzarchiv 66(1):65-95.
Roberts, S. E., B. Jaremin, and K. Lloyd. 2013. High-risk occupations for suicide. Psychological Medicine 43(6):1231-1240.
Rocha, C. 2007. Food insecurity as market failure: A contribution from economics. Journal of Hunger and Environmental Nutrition 1(4):5-22.
RWJF (Robert Wood Johnson Foundation). 2013. Why does education matter so much to health? http://www.rwjf.org/content/dam/farm/reports/issue_briefs/2012/rwjf403347 (accessed November 24, 2014).
Santelmann, M. V., D. White, K. Freemark, J. I. Nassauer, J. M. Eilers, K. B. Vache, B. J. Danielson, R. C. Corry, M. E. Clark, S. Polasky, R. M. Cruse, J. Sifneos, H. Rustigian, C. Coiner, J. Wu, and D. Debinski. 2004. Assessing alternative futures for agriculture in Iowa, USA. Landscape Ecology 19(4):357-374.
Schimmelpfennig, D., and R. Ebel. 2011. On the doorstep of the information age. Economic Information Bulletin No. EIB-80. Washington, DC: U.S. Department of Agriculture, Economic Research Service.
Schneider, U. A., B. A. McCarl, and E. Schmid. 2007. Agricultural sector analysis on greenhouse gas mitigation in U.S. agriculture and forestry. Agricultural Systems 94(2):128-140.
Schnepf, R. 2013. Farm-to-food price dynamics. Washington, DC: Congressional Research Service.
Seattle Global Justice. 2014. United States farmworker fact sheet. http://www.seattleglobaljustice.org/wp-content/uploads/fwfactsheet.pdf (accessed November 24, 2014).
Seligman, H. K., A. B. Bindman, E. Vittinghoff, A. M. Kanaya, and M. B. Kushel. 2007. Food insecurity is associated with diabetes mellitus: Results from the National Health and Nutrition Examination Survey (NHANES) 1999-2002. Journal of General Internal Medicine 22(7):1018-1023.
Seligman, H. K., B. A. Laraia, and M. B. Kushel. 2010. Food insecurity is associated with chronic disease among low-income NHANES participants. Journal of Nutrition 140(2):304-310.
Seligman, H. K., E. A. Jacobs, A. Lopez, J. Tschann, and A. Fernandez. 2012. Food insecurity and glycemic control among low-income patients with type 2 diabetes. Diabetes Care 35(2):233-238.
Seufert, V., N. Ramankutty, and J. Foley. 2012. Comparing the yields of organic and conventional agriculture. Nature 458:229-232.
Sexton, R. J. 2000. Industrialization and consolidation in the U.S. food sector: Implications for competition and welfare. American Journal of Agricultural Economics 82(5):1087-1104.
Sexton, R. J. 2013. Market power, misconceptions, and modern agricultural markets. American Journal of Agricultural Economics 95(2):209-219.
Sfiligoj, E. 2012. Ag retail consolidation trending up. http://www.croplife.com/special-reports/state-of-the-industry/ag-retail-consolidation-trending-up (accessed November 24, 2014).
Share Our Strength. 2012. It’s dinner time: A report on low income families efforts to plan, shop and cook healthy meals. http://www.nokidhungry.org/cmstudy (accessed November 24, 2014).
Shiv, B., and A. Fedorikhin. 1999. Heart and mind in conflict: The interplay of affect and cognition in consumer decision making. Journal of Consumer Research 26:278-292.
Smith, J. P. 1999. Healthy bodies and thick wallets: The dual relationship between health and socioeconomic status. Journal of Economic Perspectives 13(2):145-166.
Smith, L. P., S. W. Ng, and B. M. Popkin. 2013. Trends in U.S. home food preparation and consumption: Analysis of national nutrition surveys and time use studies from 1965-1966 to 2007-2008. Nutrition Journal 12:45.
Smith, V. L. 1985. Experimental economics—Reply. American Economic Review 75(1):265-272.
Sommers, D., and J. C. Franklin. 2012. Overview of projections to 2020. Monthly Labor Review 135(1):3-20.
Stevens-Garmon, J., C. L. Huang, and B.-H. Lin. 2007. Organic demand: A profile of consumers in the fresh produce market. Choices 22(2):109-116.
Stofferahn, C. 2006. Industrialized farming and its relationship to community well-being: An update of a 2000 report by Linda Lobao. Prepared for the state of North Dakota, Office of the Attorney General. http://www.und.edu/org/ndrural/Lobao%20&%20Stofferahn.pdf (accessed November 24, 2014).
Stull, D. D., M. J. Broadway, and D. Griffith. 1995. Any way you cut it: Meat processing and small-town America. Lawrence, KS: University of Kansas Press.
Syed, S. T., B. S. Gerber, and L. K. Sharp. 2013. Traveling towards disease: Transportation barriers to health care access. Journal of Community Health 38(5):976-993.
Talukdar, D., and C. Lindsey. 2013. To buy or not to buy: Consumers’ demand response patterns for healthy versus unhealthy food. Journal of Marketing 77(2):124-138.
TFIC (The Food Industry Center). 2014. Indicator data. http://foodindustrycenter.umn.edu/Research/foodsystemindicators/indicatordata/index.htm (accessed February 10, 2014).
Tropp, D. 2014. Why local food matters: The rising importance of locally-grown food in the United States food system—A national perspective. USDA Agricultural Marketing Service. http://www.ams.usda.gov/AMSv1.0/getfile?dDocName=STELPRDC5105706 (accessed November 24, 2014).
Tuomisto, H., I. Hodge, P. Riordan, and D. MacDonald. 2012. Does organic farming reduce environmental impacts? A meta-analysis of European research. Journal of Environmental Management 112:309-320.
Umberger, W. J., and D. M. Feuz. 2004. The usefulness of experimental auctions in determining consumers’ willingness-to-pay for quality-differentiated products. Review of Agricultural Economics 26(2):170-185.
Unnevehr, L., J. Eales, H. Jensen, J. Lusk, J. McCluskey, and J. Kinsey. 2010. Food and consumer economics. American Journal of Agricultural Economics 92(2):506-521.
U.S. Census Bureau. 2014. Enterprise statistics. Table 7. Summary statistics for enterprises by industry: 2011. http://www.census.gov/econ/esp (accessed November 17, 2014).
U.S. Fish and Wildlife Service. 2014. Environmental quality. Pesticides and wildlife. http://www.fws.gov/contaminants/Issues/Pesticides.cfm (accessed November 24, 2014).
U.S. GAO (U.S. Government Accountability Office). 2009. Concentration in agriculture. GAO-09-746R. http://www.gao.gov/new.items/d09746r.pdf (accessed November 24, 2014).
USDA (U.S. Department of Agriculture). 2009. 2007Census volume1, Chapter 1: U.S. nationallevel data. Table 1. http://www.agcensus.usda.gov/Publications/2007/Full_Report/Volume_1,_Chapter_1_US (accessed February 10, 2014).
USDA. 2013. SNAP Food Security In-Depth Interview Study. http://www.fns.usda.gov/snap-food-security-depth-interview-study (accessed November 24, 2014).
USDA. 2014a. Cooperative directory and data. http://www.rurdev.usda.gov/BCP_Coop_DirectoryAndData.html (accessed February 11, 2014).
USDA. 2014b. 2012 Census of agriculture. United States. http://www.agcensus.usda.gov/Publications/2012 (accessed February 11, 2014).
USDA. 2014c. Definitions of food security. http://www.ers.usda.gov/topics/food-nutrition-assistance/food-security-in-the-us/definitions-of-food-security.aspx (accessed October 29, 2014).
USDOL (U.S. Department of Labor). 2005. A demographic and employment profile of United States farm workers. Findings from the National Agricultural Workers Survey (NAWS) 2001-2002. Research Report No. 9. U.S. Department of Labor. http://www.doleta.gov/agworker/report9/toc.cfm (accessed January 6, 2015).
VanDeCruze, D., and M. Wiggins. 2008. Poverty and injustice in the food system. A report for Oxfam America. Durham, NC: Student Action with Farmworkers. http://ducis.jhfc.duke.edu/wp-content/uploads/2010/06/Poverty-and-Injustice-in-the-Food-System.pdf (accessed February 11, 2014).
Ver Ploeg, M., V. Breneman, T. Farrigan, K. Hamrick, D. Hopkins, P. Kaufman, B-H. Lin, M. Nord, T.A. Smith, R. Williams, K. Kinnison, C. Olander, A. Singh, and E. Tuckermanty. 2009. Access to affordable and nutritious food measuring and understanding food deserts and their consequences: Report to Congress. Washington, DC: U.S. Department of Agriculture, Economic Research Service.
Volpe, R. 2013. Price inflation for food outpacing many other spending categories. Amber Waves. http://www.ers.usda.gov/amber-waves/2013-august/price-inflation-for-food-outpacing-many-other-spending-categories.aspx#.VKvOxntWeT9 (accessed January 6, 2015).
Volpe, R., and A. Okrent. 2012. Assessing the healthfulness of consumers’ grocery purchases. Economic Information Bulletin No. EIB-102. Washington, DC: U.S. Department of Agriculture, Economic Research Service.
Wainer, A. 2011. Farm workers and immigration policy. Briefing paper 12. http://www.bread.org/institute/papers/farm-workers-and-immigration.pdf (accessed November 24, 2014).
Wang, S. L., and E. Ball. 2014. Agricultural productivity growth in the United States: 1948-2011. Amber Waves January/February. http://www.ers.usda.gov/amber-waves/2014-januaryfebruary/agricultural-productivity-growth-in-the-united-states-1948-2011.aspx#.VKvaLHtWeT- (accessed January 6, 2015).
Wansink, B. 2006. Mindless eating. New York: Bantam Books.
Wansink, B., and J. Sobal. 2007. Mindless eating: The 200 daily food decisions we overlook. Environment and Behavior 39(1):106-123.
Ward, C. E. 2007. Feedlot and packer pricing behavior: Implications for competition research. Paper presented at Western Agricultural Economics Association annual meeting, Portland, OR, July 29 to August 1, 2007. http://ageconsearch.umn.edu/bitstream/7365/2/sp07wa01.pdf (accessed November 24, 2014).
Wendt, M., and J. Todd. 2011. Effect of food and beverage prices on children’s weights. Economic Research Report No. ERR-118. Washington, DC: U.S. Department of Agriculture, Economic Research Service.
Whitaker, J. B. 2009. The varying impacts of agricultural support programs on US farm household consumption. American Journal of Agricultural Economics 91(3):569-580.
Whitaker, R. C., S. M. Phillips, and S. M. Orzol. 2006. Food insecurity and the risks of depression and anxiety in mothers and behavior problems in their preschool-aged children. Pediatrics 118(3):e859-e868.
White, K., J. S. Haas, and D. R. Williams. 2012. Elucidating the role of place in health care disparities: The example of racial/ethnic residential segregation. Health Services Research 47(3 Pt 2):1278-1299.
Williams, D. R., and C. Collins. 2001. Racial residential segregation: A fundamental cause of racial disparities in health. Public Health Reports 116(5):404-416.
Wood, S., and J. Gilbert. 2000. Returning African American farmers to the land: Recent trends and a policy rationale. The Review of Black Political Economy 27(4):43-64.
Yen, H. 2014. The new face of food stamps: Working-age Americans. AP: The Big Story, January 27.


