
A Framework for Assessing the Food System and Its Effects
As the other chapters in this report make clear, the U.S. food system has evolved into a highly complex one, where changes due to new policies, products, or technologies can have diverse and sometimes unanticipated repercussions. A robust framework for assessing the health, environmental, social, and economic effects of the food system should recognize the system’s complexity while offering a tractable way forward.
This chapter proposes such a framework, including key principles, important food system traits, and specific steps for developing an assessment. The chapter also reviews specific approaches for communicating findings, along with ways to engage key stakeholders and conduct a thoughtful analysis of a complex system within a budget. In this sense, not all steps or methods will apply equally, depending on the scope and topic chosen by a researcher. The committee recognizes that discrete questions might not require a full systemic analysis, although assessors still need to recognize boundaries and implications (i.e., potential relevant effects, actors, interactions that are left out of the analysis) so that others may conduct complementary research. In other cases, there may be a lot of data already on some discrete questions. In such cases, a systematic review of the literature for the relevant questions would need to be conducted to synthesize the results and identify future data or analyses needed.
FRAMEWORKS FOR ASSESSMENT
A framework for assessment provides a conceptual and empirical structure to guide an evaluation. A good framework identifies best practices to
facilitate well-informed decisions, given the resources available and the goals of those conducting the assessment. The main users of an assessment framework for the food system will be researchers and decision makers (e.g., at government agencies, private firms, or advocacy groups). Other stakeholders might not be users per se, but the recipients of reports developed from the assessment. Previous frameworks for assessment have generally identified several key steps to be followed in an iterative manner: identify the problem, define the scope, identify the scenario, conduct the analysis, synthesize the findings, and report to stakeholders. These six key steps are part of widely used assessment frameworks, such as environmental assessment (Powers et al., 2012), health impact assessment (with stakeholder engagement throughout the entire assessment process) (NRC, 2011), and risk assessment (NRC, 2009). Our framework for assessment of the food system follows these same six steps for implementing the assessment.
Frameworks for assessment will vary from one area of application to another. The scope and complexity of the application area, along with data and analytical methods, will drive the principles that pertain to a specific assessment framework.
RECOMMENDED FRAMEWORK FOR ASSESSING HEALTH, ENVIRONMENTAL, SOCIAL, AND ECONOMIC EFFECTS OF THE FOOD SYSTEM
The recommended framework for assessing the health, environmental, social, and economic effects of the food system revolves around four key principles (represented by the four quadrants in Figure 7-1). These principles draw on knowledge and evidence from across the various segments of the U.S. and global food systems and the many interactive agents and activities that currently deliver food from seed to table. Because changes in any one segment of the food system result in changes, intended or not, in many other parts of the system, the committee recommends a comprehensive approach that captures the food system holistically and accounts for several types of potential effects. In Figure 7-1, the two upper quadrants illustrate principles associated with the desirable scope of an assessment:
- Recognize Effects Across the Full Food System to highlight the connections among different food supply chain sectors and the important role of biophysical, social, economic, and institutional contexts.
- Consider All Domains and Dimensions of Effects to ensure that the assessment captures the potential trade-offs across health, envi-
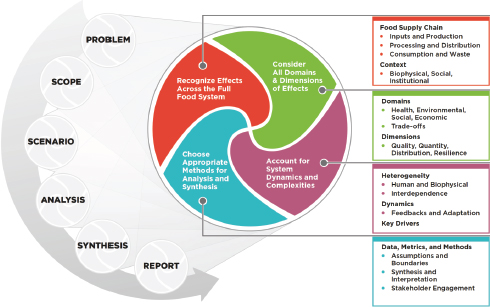
FIGURE 7-1 Conceptual illustration of the analytical framework. The four principles of the framework are represented in the larger circle, the core of the framework. These principles need to be considered throughout the assessment steps, represented in the figure as six small circles.
ronmental, social, and economic outcomes associated with alternative configurations1 of the food system effects.
The lower quadrants of the figure highlight criteria for choosing analytical methods that can recognize the complex adaptive nature of the food system. Reading clockwise, they are:
- Account for System Dynamics and Complexities by treating the food system as a dynamic, adaptive system with heterogeneous actors and not necessarily predictable systems-level outcomes.
- Choose Appropriate Methods for Analysis and Synthesis, including data, metrics, and analytical methods suited to systems analysis, while making explicit any assumptions needed for simplification.
_____________
1 Configurations are elements within the food system, such as policy interventions, technologies, market conditions, or organizational structure of different segments of the food system, that can be modified to achieve a particular goal or to explore how potential drivers (e.g., growth in demand for foods with particular traits) might impact the distribution of health, environmental, social, and economic effects.
In this context, “appropriate” means suited for the purpose and available.
These four key principles and the six framework steps are described in the following sections.
Principle 1: Recognize Effects Across the Full Food System
The first key principle recognizes the food system as a supply chain that is managed by diverse actors with competing interests and goals. Positive and negative health, environmental, social, and economic effects occur all along the food supply chain, from the farm production and input supply sectors through the first line handlers; processing, manufacturing, wholesale, and logistics sectors; retail food and food service sectors; and finally consumption and waste disposal. Along the way, the management of the food system is shaped by changes in natural resources, markets, policies, technologies, organizations, and information. The combination of the food supply chain and its surrounding biophysical and institutional context, introduced in Chapter 2, defines what we mean by a food system, and this should be recognized in any assessment.
Principle 2: Consider All Domains and Dimensions of Effects
The second key principle calls for consideration of all four important domains of food system effects (health, environmental, social, and economic) in any single assessment and directs attention to four specific dimensions of these effects (quantity, quality, distribution, and resilience) within each domain. Not only are all four domains of effect potentially important to accurately assess the system in current or alternative forms; trade-offs among the different effects (within each domain and across them) will often occur and should be evaluated, too.
Within each domain, four dimensions of effects—quantity, quality, distribution, and resilience—provide guidance that can help assessors consider a sufficiently broad range of potential outcomes. All are theoretically important and can serve as distinct components of scientific measures. The relative importance of these dimensions will vary with the specifics of the data underpinning any particular assessment. Even with the same data, individual assessors may disagree about the relative importance of each dimension, but the relevance of these four dimensions to assessing the food system is indisputable.
Quantity, quality, distribution, and resilience measure how much of what the food system provides, where and to whom it goes, and how sustainably it can do so. Quantity in the food system often matters relative to
a benchmark, because too little or too much can be problematic. Just as hunger and obesity relate to food quantity consumed, so, too, lake sterility and eutrophication relate to insufficient and excess phosphorus runoff. Monitoring quantity characteristics of the food system also can capture depletion, degradation, or protection of natural resources upon which food production depends (e.g., soil), as well as amounts of pollutants delivered from agricultural systems to the environment (e.g., nutrients, pesticides, greenhouse gases).
Quality characterizes an outcome. If the outcome is food produced, then quality might measure nutrition, taste, or safety. If the outcome is diet, then quality might measure dietary components relative to a benchmark, such as the U.S. Dietary Guidelines for Americans. Job quality is also considered here and relates to the degree to which compensation and working conditions align with societal, legal, and worker expectations.
Distribution measures where an outcome goes. An important distribution for the study of obesity is incidence across different consumer populations. For food access, a relevant distribution is distance to food retailers. For biodiversity, the spatial dispersion of species numbers is a key distribution.
Resilience measures the food system’s ability to bounce back from sudden shocks and long-term pressures (combining Conway’s [1987] notions of stability and sustainability). Resilience can refer to how a food system responds to sudden events or to gradual pressures. For example, in response to honeybees dying of disease, resilience measures the food system’s ability to continue supplying crops that rely on bee pollination. In response to sudden collapse of a manure retention lagoon, resilience might refer to how well the adjacent river recovers its ecosystem functions. In an illustrative economic context, resilience would refer to the speed and thoroughness by which other retailers meet consumers’ food needs after a declaration of bankruptcy by a major supermarket chain.
These four dimensions manifest themselves across health, environmental, social, and economic outcomes of the food system. Table 7-1 illustrates ways in which all four dimensions touch upon the broad effect domains of this report. For example, reading down the Environment domain column, the reader can see examples of four dimensions of measurement. An illustrative measure of quantity is the amount of food produced; an illustration of quality is biodiversity and the aesthetic quality of the natural environment; an illustration of distribution is how agrichemical runoff risk varies across landscapes; and an illustration of resilience is the time needed for agricultural production to recover after a drought or flood. As a practical matter, the four dimensions vary in how they are measured, so they should be benchmarked to assess relative performance changes in the food system.
Assessing the desirability of alternative configurations of the food sys-
TABLE 7-1 Illustrations of How the Four Dimensions Can Measure Food System Effect Domains
| Domains | |||
| Dimensions | Health | Environment | Social and Economic |
| Quantity | Sufficient calories consumed for good health, but not obesity | Plentiful food production from agricultural land and water | Rising disposable income for consumers and/or food system workers |
| Quality | Safe working conditions and/or availability of food that is safe and meets recommended dietary allowances and dietary guidelines | Biodiversity and quality of natural environment in agricultural setting | Variety of affordable foods across income levels |
| Distribution | Access to a variety of foods for all groups in population | Distribution of agrochemical runoff risks across diverse landscapes | Cost of meeting dietary needs as share of household income at different income levels |
| Resilience | Recovery of trusted food safety level after contamination event | Recovery time for agricultural production after drought or flood | Community retains viability after loss of a major employer |
NOTE: Many more examples about specific dimensions could be measured within each domain.
tem depends on the goals and values of the evaluator. One cannot identify the “best” of a set of configurations without adopting a particular set of normative judgments. An evaluation framework that seeks to identify a better alternative must make clear how different metrics of performance are being weighted or ranked. Assessors who reject these judgments may reject the entire analysis. A useful evaluation framework provides factual and objective information that can be used by people with different judgments about the relative importance of these dimensions to develop a well-informed ranking of alternatives consistent with their own normative preferences (Nyborg, 2012). Thus, consideration of all dimensions remains an important goal.
Principle 3: Account for System Dynamics and Complexities
As discussed in Chapter 6, the food system is complex, dynamic, and adaptive. With these traits in mind, an assessment should account for the heterogeneity of the actors and processes at each step of the food chain. Heterogeneity can apply to people—their tools, resources, relationships, and knowledge. Likewise, diversity abounds in a biophysical setting, including terrain, climate, and other natural resources. These heterogeneous traits are all highly interdependent.
Systems embed dynamic processes by which actors (human and other) can adapt their behavior. Just as farmers react to market price incentives by changing what or when or how they produce food, insect pests respond to repeated use of the same pest control method by evolving modes of resistance. Given the tendency of complex interactions to trigger dynamic repercussions, assessments should always (to the extent feasible) account for those effects across time, space, and heterogeneous populations. Moreover, assessments should acknowledge the potential role of underlying drivers of food system dynamics, such as changes in people’s diet preferences and patterns of food consumption, farm and food policy, market prices, food industry structure, technology, natural resource base and climate conditions, to name a few. Other potential drivers of health, environmental, social, and economic effects may come primarily from outside the food system, such as lifestyle changes, heath care policies, energy policies, cross-border atmospheric deposition of nitrogen, or nonfood employment opportunities. Although scope limitations will preclude any specific study from careful consideration of all effects and drivers, it is important for any study to acknowledge the potential role of relevant aspects not included.
Principle 4: Choose Appropriate Methods for Analysis and Synthesis
Assessments are ultimately no better than the data and methods they employ. The careful choice of metrics to measure data and empirical methods to learn from data is fundamental to conducting a meaningful assessment. Within this context, appropriate methods are those that are suited to the purpose and means available. Appropriate methods might include those that:
- Allow consideration of effects across the full food system;
- Capture some information about each domain and dimension of effects;
- Capture system dynamics (e.g., feedbacks, interactions, heterogeneity);
- Capture processes and outcomes at the scales suited to the problem at hand; and
- Are able to address the critical concerns of stakeholders or policy makers.
Prevailing standards of evidence govern the choice of metrics and methods. These standards, in turn, vary across health, environmental, social, and economic effects because of measurement challenges specific to each domain. Assessment methods divide between two broad areas: (1) methods for analyzing and predicting effects of changes in the food system, and (2) methods for synthesizing findings across effects. Major approaches in both areas are summarized in the latter part of this chapter, and the appendix lists selected metrics, analytical methods, databases, and methodologies. The assumptions, limitations, accuracy, sensitivity, and other relevant factors for methods used should be clearly stated in the assessment. This is particularly important when assessments are made in new areas where data or previous research results are lacking.
ASSESSMENT STEPS
With the four key principles in Figure 7-1 guiding the thinking behind an assessment, six specific steps emerge from the broader literature on assessment frameworks. The steps (see Box 7-1) begin with describing the problem of interest, which involves identifying the goal, question, or concern. Next, through scoping, an assessment should characterize the system, including its boundaries, functional units, processes, outcomes, stakeholders, and key interventions and leverage points. As no assessment can be completely comprehensive, the scoping step is the point at which to determine the breadth and depth of the assessment. Third, an assessment
BOX 7-1
Steps for Assessment of Food System and Its Effects
- PROBLEM: Motivate need with goals and objectives
- SCOPING: Characterize system boundaries, components, processes, and linkages
- SCENARIO: Identify baseline (and alternatives, as appropriate)
- ANALYSIS: Conduct assessment
- SYNTHESIS: Synthesize and interpret the results
- REPORT: Communicate findings to key stakeholders
should clearly identify a scenario to be examined, typically a baseline, reference scenario and often one or more alternatives, as appropriate. With these elements in place, the fourth step is to conduct the analysis. The analysis will entail important choices of data (including potential solicitation of stakeholder to fill data gaps), models, and appropriate analytical methods to assess the complex dynamics of the food system across the four key dimensions of quantity, quality, distribution, and resilience. Fifth, results must be synthesized and interpreted, often into recommendations. Finally, the entire assessment should be reported and disseminated to stakeholders by appropriate means.
Throughout the assessment process, stakeholders can play an important role, particularly when they will be expected to act on the results of the analysis. Stakeholders can help identify issues that may not be obvious to researchers; validate choices about methods, metrics, and models; and provide data that are not readily available from other sources. At the same time, stakeholder engagement requires careful attention to representation of a broad diversity of stakeholder perspectives, and scientific assessments also may require a certain distance or buffer from the influence of powerful stakeholders in order to avoid conflicts of interest and create space for objective and independent decisions—whether related to scoping, scenario development, or analysis activities. Additional comments pertaining to considerations for managing stakeholder participation are presented after the assessment steps.
Although the remainder of this chapter discusses all six steps, it elaborates in greatest detail on Steps 4 and 5, analysis and synthesis of the assessment.
Problem: Motivate the Need for Assessment and Define Goals and Objectives
Assessments are motivated by broad problems or concerns. These should be carefully considered and explicitly stated. Development of a problem statement is often based on interactions with stakeholders, formal public health and safety criteria, and reviews of relevant literature about the problem and key findings from past assessments in the area. The problem statement should guide where the assessment is going, including its goals, objectives, and research questions and all future assessment decisions.
Scoping: Characterize System Boundaries, Components, Processes, Actors, and Linkages
Clearly framing the scope of the assessment is an essential step, given the complexity of the food system. A comprehensive analysis of the food
system that analyzes the entire food supply chain across all effect domains in all dimensions and accounts fully for dynamics and complexities is a dauntingly ambitious undertaking. Analysts in all but the rarest instances will choose to narrow the scope of analysis. The scoping step considers appropriate boundaries and assumptions to frame the scope of an assessment in the context of the food system as a whole. The scoping step involves the choice of boundaries and assumptions that are part of “Choose Appropriate Methods for Analysis and Synthesis” in Figure 7-1. In doing so, scoping draws on the other three quadrants of the framework in clockwise order.
Determining the scope of an assessment begins with situating the topic for the assessment in the context of the full food system, both in the food supply chain and in the biophysical, social, and institutional contexts. Through what parts of the food system is the assessment topic likely to have significant repercussions? Those parts of the food system should fall within the boundaries of the analysis.
Moving on to the next quadrant, which effect domains are likely to be affected by the study focus? A study focused on dietary changes may have little effect on the environment but a large one on health. Which dimensions are likely to be important? Scale matters. A targeted school diet study may have negligible economic effects, but a large-scale dietary intervention could shift market prices. Effect domains and dimensions that are unlikely to be affected by the study focus can reasonably be left outside the boundary of the study, with the stated assumption that it is exogenous.
Considering system dynamics and complexities is the point at which to ask questions about how dynamics and heterogeneity affect a proposed topic of study: How long are repercussions likely to endure? What (if any) are important feedback processes and interdependencies? Are there key interventions or leverage points that lead to alternative scenarios deserving consideration? Responses to these questions will be based on qualitative generalizations about the system, but they can offer useful ex ante justifications for where detailed empirical analysis is merited, and where it is not. More specifically, the answers to these questions will influence the time horizon, the extent of relevant causal relationships, and other boundaries, along with assumptions about what lies outside those boundaries.
The boundaries may enclose a subset of the larger food system, such as the U.S. food system as part of the global system (see Figure 2-3 in Chapter 2), or a particular food commodity as part of a larger crop–livestock complex (see the egg example in Annex 5). They may designate a specific period of time or geographic area. Inside those boundaries, the assessment seeks to describe the interactions and relationships among key actors along the relevant parts of the food supply chain as well as to show the impacts of changes on a range of health, environmental, social, and economic effects.
Outside the boundaries, the assessment may assume constant conditions or exogenous changes, as is often the case with analyses of the U.S. food system that take the rest of the world as given. Boundaries for the system under analysis can be shaped by the nature of the problem, and they often depend on input from stakeholders, but they also may be determined by budget limitations (discussed on p. 268).
Within the defined boundaries, the characterization of the system should expand to identify the endogenous (or internally determined) processes and pathways that produce the outcomes of interest (Collins et al., 2011). For example, the nitrogen case study in Annex 4 focuses on the subsystem of crop production using nitrogen fertilizer; it does not consider aspects outside the defined system boundary, such as crop and livestock production, that do not directly involve nitrogen. Nor does it consider consumers and total food output. The processes and pathways that are endogenous, or inside the system boundary, involve nitrogen, the people who apply it, where it goes, how it affects crops, and how it affects climate, water, and other environmental fates. Identification of stakeholders to include in the assessment process is particularly useful at the scoping stage, because they can help identify potential sources of data or information to fill in any data gaps that may be present.
The choice of an appropriate time horizon for the assessment shapes the types of health, environmental, social, and economic effects that can be considered. Options range along a continuum from immediate to long-term cumulative impacts. Health effects may be acute or chronic, ranging from food poisoning to obesity and heart disease. The same is true of environmental effects, which range from sudden storms that washed previously applied phosphorus fertilizers into Lake Erie and may have triggered the algal blooms of 2011 and 2014 (Michalak et al., 2013) to incremental emissions of agricultural greenhouse gases that contribute to gradual climate change (Robertson, 2004). Social and economic effects associated with rapid change in the short run may be different from long-run impacts, which capture the dynamic adaptive responses of key actors. The time horizon should match the research goals and system boundaries because, in effect, the time period is an additional boundary.
Some studies may be narrow in scope, focusing on one or a few stages in the food supply chain or one domain of effects (e.g., health outcomes). In such cases, the committee recommends that any assessment at least acknowledge the existence of the potentially important effects of drivers that are outside the scope of the specific assessment. Although it is preferable to incorporate as many domains and dimensions of effects as possible, explicit assumptions that acknowledge what is beyond the scope of study can help to balance the importance of being comprehensive while focusing on a tractable assessment area.
Scenario: Identify the Baseline (and Alternatives, as Appropriate)
Assessments characterize how a system performs. Most assessments compare system performance to a baseline scenario and sometimes to one or more alternative scenarios. Alternative scenarios typically specify potential changes in a system to reflect an intervention, such as a new policy or a new technology. Any assessment of health, environmental, social, and economic effects of the food system should be explicit about each intervention being considered, including when, where, and how the intervention occurs. Stakeholder input can help identify and define a set of realistic scenario options.
It can be tempting to identify one state of the system simply as the “status quo” or “conventional” state without further characterization. But because the food system is constantly evolving (see Chapter 2), such descriptors lose meaning over time if they fail to define explicitly the system state in a baseline scenario. Descriptions of changed interventions need to be equally explicit so that what is changing and what is held constant are clear.
Analysis: Conduct the Assessment
Given the intended scope, an analysis draws on suitable methodologies to interpret data and build models to assess the likely health, environmental, social, and economic effects associated with alternative food system scenarios. The goal is to provide a scientifically valid basis for public and private decision making. The next major section will summarize common assessment methodologies in more detail.
Synthesis: Synthesize and Interpret Results
Analyses of food systems should be designed to clarify the likely outcomes—and their magnitudes—and the trade-offs associated with different alternatives. Often outcomes include both beneficial and harmful effects and, as noted above, the results of a scientific assessment may not by themselves provide clear guidance about which scenario is “the best.” Therefore, a synthesis and interpretation of the outcomes are needed to help integrate disparate results into a clear message and potential interventions. Ultimately, value judgments of stakeholders and decision makers are required to determine how to weigh the various outcomes. Approaches to synthesis, interpretation, and evaluation of trade-offs also are discussed below following the section on analytical methodologies.
Report: Communicate Findings to Stakeholders
Reporting involves communicating the assessment and recommendations to key stakeholders, broadly defined as the end-user of the assessment in affected communities, and also the general public. The reporting step typically involves creating a report that documents the assessment methods; the data sources and analytical tools, including the assumptions; interactions with stakeholders; findings; and recommendations. Ensuring that the report is clearly written, is easily understood, and is transparent are also important considerations. Although a single report may be created, additional summary documents may be tailored to the various audiences. As a matter of best practice, a succinct executive summary should also accompany the longer text.
Related to reporting is dissemination, which aims to inform a wide range of stakeholders of the assessment’s purpose, approach, findings, and recommendations. For any assessment, a variety of processes and media may be used, including public forums, presentations, and policy briefs. For example, risk analysis methodology typically includes risk communication as a separate activity from risk assessment (the scientific element) and risk management (the policy element) in order to ensure that the messaging is structured to effectively communicate to distinct audiences that may interpret the information in different ways. During dissemination, stakeholders can help to ensure that reports are written in a manner appropriate for the intended audiences and reach these key audiences as well as help to gain buy-in from key decision makers.
ANALYSIS: METHODS FOR ANALYZING FOOD SYSTEM EFFECTS
The right empirical or modeling method for a food system assessment depends on the specific problem, its scope, and the scenarios defined for the study. The relevant analytical methods divide importantly between two broad types of assessment scenarios: (1) a specific current food system configuration (e.g., a policy or a practice), and (2) potential alternative configurations. A study of a current system configuration can measure observable effects of the system; by contrast, a study into alternative system configurations is by its nature a “counterfactual” study—one that seeks to understand what would happen if matters were different. In counterfactual studies, it is inherently difficult to learn solely by observation of the current system, so other approaches are needed. The challenges of counterfactual studies compared to factual ones are analogous to the challenges of ex ante versus ex post impact evaluations (Alston et al., 1998).
The four dimensions of measurement—quantity, quality, distribution, and resilience—interact closely with the purpose of the assessment in deter-
mining the most relevant methods to use. Quantity and quality are dimensions where overall average effects may suffice, whether for food produced and consumed or regarding health, environmental, social, and economic effects of the food system. The next dimension—distribution—requires consideration of the heterogeneity of system effects, including variation across geography, time, and population. Finally, the dimension of resilience requires measures of how the system performs over time, including how it responds to stresses and shocks that could undermine its sustainability.
Measuring Quantity and Quality Dimensions in the Current Food System
Assessing quantity and quality effects in the current food system centers on (1) describing the system and (2) explaining what causes it to function as it does. Understanding causation is challenging because underlying causes can be easily confused with correlated effects that are not true causes. A correlation may exist because the underlying relationship is mischaracterized or because of measurement error. The rise of obesity in America is clearly related to food, but it may also be related to growing levels of inactivity, as well as social and economic factors (Hammond, 2009). An assessment that ignores nonfood determinants of obesity may reach biased results. This illustrates a first requirement for understanding what causes food system effects: construction of a conceptual model containing all possible causes of the relevant effects. Such a conceptual model offers two benefits. First, it can reduce the risk that an assessor is blind to causes outside of a target set. Second, it can reduce the odds of confusing cause and effect. These benefits only occur if the conceptual model is informed by reliable metrics measuring the current food system.
A second requirement for understanding what causes food system effects is to use good metrics. Metrics can be divided into three types: (1) directly measured data, (2) indicator data that serve as indirect measures, and (3) simulation models that provide artificial data (“pseudo-data”) that represent projections or inferences about the real world.
Directly measured data are the gold standard, but in many circumstances, direct measurement is either too costly (consider all water pollutants in U.S. lakes) or infeasible (consider nitrous oxide emissions from fertilizer on commercial farms). Moreover, all measurements—even direct measurements—are subject to error (see Box 7-2).
Indirect measurement through indicators is sometimes more cost-effective than direct measurement is—especially for spatially diffused effects. Water quality may be measured by the population of Daphnia, a water flea that serves as a sentinel species for waterborne ecotoxins. Likewise, remote sensing technologies make it possible to use indicators like reflectance of
BOX 7-2
Measurement Error in Directly Measured Data, Indicators, and Models
All metrics are subject to measurement error. In the words of two eminent statisticians, “essentially, all models are wrong, but some are useful” (Box and Draper, 1987, p. 424). Even in directly measured data, the measured value and the true value are almost never the same because the act of measurement is never perfectly consistent. The difference between measured and true values is called measurement error. In this case, “error” does not refer to a mistake, but rather to the diverse factors that can cause a measurement to depart from a true value.
Measurement error includes both random error and systematic error (also known as bias). Random error can be dealt with by averaging repeated measurements, so it is the less troubling of the two. Systematic error is more problematic, because it may cause consistent overestimates or underestimates of the true effects. Selection bias is one form of systematic error that occurs when sampled individuals do not represent the population of interest. For example, gathering data by interviewing daytime food shoppers at a supermarket excludes individuals who are unable to shop in person or unable to shop during the day. Social science research has used a variety of methods for minimizing confounding, ranging from randomized controlled trials (Moffitt, 2004) to cluster randomized trials for community-based interventions (Cornfield, 1978; Donner and Klar, 2000) to special statistical methods and research designs to control for the effects of selection bias (Barrett and Carter, 2010; Deaton, 2010; Heckman et al., 1998).
Indicator data can be an imperfect measure of the underlying phenomenon or concept they are meant to capture. For example, satellites record spectral reflectance from the Earth’s surface. Those measures of reflected light correlate highly with different plant species, enabling the U.S. Department of Agriculture to produce maps annually of U.S. cropland using light reflectance as an indicator of crop location. But maps of U.S. cropland based on remote sensing indicator data show less land area under crops than was reported in the nearest agricultural Census (Johnson, 2013), presumably because of translational error in associating the sensed wavelengths of light with real crops planted on the ground.
Simulation models also can contain errors that lead to misleading conclusions. Errors of omission or specification may occur in their equations or algorithms as well as in the numerical parameters that shape those equations. Reliable models have undergone procedures of verification, validation, calibration, and sensitivity analysis to catch mistakes and refine predictive power (Arnand et al., 2007; Howitt, 1995). However, even well-validated models never predict perfectly.
All three kinds of metrics (directly measured data, indicator data, and pseudo-data coming out of simulation models) experience measurement error. In all cases, systematic error is to be avoided. Random error, while it reduces accuracy, can be averaged out in repeated measures. Although indicator data and model pseudo-data may seem less desirable than directly measured data, they are used when direct measurements are so costly that it would mean not measuring at all—or only doing so in a handful of scientific studies.
BOX 7-3
Testing for Statistical Effects
Statistical analysis can answer important questions about the food system. But measurement error can obscure the answer. How big must an effect be to be meaningful? To separate ordinary random variability from meaningful effects, statisticians commonly start by assuming there is no effect. Under this “null” hypothesis, one would assume that an outcome Y is not affected by cause X, with the alternative hypothesis that X does affect Y. Tests of statistical significance aim to contain the probability of a Type I error, which occurs if the null hypothesis is rejected when the null hypothesis was true—there in fact was no effect (Mendenhall et al., 1986). This approach is entirely appropriate when the consequence of wrongly rejecting the null hypothesis is serious and costly. To illustrate with a stylized example, suppose that a company is developing a new process to inactivate foodborne pathogens, and it wishes to test how the process compares to the existing inactivation process. Assume that Y is inactivation achieved by the current process and X is inactivation achieved with the new process. Because inactivation kinetics for different pathogens may vary when different methods are applied, multiple regression models are used to examine inactivation of various foodborne pathogens in relation to X. Before the firm developing the new inactivation process would want to begin steps toward commercialization, it would want very compelling evidence that X inactivates foodborne pathogens at least as effectively as Y. A low significance threshold (5 or 1 percent) would sharply limit the probability of wrongly concluding that X is at least as effective as Y for inactivation of foodborne pathogens.
However, for many important food system effects where costs are low but benefits are high, a very demanding-level statistical significance is unnecessary and may be undesirable. The reason is that requiring a high significance increases the odds of failing to reject the null hypothesis when it is false (Type II error). Consider the case where Y is improvement in lake water quality when farmers use low-cost conservation practice X, and the null hypothesis is: X has no effect on Y. Consider a multiple regression analysis that includes many factors that potentially affect lake water quality, including practice X. A significance level set at 5 percent probability of Type I error would require strong evidence that the conservation practice was effective. But if the practice is not costly and the value of better water quality is substantial, then a higher significance threshold of 20 percent (meaning the observed improvement would have occurred 20 percent of the time without the practice) would be appropriate.
light wavelengths (albedo) to identify vegetation or to use audio sensing to identify wildlife in a place where no human observer is present.
Statistical methods are well suited to describing effects from the current food system. Multiple regression models (see Box 7-3), if properly designed, can identify correlates of important food system effects. A key to proper design is to include among the explanatory variables only those
that are exogenous, or determined outside the system, with respect to the outcome variable (in order to avoid confounding correlation with causation) (Intriligator, 1978). In interpreting the results of a multiple regression model, the appropriate significance level to use will depend on the type of statistical error that is most relevant for the study at hand.
The U.S. government maintains a variety of major datasets that can be useful for assessing the health, environmental, social, and economic effects of the food system. Several of these are listed in Appendix B, Table B-3, with additional notable datasets discussed in the earlier chapters on health, environmental, social, and economic effects of the food system.
An important point to remember is that data sources should be carefully evaluated to determine whether they are appropriate to the question being examined and to identify any limitations. If existing resources are insufficient to appropriately address the question being examined, the researcher should consider collecting new data.
Measuring Quantity and Quality Dimensions in Alternative Food System Configurations
Alternative food system configurations differ from the predominant current system either because they do not exist (yet) or because they currently exist only on a different (often smaller) scale. As a result, direct measurement and indicator measures typically are either not feasible or not sufficient to anticipate their effects on a large scale. Given that the food system is a complex adaptive system, simulation modeling may be the best tool to predict certain effects of the food system (van Wijk et al., 2012). Simulation models (see Box 7-4) can be used to run “experiments” in which each alternative system is tested under the same conditions.
Although simulations may not be fully accurate representations of reality, such experiments have certain advantages. In the real world, an alternative food system configuration may exist only in a limited area or under special market or policy conditions. As a result, making real-world comparisons between the dominant food system and a smaller alternative may raise problems of selection bias—meaning that findings from the smaller alternative may not be scaled up reliably. For example, the price premium for organically grown foods sold in relatively small quantities may result from purchases by customers who are willing and able to pay high prices. For the same organic foods to be sold in greater volume, the price premium would likely have to shrink to accommodate customers who were not willing or able to pay the full, current premium.
Simulation models are best used with virtual versions of an experimental research design, like those used for laboratory experiments in the real world. The experimental treatments may take the form of scenarios,
BOX 7-4
Types of Simulation Models
Simulation models come in several types, all of which can help to measure one or another of the quantity, quality, distribution, and resilience dimensions of food system assessment analyses. They can be broadly classified as descriptive, predictive, postdictive, and prescriptive (Schoemaker, 1982). Descriptive models help to understand systems by describing their components and processes. Predictive models forecast future system performance. Postdictive models help to diagnose past system performance. Prescriptive models make recommendations for actions to achieve desired outcomes. Models can further be organized based on time horizon, spatial extent, and number of actors. Statistical models are often used for descriptive and postdictive purposes to understand a system. Statistical models can often be improved by supplementing data with knowledge from scientific theory, as is done in the subfields of biometrics and econometrics. Several important models of the food system use statistics to understand basic relationships or to extrapolate to the future from recent experience. Examples of basic relationships are children’s rates of growth in response to nutrients and changes in consumer purchases in response to changes in price and income (price and income elasticity of demand). Microbiological growth and inactivation models also are available to predict behavior of foodborne pathogens in foods.
Certain important research questions involve predicting the distant future or analyzing unprecedented shocks to the food system that cannot be analyzed statistically. Climate change is one example. For such questions, dynamic simulation models can generate useful predictions. These models are built from data, variables, parameters, and equations that describe how the state of the system responds as components of the model evolve over time (Dent and Blackie, 1979; Law and Kelton, 1991; Van Dyne and Abramsky, 1975).
such as scenarios for alternative policy treatments in the face of a set of different climate change projections. The simplest approach to simulation experiments is to compare treatments under average conditions. Results from such “deterministic” models can be treated as most likely outcomes under the alternative scenarios. More sophisticated experiments compare probability distributions of simulated outcomes from different scenarios, which exemplify the distribution and resiliency dimensions of assessment.
Simulation models can be particularly useful for assessing multiple outcome effects from scenarios describing possible conditions that cannot currently be observed (e.g., changed climate). Depending on the nature and complexity of the model(s), a variety of outcome effects can be simulated and compared. For example, a comprehensive literature review on possible climate change effects on farm households included a wide variety of simulation model types. The review examined model outcome effects,
A simulation approach often used to study complex systems is agent-based computational modeling (ABM). In an ABM, complex dynamics are modeled by representing individual actors (“agents”) in the system, each with specified initial conditions and a set of adaptive rules that govern their interaction with each other and with their environment. In this way, the computer simulation of individual decision making and decentralized interactions “grows” dynamics and patterns (at both the individual and aggregate levels) from the bottom up (Hammond, 2009). ABMs offer certain advantages for modeling complex systems. Because every individual is explicitly modeled in an ABM, substantial heterogeneity can be captured in both the types of actors and the distributions of individual characteristics within actor types. Thus, ABMs can incorporate “bounded rationality” or insights from behavioral economics. ABMs also can incorporate spatial complexity (e.g., of geography or social networks), interactions among actors, and adaptation through time. The ABM approach has been used to study a wide variety of topics in social science and public health, including some work focused on the food system.
Prescriptive models are appropriate when the research question dwells on identifying an optimal strategy. Mathematical programming models identify optimal solutions to a specified objective function. These are often used for economic purposes, such as minimizing the cost of meeting nutritional needs. Computable general equilibrium models represent one important class of math programming models of the food system that capture market feedbacks for prices and quantities in response to some system change (e.g., due to policy or technology). Dynamic programming models optimize over a fixed time horizon, although they can be adapted to a moving time horizon (Chen et al., 2014).
including profit, food self-sufficiency, food security, risk, and altered climate change (van Wijk et al., 2012). These outcomes span health, environmental, social, and economic effects. Although the authors found a trend toward integration of multiple models in order to simulate more diverse effects, they called for further advances in coordinated modeling—even at the agricultural production scope of their study. Box 7-5 illustrates integrated modeling of economic and environmental effects from biofuel market and policy analysis.
Measuring Distribution and Resiliency Dimensions
The distribution dimension of assessment measures helps to capture the heterogeneity in our world. People, food, weather, and landscapes all exhibit enormous diversity. Some individuals may be particularly vulner-
BOX 7-5
Integrated Models to Predict Feedbacks and Multiple Effects: Biofuel Policy Analysis
The complexity of food systems makes it particularly important to conduct assessments from a system-wide perspective. Simulation models that are connected across domains of the food system can capture feedbacks between human choices in policy and markets and associated repercussions for environmental and health effects. The best developed category of such linked human-biophysical models is composed of “bioeconomic” models that link economic behavior with biophysical processes. Recently, linked bioeconomic models have been used to evaluate how bioenergy policy affects food and energy supplies along with environmental effects. For example, the BEPAM computable general equilibrium model has been linked to the GREET greenhouse gas model to forecast U.S. national biofuel policy outcomes for prices in food and fuel markets as well as associated climate change consequences (Chen et al., 2014). Similar biofuel policy analysis at the regional scale has linked an economic optimization model to the EPIC biophysical model to simulate water quality, soil quality, and climate effects from profit-maximizing farmers in the face of rising prices for energy biomass with other prices assumed to remain constant (e.g., Egbendewe-Mondzozo et al., 2011).
able to bad outcomes (e.g., poor people are vulnerable to food price spikes, residents living over shallow aquifers may have greater exposure to nitrate contamination of groundwater from fertilizers, and people with immune-depressed systems are more vulnerable to foodborne illness). Understanding the distribution of food system effects over a range of possible conditions as well as resilience (the food system’s ability to bounce back after unusual pressures) matters for good assessments.
Distribution and resilience are more difficult to measure than are average quantity and quality effects because they refer to the range of possible effects over space and time. It is possible to measure the range of many outcomes from the current food system because we can observe it. But we cannot observe “what if” scenarios—potential realities that might happen or might have happened; instead we can only observe what actually did happen. Some of the variability (both in what happened and in what might have happened) is driven by underlying processes that are understood, but other parts of that variability are random and less understood. If the underlying processes are changing, it may not even be possible to understand the true distribution of effects from the current food system by studying histori-
cal data. For example, if the climate is changing due to rising greenhouse gas levels, then the likely range of possible weather conditions next year is not what it was 30 years ago. The same evolving processes also make it difficult to measure resilience because the system’s past ability to bounce back after unusual pressure may not be a good measure of its ability to do so in the future.
Some important food system effects occur under extreme conditions. For example, properly managed pesticides can still cause a consumer health hazard if sudden hard rain after spraying washes the unabsorbed pesticide into a drinking water supply. Appropriately capturing these uncommon situations will require a focus not just on average quantity or quality effects but rather on measuring the probability that any given effect exceeds a threshold level. Exceeding certain threshold levels can trigger extreme outcomes with irreversible consequences that matter not just in a distributional sense but, more importantly, because they can alter the resilience of a system. Information on the probability of extreme effects can be used to evaluate the appropriate margin of safety to reduce the probability of undesirable outcomes, such as rain-generated spikes in soluble phosphorus that can cause lakes to become eutrophic (Langseth and Brown, 2011). Margins of safety based on such thresholds are the basis of existing upper bound reference doses (RfDs) established by the Environmental Protection Agency (EPA) for a variety of toxic substances, including pesticide residues and food contaminants (NRC, 2009). Understanding the nature of thresholds and associated regulatory reference values is important in estimating or simulating the probability of extreme effects. For example, EPA’s RfD approach, discussed in the example in Annex 1A, is built on RfDs below which there is a high probability of no observable adverse effect. Comprehensive measurement or modeling of extreme effects (e.g., exposure–response relationships for toxic substances) should focus on the entire probability distribution of outcomes, not truncating measurement at regulatory thresholds (Cohen et al., 2005).
Once well-validated simulation models have been developed, they can be used to generate a large number of experimental replications with input data representing the full range of potential real conditions (Law and Kelton, 1991). Stochastic simulations produce a range of outcomes in response to random inputs like weather; they may explicitly incorporate measurement error associated with key variables and equations. Outputs from these simulations can be ordered into empirical probability distributions of key outcomes. These, in turn, can be compared across treatments to reach conclusions about resilience and vulnerability under extreme situations, as well as to inform decision making given differing tolerances for risk (Arrow, 1971; Hadar and Russell, 1969; Pratt, 1964). Stochastic simulation that integrates multiple models can generate probability distributions
of outcomes on multiple effects of interest for risk analysis (van Wijk et al., 2012). For example, Rabotyagov (2010) was interested in policies to limit the risk of soil carbon loss. Using a soil and crop model, he ran stochastic simulations to compare how two policies (land retirement versus conservation tillage) would affect soil carbon sequestration over time and space in one Iowa watershed. He then linked the soil environmental effect simulated data to randomly drawn cost data from the U.S. Department of Agriculture and used an economic optimization model to evaluate which policy would generate the best margin of safety against soil carbon loss (Rabotyagov, 2010).
With simulation models, as with datasets, the assessment team must decide whether to build a new one or to draw on an existing model. The most compelling argument for building a new simulation model is that the model can be tailored to the specific research question of interest. A variety of simulation modeling methods exist, along with methods for evaluating the validity of the model (Anderson, 1974; Hanks and Ritchie, 1991; Van Dyne and Abramsky, 1975). However, using an existing simulation model can be desirable if a suitable model exists. Key criteria for determining whether a model is suitable are: it has passed scientific peer review, it has been well validated through testing in multiple settings, and it is well suited to the time horizon, spatial extent, and key component interactions of interest. Preexisting simulation models are best used in collaboration with knowledgeable modelers, because the models often need some adaptive programming to address new research questions. For many agricultural, economic, and environmental purposes, good models do exist (see Appendix B, Table B-4).
Developing or adapting reliable simulation models to measure distributional and resilience effects can be costly. At least for monetary measures of income or expenditures, a less costly approach than simulating a probability distribution is to calculate conditions needed to reach a threshold of price or quantity under an alternative scenario that would match a baseline case (e.g., when an alternative food system configuration would match the current system). Breakeven analysis is a tool for calculating such a threshold, typically applied to breakeven price or quantity levels (Dillon, 1993; Tyner, 2010).
SYNTHESIS: INTERPRETATION, SYNTHESIS, AND TRADE-OFFS
A comprehensive assessment that covers all four effect areas will have results related to health, environment, society, and economics. Even a single one of those areas can have different results for different population groups or over different time horizons. Consider an assessment that finds that a policy change would improve child nutrition, deplete aquifers, reduce farm
income, improve retail food affordability, and reduce rural employment. Should the policy change be enacted? To reach a conclusion requires synthesis of these diverse effects.
How to synthesize results to reach appropriate conclusions or recommendations is a major challenge for comprehensive assessments that account for effects on multiple domains across multiple measurement dimensions. Especially when alternative scenarios are evaluated, assessors are often called on to identify which is “best” by one or more criteria. Yet when outcomes have multiple attributes and involve trade-offs, a definitive answer may not be possible. In the case of the food system, quantity, quality, distribution, and resilience represent four important dimensions—but attributes within each of these dimensions may be of concern to some people and not others, and they may vary by place (different communities) and time (different seasons or years).
For evaluating preferences across outcomes, it may be sufficient to consider only the differences between the outcomes rather than the actual levels of the attributes. For example, in comparing two outcomes that differ on food prices, it may be sufficient to know only the difference in prices (of various foods) rather than the absolute prices of foods under each outcome. For other attributes, the absolute levels are also important. For nutrients, the benefit of increased intake is much greater if dietary intake is insufficient; increased intake may even be harmful if dietary intake exceeds requirements.
Evaluation methods differ in the extent to which they aggregate across multiple attributes. At one extreme, synthesis can include the levels of each relevant attribute under each of the outcomes (alternatively, the differences in each attribute from one of the outcomes, i.e., the base case). This information can be presented in many formats. For example, it can be presented as a table, with each column corresponding to a relevant attribute and each row displaying the attribute levels for a particular outcome. It also can be presented as a radar or spiderweb diagram (see Figure 7-2), where each attribute is represented by a ray from the origin (center) of the diagram and the length of the ray shows the level of the attribute for a particular outcome. Radar diagrams can be used to compare the pattern of attributes from one scenario to another.
Alternatively, some or all of the attributes may be aggregated into an index. A very simple (probably nonsensical) index could be obtained by adding the attribute levels together; a potentially more useful index might be the total benefits minus costs of an outcome (compared with a reference outcome).
Each method (indexing versus disaggregating measures) has advantages and disadvantages. A disaggregate approach, like a table or radar diagram, can present a large amount of information, but it relies on the
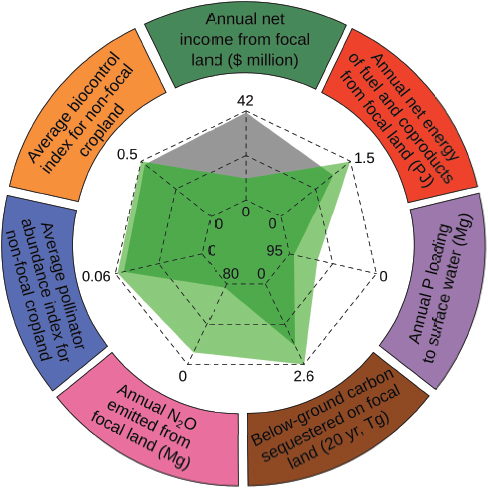
FIGURE 7-2 Radar diagram illustrating multidimensional trade-offs among ecosystem services associated with continuous corn (gray) versus bioenergy crops (green) (Meehan et al., 2013). As indicated by numbers on the axes, greater distance from origin is desirable for some dimensions (e.g., income), while less distance is desirable for others (e.g., less P or N2O pollution). Units of measure are described in the outer circle.
reader to aggregate across attributes, typically by holistic judgment. Moreover, even if analysts choose not to aggregate across attributes, they must still choose which attributes to report. Different readers may be interested in different attributes; so, in principle, analysts need to include all of the attributes that any reader would judge relevant, potentially producing a table or radar diagram that provides so much information it is unwieldy
to evaluate. Such a presentation also must consider the issue of units of measure. For a table, the choice of units can make the level of an attribute look large or small relative to other attributes; for a radar diagram, the attributes that extend farthest from the origin will tend to appear most salient. Interpretation is easier if all of the attributes can be described by measures for which an increase is beneficial; it is difficult for a reader to synthesize disaggregated information when an increase is beneficial for some attributes (or for some levels of an attribute) but otherwise harmful (as illustrated by Figure 7-2).
Some evidence suggests that evaluation using holistic judgment tends to be less accurate than evaluation using the competing approach of aggregating attributes using a mathematical formula (Dawes et al., 1989; Sunstein, 2000). Because it is difficult for humans to consider more than a handful of attributes at the same time, a few attributes may receive undue weight in a judgmental evaluation.
The attribute levels can be combined into an index in many ways. One theoretical approach is to construct a social utility function that includes weights of each of the effects (or attributes) that people care about, including health, environmental, social, economic, and other attributes. A social utility function assigns a larger number to a societally more preferred outcome. Such a function can (sometimes) be created by considering how society should trade off among different attributes (Keeney and Raiffa, 1976). However, when individuals rank the outcomes differently, the Arrow impossibility theorem (Keeney and Raiffa, 1976; Stokey and Zeckhauser, 1978) shows there is no best way to reconcile these differences.
Benefit–cost analysis (BCA) and cost-effectiveness analysis (CEA) are often used to help evaluate social outcomes. BCA attempts to estimate the net monetary benefits of an outcome compared with a reference outcome. These are defined as the benefits to the individuals who gain from the move to a new outcome minus the costs to individuals who are harmed by that move. Benefits and costs to individuals are defined as the monetary compensation that provides the same change in well-being as the change in outcome. Use of BCA requires that these monetary amounts can be estimated for all of the (important) changes in attribute levels. CEA is similar to BCA except that changes in one of the attributes are measured in some non-monetary unit, often a physical unit (like tons of corn produced or cases of cancer avoided), or a unit that aggregates changes in a subset of attributes (like quality-adjusted life years, or QALYs, that combine fatal and nonfatal health effects into a measure of healthy time lost to death or illness). CEA can be used to compare the cost (in terms of all of the attributes measured in monetary terms) per unit gain in the effect (the attribute measured in nonmonetary terms), but the question of whether that cost
is justified by the gain must be answered independently of the CEA. (For further reading on BCA, see Boardman et al., 2010; Freeman, 1993; Layard and Glaister, 1994; Stokey and Zeckhauser, 1978; for further reading on CEA, see Drummond et al., 2005; Gold et al., 1996.)
Social welfare functions (SWFs) provide an alternative method for creating an index, one which attempts to account for concerns about the distribution of well-being in a society (Adler, 2012). The utilitarian SWF adds the well-being of everyone in society. Under this SWF, a gain of one unit of utility counts the same regardless of who receives it. In contrast, a prioritarian SWF adjusts each person’s well-being by a concave function, then adds these transformed well-being levels across people. The concave function has the effect of counting a gain in well-being more heavily if it is received by someone with an initially low well-being than by someone who is better off. An important limitation of SWFs is that they require agreement on some method to measure (summarize) individuals’ well-being in a way that can be compared between individuals (i.e., so that one can say which of two individuals gains more from a specified change). A second limitation is that one must specify which SWF is appropriate, including specification of numerical parameters that characterize the degree of aversion to inequality and other features of the SWF. Although these functions have strength in theory, they have rarely been applied in practice.
One advantage of methods that aggregate the attributes (effects) into an index is that the aggregation formula is explicit. This promotes transparency, in comparison with reporting disaggregated attributes. On the other hand, individuals who disagree with the weighting of attributes in an index may find the index invalid. An advantage of reporting individual attributes separately (as in the radar diagrams) is that stakeholders can discuss and debate trade-offs among the attributes.
BUDGETARY CONSIDERATIONS
The complexity and dynamics of the food system make truly comprehensive approaches to assessing its health, environmental, social, and economic effects ambitious and costly. But quality assessments of focused problems can be done at lower cost, with acknowledged limitations.
Simplified, lower-cost assessment approaches should explicitly recognize how simplification is likely to affect results. Simplification calls for assumptions that narrow the validity and/or the potential to extrapolate general lessons from the results. Plans for how to simplify assessments should start by considering the food system as a whole. First, they should explicitly identify what assumptions are necessary to make the simplification(s) under consideration useful and appropriate. One common simplifying assumption
BOX 7-6
Checklist for Implied Simplifying Assumptions
- Does it encompass the full food supply chain?
- Does it address all four domains and dimensions of effects?
- Does it account for interactions and dynamic feedback processes?
- Does it account for heterogeneity in the human population and environmental setting?
of ceteris paribus holds that everything outside the model is held constant. Another is to restrict focus to only certain effects of the food system (often because budgets limit the range of expertise among the assessors). Assessment teams should be explicit about potential effects of narrowing the range of assessors’ domains of expertise, which can include biases from their own professions or scientific disciplines. Second, for each simplifying assumption, assessors should evaluate the likelihood of conditions occurring that would invalidate the assumptions. If such a condition is likely to occur, then the assumption is inappropriate.
One useful way to present a simplified assessment protocol is to list explicitly the domains and dimensions of the food system, indicating how each one is addressed and what the associated assumptions are. Explicit acknowledgment of the assumptions behind the scope of a study is rare, and we know of no assessment to date that clearly documents assumptions along these lines. One assessment protocol that moves in this direction describes for each step in the assessment what is “basic” information (cheaper to collect, but implicitly with more limiting assumptions) versus “extended” information (more costly, but freer of assumptions). This listing is applied to multi-domain assessment of the impacts of integrated pest management (Swinton and Norton, 2009).
All studies make some simplifying assumptions. To inventory relevant assumptions, a checklist can be a useful point of departure. Box 7-6 offers a series of questions to help test for implied assumptions about several dimensions of complexity that are especially prone to simplification. Whether these assumptions are valid deserves attention at the time of the initial scoping exercise. Specifically, what major interactions are omitted? Are dynamic feedbacks omitted or reduced? What level of heterogeneity is captured in human populations? What about heterogeneity in the environmental setting (e.g., land, water, air, biodiversity)?
ENGAGING STAKEHOLDERS
Similar to the guidance provided in the National Academy of Sciences reports on risk assessment, science and decision making, and health impact assessment, this committee views stakeholder2 engagement and participation as important components of the proposed framework. The early and central role of stakeholder identification and participation has been described in these aforementioned reports, as well as by the Presidential/Congressional Commission on Risk Assessment and Risk Management (1997), and this approach also is supported here. Stakeholders have the potential to make valuable contributions at each stage of the assessment process. For example, information collected from stakeholders can help to illuminate important issues, focus the scope, provide local knowledge on the problem of interest and potential impacts, offer suggestions for alternatives that might be acceptable to the public, share perspectives on the recommendations, identify ways to disseminate the findings, and allow for representative participation from those with a stake in the problem bring addressed by the assessment (NRC, 2008, 2011). Stakeholder involvement during the assessment step can be especially important when data are lacking.
Techniques for active stakeholder engagement vary, but they should address and respond to the specific barriers and challenges identified for engaging each stakeholder group relevant to any given assessment. Prior assessments have engaged stakeholders using open community meetings, public hearings, more structured focus groups, surveys, webinars, interactive technologies, and open written comment periods (NAS, 2003; NRC, 2008, 2009, 2011). Further guidance on the best practices to engage stakeholders can be found in several documents, including the Stakeholder Participation Working Group of the 2010 HIA (Health Impact Assessment) in the Americas Workshop (2011), NRC (2008), Israel and colleagues (1998), and a classic paper by Arnstein (1969).
The committee also recognizes that stakeholder participation can present many challenges, and teams conducting food system assessments should become familiar with potential pitfalls and consult with other groups that are experienced at addressing them. Reported experiences from previous impact assessments (e.g., environmental impact assessment [EIA], health impact assessment [HIA]) show that participatory processes can sometimes favor those who have more resources and expertise and exclude those with fewer resources (NRC, 2008, 2009, 2011). In addition to representation of
_____________
2 Stakeholders are community groups, industry, consumers, advocacy organizations, and workers who are not part of the technical assessment team and are often detached from the assessment process (NRC, 2009, 2011).
diverse interests, careful consideration should be made about whether key leaders or formal groups are authorized or in a position to “represent” the class of stakeholders or the broader public, such as in the case of a union leader speaking on behalf of his or her union membership, or industry executives representing the interests of consumers or workers. Thus, using a participatory process requires careful thought about both who is involved in the process and who is omitted from the process. Stakeholders inevitably have biases in their perspectives, and effective engagement processes use mechanisms to make these biases transparent. Other challenges to effective stakeholder engagement may include limited resources or expertise among the assessors in participatory engagement methods; the public’s distrust of scientists, research, or public processes; and practical considerations, such as language or literacy barriers (NAS, 2003; NRC, 2011). Finally, it is important to note that applying the framework to a highly polarized and controversial topic may require that the scientific assessment process maintain a certain distance or buffer from the influence of powerful stakeholders in order to create space for objective and independent decisions related to scoping, scenario development, and analysis activities.
USING THE FRAMEWORK
The framework provides a set of design considerations for planning an assessment of the food system across the domains of health, environmental, social, and economic effects. It invites the user to think explicitly about system boundaries, dynamics, heterogeneity across space and populations, and the range of driving forces that shape food system outcomes. The framework is necessarily very general, as specifics for any particular study will depend on the problem being examined. Most existing studies, regardless of methodology, define rather narrow boundaries to construct a model, find or collect suitable data, and interpret the results in a way useful to their purpose. Inevitably, many of these studies make the assumption that “all else remains equal/unchanged” except the perturbations in their study. What this framework suggests is that all else does not remain equal and that any meaningful assessment must consider the likely and unintended consequences of proposed change or of the status quo when its performance is in question. An illustrative, brief example on antibiotic resistance (see Box 7-7) is provided to demonstrate how the various steps of the framework might be applied. Five additional detailed examples are presented in the annexes to this chapter.
BOX 7-7 Illustrative Example: Antibiotic Resistance
The recent rise in antibiotic resistance (AR) among pathogenic bacteria has become a global public health crisis and is now recognized as one of the top health challenges facing the world in the 21st century (CDC, 2013; Marshall and Levy, 2011; Smith et al., 2002; Woolhouse and Ward, 2013). Growing resistance may lead within decades to ineffectiveness of entire classes of antibiotics that are currently central to clinical treatment of humans (Wellington et al., 2013) as well as agricultural production (Teuber, 2001).
The problem of antibiotic resistance provides an excellent example to motivate and illustrate the framework presented in this report. Below, we walk through the six key framework steps, discussing key considerations for potential assessments of the problem of AR and highlighting the importance of all four crosscutting framework themes. As will become clear, the problem of AR involves all four domains of effects, substantial complexity and dynamics across the entire food system, and important potential trade-offs between food system or policy configurations.
Steps for Applying the Framework
The text below does not represent an implemented assessment of AR, but rather is intended to highlight the features of the problem and potential decisions that would be important to consider in undertaking each step of any such assessment. It follows the six central steps of the framework: (1) Problem and Question; (2) Scope; (3) Scenario; (4) Analysis; (5) Synthesis; and (6) Reporting.
Identify the Problem
Assessment should begin by defining the key elements of the problem under consideration, including historical and food system context. Antibiotic resistance is a naturally occurring and ancient phenomenon, but its extent has likely been affected in recent history by increased use of antibiotics by humans for two purposes: medical care and food system use (CDC, 2013; Gustafson and Bowen, 1997; Marshall and Levy, 2011; Teuber, 2001; Wellington et al., 2013; Woolhouse and Ward, 2013). Widespread antibiotic use for treatment of bacterial infection in humans began in the early 20th century. More recently, antibiotic use also has become widespread within the food system, in three distinct applications: therapy (veterinary treatment in farm animals or aquaculture); prophylaxis to prevent endemic disease in herds, flocks, or orchards; and use at subtherapeutic levels for increased growth and feed efficiencies (especially in livestock) (Marshall and Levy, 2011; Smith et al., 2002; Teuber, 2001; Woolhouse and Ward, 2013).a The use of antibiotics as growth promoters was first advocated in the 1950s and became widespread as the cost of application came down (Gustafson and Bowen, 1997; Marshall and Levy, 2011). Today, estimates vary regarding the relative quantity of antibiotics used in the U.S. food system versus those used in human medicine—and antibiotic use in food production varies substantially throughout
the world (CDC, 2013; Marshall and Levy, 2011; Smith et al., 2002; Teuber, 2001; Wellington et al., 2013; Woolhouse and Ward, 2013). However, most experts agree that antibiotic resistance is now widespread in both settings (human and food system) and that both contribute to the rise in AR through multiple, complex pathways (Woolhouse and Ward, 2013).
To proceed with applying the framework, the assessment team should define clearly the specific question to be answered. Several distinct questions are raised by the growing problem of AR, and the relative focus might vary between assessments. For example, one central question is “What is the impact of the current U.S. food system (relative to human medicine) in driving the growth and maintenance of AR?” Other relevant research questions are, “What is the relative importance of the various distinct pathways through which food system dynamics influence AR?” and “What will be the likely impact on future AR of one or more specific shifts in food system structure or policy?” Some assessments may wish to answer more than one of these questions in a linked way. Choices of scenario, data, and analytical method (below) will be driven in part by the choice of question.
Define the Scope and Scenario
The next steps in applying the framework involve defining the scope and scenario under consideration. In these steps, two important themes are central to a good assessment. The first is to “recognize effects across the full food system” and across biophysical, social, economic, and institutional contexts for the system. For an assessment of AR, consideration of the entire supply chain is likely to be important—including chemical manufacture of antibiotics as inputs, use for treatment or growth promotion (e.g., in animal husbandry, aquaculture, or fruit production), use for medical purposes by food workers, and the potential exposure of consumers to resistant bacteria through food or environment (Marshall and Levy, 2011; Smith et al., 2005; Teuber, 2001; Wellington et al., 2013; Woolhouse and Ward, 2013). Multiple contexts also will be important, including environmental transfer of resistance genes among co-located bacteria, the food production and processing workplaces, and even patterns of global flow in water, human contact, and animal migration (Allen et al., 2010; Marshall and Levy, 2011).
A second key theme is to “consider all domains and dimensions of effects.” In the case of AR, existing evidence already suggests multiple effects in all four major domains considered in this report. Economic effects include benefits of antibiotic use, such as enhanced production of food at decreased cost and the prevention of costly epidemics, but also economic costs, such as excess medical spending due to AR (CDC, 2013; Gustafson and Bowen, 1997). Health benefits include reduction in zoonotic disease and bacteria and parasites entering the food chain; health costs include decreased ability to effectively treat some diseases due to resistance and movement to more toxic or less effective medicines due to AR (CDC, 2013; Marshall and Levy, 2011; Wellington et al., 2013). Antibiotic resistance developed in the food system can affect human health via two pathways, direct contact with animals by way of food consumption and contact with bacteria in the environment. Environmental effects extend beyond growth in the soil and water “resistome” within ecosystems to impacts on nonhuman, nonfood species
through the buildup of antibiotics (many of which are not very biodegradable) (Wellington et al., 2013).
The choice of a scenario (specific food system configuration) for assessment should be driven primarily by the specific question chosen in Step 1. For questions about the relative contribution of the food system and human medicine to current AR, historical and/or current configurations of the system will be appropriate to consider. For questions about the potential impact on future AR of changes to the status quo, appropriately modified configurations may be more relevant.
Conduct the Analyses
Choice of data metrics and analytical method also will be driven, in part, by the specific question chosen. However, features of the topic (here, antibiotic resistance) will likely also provide important guidance. In applying the framework, two key themes for analysis are critical.
First, analysis should “account for system dynamics and complexities.” This is especially important in the case of AR, as the evidence suggests that each of the characteristics of a complex system (see Chapter 6) is both present and important. Adaptation is central to AR—evolution of resistance is an adaptive response by bacteria species over time (Allen et al., 2010; Smith et al., 2005). The emergence and spread of AR within and between species is a complex and dynamic process involving selection pressure, population dynamics, and evolution (Marshall and Levy, 2011; Smith et al., 2005; Wellington et al., 2013); sufficiently rich representation of this process can be critical to accurate assessment of changes in AR. Some evidence suggests that timing and sequence of any interventions into the system can matter enormously, and that the dynamics of AR spread may be highly nonlinear (Marshall and Levy, 2011; Smith et al., 2002). Also important is interdependence between factors within (and outside of) the food system. For example, genetic selection for resistance can be driven by the interaction of the total amount of antibiotics used in the system and how many individual animals are consuming them (Marshall and Levy, 2011). Similarly, the impact of use within the food system may depend on interaction with transmission dynamics outside of the system (e.g., within human health care) (Smith et al., 2005). Feedback between prophylactic and treatment use within the food system, as well as feedback among classes of antibiotic drugs used in food production and in human medicine, are well documented (Marshall and Levy, 2011; Phillips et al., 2004). Finally, spatial complexity plays an important role in AR. Population structure and movement (both of humans and animals) shape the dynamics of its spread, and antibiotics themselves (as well as resistance genes) move through space via wind, dust, watershed, insects, and soil (Allen et al., 2010).
A second theme for analysis is to choose appropriate methods and metrics for the topic. In the case of AR, data challenges loom large. The spread of AR bacteria and resistance genes are intrinsically difficult to measure, given the multiple pathways at work and the potentially long chain from origin to destination (Smith et al., 2005). Moreover, data are in short supply. Data on antibiotic use are
not systemically collected in the United States; in much of the world, the use of antibiotics for growth promotion is unregulated and no data are collected at all (Marshall and Levy, 2011; WHO, 2014). Widely varying empirical estimates can be found for many questions. For example, attempts to estimate the relative amount of antibiotics used in human medicine and in the food system reach conclusions ranging from roughly comparable amounts in both contexts to much higher levels of use in the food system than in medicine (Phillips et al., 2004; Smith et al., 2005). Within the food system, comparisons of the amount of antibiotic use for growth-promotion versus therapeutic treatment range from roughly equal to an order of magnitude higher (Phillips et al., 2004; Smith et al., 2005). Similarly, attempts to interpret the impact of the “natural experiment” created by the European ban of nontherapeutic antibiotic use vary, with some studies finding significant reduction in use and resistance (Marshall and Levy, 2011), but others finding concomitant (and offsetting) increase in therapeutic use (Phillips et al., 2004). New methods for measurement, including genome sequencing and advanced molecular detection technology, offer the potential to address some of these gaps (Marshall and Levy, 2011; Woolhouse and Ward, 2013), but they are unlikely to fully address the limitations of empirical analysis in this arena.
Partly for this reason, and partly because of their ability to capture dynamic complexity, mathematical and computational models are promising tools for the study of AR (Smith et al., 2002, 2005; Wellington et al., 2013). They offer the potential to directly represent the biological mechanisms at work (many of which are well understood) and to simulate dynamics across populations and space (Singer and Williams-Nguyen, 2014; Verraes et al., 2013). Such models can sometimes help to anticipate the potential consequences of policy choices and to guide timing and implementation of interventions (Singer and Williams-Nguyen, 2014; Smith et al., 2002, 2005; Wellington et al., 2013).
Synthesize and Report
The final steps in applying the assessment framework involve synthesizing and interpreting results from the analysis, and then reporting the outcomes to multiple audiences.
In the context of rising AR, the absence of definitive data (and the limited amount of modeling completed to date) has led to a debate over what to do (Marshall and Levy, 2011; Woolhouse and Ward, 2013). The “precautionary principle” has led the European Union and the U.S. Food and Drug Administration (FDA) to err on the side of caution and limit antibiotic use (FDA, 2014; Smith et al., 2005). The Centers for Disease Control and Prevention has argued that the use of antibiotics for growth promotion in the food system, for example, “is not necessary and should be phased out” (CDC, 2013). FDA proposes a voluntary plan with industry to phase out the use of certain antibiotics in food production. On the other side of the debate, many have argued that appropriate risk assessments have not yet been carried out, and that limiting antibiotic use in the food system is likely to have costly, known (and perhaps unanticipated) consequences (Phillips et
al., 2004). This helps to illustrate an important aspect of many assessments—the results may offer no certainty or definitive guidance, leaving an important role for judgment. Indeed, the assessment may uncover unavoidable trade-offs. An assessment should aim to present results in a balanced and accurate manner that neither over- nor underinterprets, recognizing that different audiences may draw different conclusions from the report about “what to do.”
The framework also stresses the need to address (and include) many stakeholders as audiences to whom the results are reported. In the AR case, potential stakeholders include regulatory bodies, livestock and aquaculture producers, food safety groups, physicians and hospitals, insurance companies, drug manufacturers, environmental safety agencies, and consumers.
_______________
a Use of antibiotics for growth promotion in aquaculture has been phased out in North America (although imported seafood may have been treated in this way); therapeutic treatment of fish en masse by including antibiotics in fish food continues (Marshall and Levy, 2011).
SUMMARY
This chapter provides the committee’s recommendation for an analytical framework that can be used by decision makers, researchers, and other stakeholders to examine the possible impacts of interventions and collectively evaluate the outcomes of specific food system configurations in terms of the health, environmental, social, and economic domains. The committee recognizes that a systemic analysis will be an expensive endeavor, and guidance is provided for situations where analytical and financial resources may limit the scope of an assessment. Therefore, not all steps or methods will apply equally, depending on the scope and topic chosen by the assessor(s). Also, although boundaries and implications should be recognized, discrete questions might not require a full systemic analysis. In other instances, a systematic review of the literature for the relevant questions might be warranted rather than a full systemic analysis.
The goal of the framework is to guide the evaluations and the decision-making processes in the area of food and agriculture. However, any analysis is simply one input into the actual decision making, and many other factors come into play, such as judgments, that are beyond the scope of the report. This framework would be useful for (1) identifying and potentially preventing unintended effects of an intervention; (2) promoting transparency among stakeholders about decisions; (3) improving communication
and providing a better understanding of values and perspectives among scientists, policy makers, and other stakeholders; and (4) decreasing the likelihood of misinterpretation of results.
The framework is based on four principles that are associated with a desirable scope of an assessment. A good assessment should:
- Recognize effects across the full food system;
- Consider all domains and dimensions of effects;
- Account for system dynamics and complexities; and
- Choose appropriate methods for analysis and synthesis.
The assessment framework calls for considering four dimensions of effects—quantity, quality, distribution, and resilience—that measure how much of what the food system provides, where and to whom it goes, and how sustainably it can do so.
An assessment follows six implementation steps, including problem definition (determining the need for assessment and defining goals and objectives), scoping (characterizing system boundaries, components, processes, actors, and linkages), scenario definition (identifying baseline and alternatives, as appropriate), analysis (conducting the assessment), synthesis (synthesizing and interpreting results), and reporting (communicating findings to stakeholders).
The chapter discusses in detail the steps outlined and considers the variety of analytical methods that might be used in an assessment as well as how to engage stakeholders throughout the assessment process.
REFERENCES
Adler, M. 2012. Well-being and fair distribution. Beyond cost distribution. New York: Oxford University Press.
Allen, H. K., J. Donato, H. H. Wang, K. A. Cloud-Hansen, J. Davies, and J. Handelsman. 2010. Call of the wild: Antibiotic resistance genes in natural environments. Nature Reviews Microbiology 8(4):251-259.
Alston, J. M., G. W. Norton, and P. G. Pardey. 1998. Science under scarcity: Principles and practice for agricultural research evaluation and priority setting. New York: CAB International.
Anderson, J. R. 1974. Simulation: Methodology and application in agricultural economics. Review of Marketing and Agricultural Economics 42(1):3-55.
Arnand, S., K. R. Mankin, K. A. McVay, K. A. Janssen, P. L. Barnes, and G. M. Pierzynski. 2007. Calibration and validation of ADAPT and SWAT for field-scale runoff prediction. Journal of the American Water Resources Association 43(4):899-910.
Arnstein, S. R. 1969. Ladder of citizen participation. Journal of the American Institute of Planners 35(4):216-224.
Arrow, K. J. 1971. Essays in the theory of risk bearing. Chicago, IL: Markham Publishing Co.
Barrett, C. B., and M. R. Carter. 2010. The power and pitfalls of experiments in development economics: Some non-random reflections. Applied Economic Perspectives and Policy 32(4):515-548.
Boardman, A., D. Greenberg, A. Vining, and D. Weimer. 2010. Cost–benefit analysis. The Pearson Series in Economics. Upper Saddle River, NJ: Prentice Hall.
Box, G. E. P., and N. R. Draper. 1987. Empirical model building and response surfaces. New York: Wiley.
CDC (Centers for Disease Control and Prevention). 2013. Antibiotic resistance threats in the United States. http://www.cdc.gov/drugresistance/threat-report-2013 (accessed January 6, 2015).
Chen, X., H. Huang, M. Khanna, and H. Onal. 2014. Alternative transportation fuel standards: Economic effects and climate benefits. Journal of Environmental Economics and Management 67(3):241-257.
Cohen, J. T., D. Bellinger, W. E. Connor, P. M. Kris-Etherton, R. S. Lawrence, D. S. Savitz, B. Shaywitz, S. M. Teutsch, and G. Gray. 2005. A quantitative risk–benefit analysis of changes in population fish consumption. American Journal of Preventive Medicine 29:325-334.
Collins, S. L., S. R. Carpenter, S. M. Swinton, D. Ornstein, D. L. Childers, T. L. Gragson, N. B. Grimm, J. M. Grove, S. L. Harlan, K. Knapp, G. P. Kofinas, J. J. Magnuson, W. H. McDowell, J. M. Melack, L. A. Ogden, G. P. Robertson, M. D. Smith, and A. C. Whitmer. 2011. An integrated conceptual framework for social–ecological research. Frontiers in Ecology and the Environment 9(6):351-357.
Conway, G. R. 1987. The properties of agroecosystems. Agricultural Systems 24:95-117.
Cornfield, J. 1978. Randomization by group: A formal analysis. American Journal of Epidemiology 108(2):100-102.
Dawes, R. M., D. Faust, and P. Meehl. 1989. Clinical versus actuarial judgment. Science 243:1668-1674.
Deaton, A. 2010. Instruments, randomization, and learning about development. Journal of Economic Literature 48(2):424-455.
Dent, J. B., and M. J. Blackie. 1979. Systems simulation in agriculture. London, UK: Applied Science.
Dillon, C. R. 1993. Advanced breakeven analysis of agricultural enterprise budgets. Agricultural Economics 9(2):127-143.
Donner, A., and N. Klar. 2000. Design and analysis of cluster randomisation trials in health research. London, UK: Arnold.
Drummond, M. F., M. J. Sculpher, G. W. Torrance, B. J. O’Brien, and G. L. Stoddart. 2005. Methods for the economic evaluation of health care programmes. Oxford, UK: Oxford University Press.
Egbendewe-Mondzozo, A., S. M. Swinton, R. C. Izaurralde, D. H. Manowitz, and X. Zhang. 2011. Biomass supply from alternative cellulosic crops and crop residues: A spatially explicit bioeconomic modeling approach. Biomass & Bioenergy 35:4636-4647.
FDA (Food and Drug Administration). 2014. Judicious use of antimicrobials. http://www.fda.gov/AnimalVeterinary/SafetyHealth/AntimicrobialResistance/JudiciousUseofAntimicrobials (accessed January 6, 2015).
Freeman, A. M. 1993. The measurement of environmental and resource values: Theory and methods. Washington, DC: Resources for the Future.
Gold, M. R., J. E. Siegel, L. B. Russell, and M. C. Weinstein. 1996. Cost-effectiveness in health and medicine. Oxford, UK: Oxford University Press.
Gustafson, R. H., and R. E. Bowen. 1997. Antibiotic use in animal agriculture. Journal of Applied Microbiology 83:531-541.
Hadar, J., and W. R. Russell. 1969. Rules for ordering uncertain prospects. American Economic Review 59:25-34.
Hammond, R. A. 2009. Complex systems modeling for obesity research. Preventing Chronic Disease 6(3):A97.
Hanks, J., and J. T. Ritchie. 1991. Modeling plant and soil systems. Madison, WI: Society of Agronomy, Crop Science Society of America, and Soil Science Society of America.
Heckman, J., H. Ichimura, J. Smith, and P. Todd. 1998. Characterizing selection bias using experimental data. Econometrica 66(5):1017-1098.
Howitt, R. E. 1995. Positive mathematical programming. American Journal of Agricultural Economics 77:329-342.
Intriligator, M. D. 1978. Econometric models, techniques and applications. Englewood Cliffs, NJ: Prentice-Hall.
Israel, B. A., A. J. Schulz, E. A. Parker, and A. B. Becker. 1998. Review of community-based research: Assessing partnership approaches to improving public health. Annual Review of Public Health 19:173-202.
Johnson, D. M. 2013. An assessment of pre- and within-season remotely sensed variables for forecasting corn and soybean yields in the United States. Remote Sensing of the Environment 141:116-128.
Keeney, R. L., and H. Raiffa. 1976. Decisions with multiple objectives: Preferences and value tradeoffs. New York: Wiley.
Langseth, D., and N. Brown. 2011. Risk-based margins of safety for phosphorus TMDLs in lakes. Journal of Water Resources Planning and Management 137(3):276-283.
Law, A. M., and W. D. Kelton. 1991. Simulation modeling and analysis. New York: McGraw-Hill.
Layard, R., and S. Glaister. 1994. Cost-benefit analysis, 2nd ed. Cambridge, UK: Cambridge University Press.
Marshall, B.M., and S. B. Levy. 2011. Food animals and antimicrobials. Clinical Microbiology Reviews 24(4):718.
Meehan, T. D., C. Gratton, E. Diehl, N. D. Hunt, D. F. Mooney, S. J. Ventura, B. L. Barham, and R. D. Jackson. 2013. Ecosystem-service tradeoffs associated with switching from annual to perennial energy crops in riparian zones of the US Midwest. PLoS ONE 8(11):e80093.
Mendenhall, W., R. L. Scheaffer, and D. D. Wackerly. 1986. Mathematical statistics with applications. Boston, MA: Duxbury.
Michalak, A. M., E. J. Anderson, D. Beletsky, S. Boland, N. S. Bosch, T. B. Bridgeman, J. D. Chaffin, K. Cho, R. Confesor, I. Dalo lu, J. V. DePinto, M. A. Evans, G. L. Fahnenstiel, L. He, J. C. Ho, L. Jenkins, T. H. Johengen, K. C. Kuo, E. LaPorte, X. Liu, M. R. McWilliams, M. R. Moore, D. J. Posselt, R. P. Richards, D. Scavia, A. L. Steiner, E. Verhamme, D. M. Wright, and M. A. Zagorski. 2013. Record-setting algal bloom in Lake Erie caused by agricultural and meteorological trends consistent with expected future conditions. Proceedings of the National Academy of Sciences of the United States of America 110(16):6448-6452.
Moffitt, R. A. 2004. The role of randomized field trials in social science research—a perspective from evaluations of reforms of social welfare programs. American Behavioral Scientist 47(5):506-540.
NAS (National Academy of Sciences). 2003. Understanding risk. Informing decisions in a democratic society. Washington, DC: The National Academies Press.
NRC (National Research Council). 2008. Public participation in environmental assessment and decision making. Washington, DC: The National Academies Press.
NRC. 2009. Science and decisions: Advancing risk assessment. Washington, DC: The National Academies Press.
NRC. 2011. Improving health in the United States: The role of health impact assessment. Washington, DC: The National Academies Press.
Nyborg, K. 2012. The ethics and politics of environmental cost–benefit analysis. Abingdon, Oxon, UK: Routledge.
Phillips, I., M. Casewell, T. Cox, B. De Groot, C. Friis, R. Jones, C. Nightingale, R. Preston, and J. Waddell. 2004. Does the use of antibiotics in food animals pose a risk to human health? A critical review of published data. Journal of Antimicrobial Chemotherapy 53(1):28-52.
Powers, C. M., G. Dana, P. Gillespie, M. R. Gwinn, C. O. Hendren, T. C. Long, A. Wang, and J. M. Davis. 2012. Comprehensive environmental assessment: A meta-assessment approach. Environmental Science & Technology 46(17):9202-9208.
Pratt, J. W. 1964. Risk aversion in the small and in the large. Econometrica 32:12-36.
Presidential/Congressional Commission on Risk Assessment and Risk Management. 1997. Framework for environmental health risk management. Washington, DC: RiskWorld.
Rabotyagov, S. S. 2010. Ecosystem services under benefit and cost uncertainty: An application to soil carbon sequestration. Land Economics 86(4):668-686.
Robertson, G. P. 2004. Abatement of nitrous oxide, methane and other non-CO2 greenhouse gases: The need for a systems approach. In The global carbon cycle, edited by C. B. Field and M. R. Rapauch. Washington, DC: Island Press. Pp. 493-506.
Schoemaker, P. J. H. 1982. The expected utility model: Its variants, purposes, evidence and limitations. Journal of Economic Literature 20(2):529-563.
Singer, R. S. and J. Williams-Nguyen. 2014. Human health impacts of antibiotic use in agriculture: A push for improved causal inference. Current Opinion in Microbiology 19:1-8.
Smith, D. L., A. D. Harris, J. A. Johnson, E. K. Silbergeld, and J. G. Morris, Jr. 2002. Animal antibiotic use has an early but important impact on the emergence of antibiotic resistance in human commensal bacteria. Proceedings of the National Academy of Sciences of the United States of America 99(9):6434-6439.
Smith, D. L., J. Dushoff, and J. G. Morris. 2005. Agricultural antibiotics and human health. PLoS Medicine 2(8):e232.
Stakeholder Participation Working Group of the 2010 HIA in the Americas Workshop. 2011. Best practices for stakeholder participation in health impact assessment. Oakland, CA. October 2011. http://www.hiasociety.org/documents/guide-for-stakeholder-participation.pdf (accessed January 6, 2015).
Stokey, E., and R. J. Zeckhauser. 1978. A primer for policy analysis. New York: Norton.
Sunstein, R. 2000. Cognition and benefit–cost analysis. Journal of Legal Studies 29(2):1059-1103.
Swinton, S. M., and G. W. Norton. 2009. Economic impacts of IPM. In Integrated Pest Management, edited by E. B. Radcliffe, W. D. Hutchison, and R. E. Cancelado. Cambridge, UK: Cambridge University Press. Pp. 14-24.
Teuber, M. 2001. Veterinary use and antibiotic resistance. Current Opinion in Microbiology 4:493-499.
Tyner, W. E. 2010. The integration of energy and agricultural markets. Agricultural Economics 41:193-201.
Van Dyne, G. M., and Z. Abramsky. 1975. Agricultural systems models and modelling: An overview. In Study of agricultural systems, edited by G. E. Dalton. London, UK: Applied Science Publishers. Pp. 23-106.
van Wijk, M. T., M. C. Rufina, D. Enahoro, D. Parsons, S. Silvestri, R. O. Valdivia, and M. Herrero. 2012. A review on farm household modelling with a focus on climate change adaptation and mitigation. Working Paper No. 20. Copenhagen, Denmark: CGIAR Research Program on Climate Change, Agriculture and Food Security.
Verraes, C., S. Van Boxstael, E. Van Meervenne, E. Van Coillie, P. Butaye, B. Catry, M. A. de Schaetzen, X. Van Huffel, H. Imberechts, K. Dierick, G. Daube, C. Saegerman, J. De Block, J. Dewulf, and L. Herman. 2013. Antimicrobial resistance in the food chain: A review. International Journal of Environmental Research and Public Health 10(7):2643-2669.
Wellington, E. M., A. B. Boxall, P. Cross, E. J. Feil, W. H. Gaze, P. M. Hawkey, A. S. Johnson-Rollings, D. L. Jones, N. M. Lee, W. Otten, C. M. Thomas, and A. P. Williams. 2013. The role of the natural environment in the emergence of antibiotic resistance in gram-negative bacteria. Lancet Infectious Diseases 13(2):155-165.
WHO (World Health Organization). 2014. Antimicrobial resistance—global report on surveillance. Geneva, Switzerland: WHO.
Woolhouse, M. E. J., and M. J. Ward. 2013. Sources of antimicrobial resistance. Science 341:1460.
This page intentionally left blank.


