
ANNEX 4: NITROGEN IN AGROECOSYSTEMS
Nitrogen Dynamics and Management in Agroecosystems
Nitrogen (N) is essential for agricultural productivity, but in its more reactive forms, it can pose significant threats to humans and the environment. Quantifying the abundance of nitrogen in different chemical forms and understanding its pathways through soil, air, water, plants, and animals under different management scenarios are essential to minimize threats to human health and environmental quality. Nonetheless, studying multiple forms of nitrogen in the environment presents many challenges and calls for the use of a systems analysis framework.
This example illustrates several principles contained within the committee’s framework. First, it shows that the use and management of nitrogen in agroecosystems have effects that can be manifest in health, environmental, social, and economic domains. Second, it indicates that N-related farming practices can affect numerous different populations and components of managed and natural ecosystems, including members of the general public, farmers and farm workers, fish and shellfish, and wildland plant communities. Third, it makes clear that these effects can be manifest in geographical areas both near and far from sites of agricultural production and N use. Fourth, it illustrates how various drivers, especially government policies, can have significant impacts on N-related farming practices and subsequent health, environmental, social, and economic effects. Finally, the example illustrates the value of both empirical measurements and modeling analyses in assessing contrasting systems for using and managing N for food production. Although the example is presented from the perspective of the U.S. food system, the conceptual model included within it could apply to other systems in other countries as well.
The example points to research gaps. Although multiple analyses of N dynamics in agroecosystems have been conducted already, most have focused on N fluxes and transformations in a limited set of farm production systems. Recognizing that such data are difficult to obtain and costly, data collection over the long term is nonetheless critical to understanding N dynamics as they are affected by year-to-year variations in weather and by heterogeneity in soil conditions. Data collection is also needed on health, environmental, social, and economic effects and costs of N emissions over time and at regional and national scales.
Nitrogen (N) is the most limiting element for plant growth in many ecosystems, despite being the most plentiful element in the earth’s atmosphere. In its most abundant form, gaseous dinitrogen (N2), N is unavailable to most organisms. However, following transformation to other forms, especially nitrate (NO3–) and ammonium (NH4+), N becomes highly reactive in the biosphere and can be highly mobile in water and air.
Nitrogen is a key component of proteins in both plants and animals, including the enzymes responsible for photosynthesis and other critical biological reactions, and the muscles used for movement and other body functions. Consequently, most crops, especially cereals, require sizable supplies of N to yield well, and livestock and poultry need a diet rich in N to produce large quantities of milk, eggs, and meat.
Agriculture now uses more reactive N than does any other economic sector in the United States (EPA, 2011). However, it is also the sector responsible for the greatest losses of reactive N to the environment (EPA, 2011), where N has multiple unintended consequences, including threats to human health, degradation of air and water quality, and stress on terrestrial and aquatic organisms (Ribaudo et al., 2011; UNEP, 2007; Vitousek et al., 2009). Because reactive N strongly affects crop production and farm profitability, as well as human health and environmental quality, managing N efficiently and in an environmentally harmonious manner is a critically important component of agricultural sustainability (Foley et al., 2011; Robertson and Vitousek, 2009).
Identify the Problem
Assessments are typically triggered by a broad problem or concern. The first step in an assessment, identifying the problem, is often based on consultation with stakeholders and reviews of relevant literature. The problem identified for this assessment is the multiple unintended consequences of certain N management applications in agriculture. Its purpose is to compare management practices for N application in terms of the stocks and flows of nitrogen. The ideal management practice would result in high crop yields while minimizing N emissions that are harmful for the environment and, indirectly, human health and economic development.
Define the Scope of the Problem
Once a problem has been identified, the next step in an assessment is to frame its scope. This is done by characterizing the boundaries, components, processes, actors, and linkages encompassed by the system under consideration. For this example, we briefly describe the boundaries of the N system
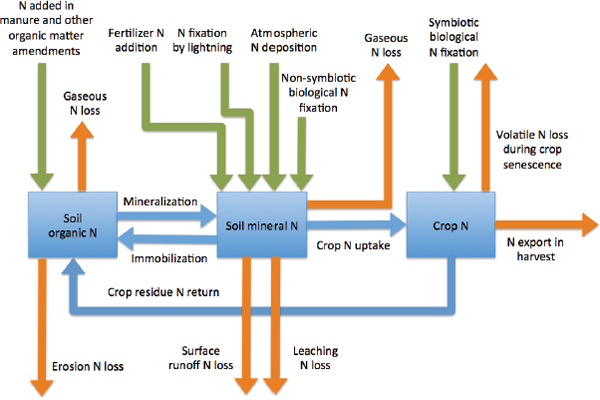
FIGURE 7-A-3 Major N stocks (boxes) and flows (arrows) for a cropping system. Nitrogen stocks and flows are not drawn to scale.
in terms of characterizing the N pathways under different environmental conditions and farming practices. We also describe what we know about the potential health, environmental, social, and economic effects over time and space. In addition, this step identifies various policies as drivers of the system.
Nitrogen Dynamics in Agroecosystems
Nitrogen can exist in multiple forms whose concentrations and movements are strongly influenced by environmental conditions and farming practices. Consequently, understanding the fate of N in agroecosystems is challenging. Models developed from the study of dynamic systems constitute one set of tools for assessing different options for configuring agroecosystems for improved N management. A simple model depicting relevant stocks and flows of N in agroecosystems used for crop production is shown in Figure 7-A-3.
Mineral N fertilizers produced through the Haber-Bosch process constitute the single greatest source of reactive N introduced into the United States, with about 11 teragrams (Tg1) of fertilizer N being used in U.S.
_____________
1 A teragram is the equivalent of 1 billion kilograms.
agriculture each year (EPA, 2011). Mineral forms of N fertilizer are energetically expensive to synthesize (57 MJ fossil energy/kg N) and sensitive to increases in the price of natural gas used in their production (ERS, 2008; Shapouri et al., 2010). Thus, the fact that typically only 40 to 60 percent of applied N fertilizer is absorbed by crop plants (Dinnes et al., 2002; Drinkwater and Snapp, 2007; Robertson and Vitousek, 2009) implies large agronomic, economic, and energetic inefficiencies, as well as a large potential for excess N to move downstream and downwind from crop fields. The exact fate of N fertilizer is heavily dependent on farm management decisions influencing N cycle processes, including crop selection, irrigation management, and the rate, formulation, placement, and timing of fertilizer applications. The fate of fertilizer N also can be highly dependent on weather conditions, especially precipitation patterns.
In addition to the application of mineral fertilizers, N may enter crop fields by several other pathways. Biological fixation of atmospheric N2 by microbes associated with the roots of leguminous crops like soybean and alfalfa (symbiotic fixation) adds about 8 Tg N per year to U.S. agroecosystems (EPA, 2011). About 6.8 Tg of N is present in manure produced each year in the United States, but of that quantity, only 0.5 to 1.3 Tg N is applied to cropland and 3.7 Tg N is deposited on pastures and rangelands (EPA, 2011; MacDonald et al., 2009), indicating that a substantial proportion of manure N is not recycled effectively. Moreover, manure application rates vary greatly among fields, with most fields receiving none and some receiving high rates (MacDonald et al., 2009). Consequently, excessive concentrations of nutrients, especially phosphorus and N, can occur in the vicinity of concentrated animal feeding operations and can lead to water pollution (Jackson et al., 2000). Additional pathways by which reactive N is introduced into agroecosystems include lightning, fixation by non-symbiotic microbes living in soil, and atmospheric deposition. The former two processes are responsible for adding only small quantities of N; the latter input can be locally important (Galloway et al., 2004).
Large amounts of N are present within soil organic matter, accruing from residues of plants and soil microbes and applications of manure and other organic matter amendments. Nitrogen comprises about 5 percent of soil organic matter by weight, and for soils with appreciable amounts of organic matter, such as many of those found in the U.S. Corn Belt, the surface 30 cm contains thousands of kilograms of N, most of which is contained in organic forms. Decomposition of soil organic matter by microbes transforms organic forms of N (R-NH2) into mineral forms (ammonium [NH4] and nitrate [NO3]) that are available to plants but also are subject to loss through leaching and runoff as water moves through and over the soil, and through denitrification as microbes transform nitrate to nitrogen oxide (N2O), N2, and other N gases. Mineral forms of N in the soil also can
be consumed by microbes and immobilized in organic forms. The processes involved in mineralization and immobilization transformations are dependent on temperature and moisture conditions and the relative amounts of carbon, nitrogen, and oxygen present in decomposing materials and the associated soil, all of which can be quite variable in space and over time. Mineralization and immobilization processes, as mentioned previously, also are influenced by farm management decisions.
Losses of N through leaching, runoff, and denitrification are critical components of agroecosystem N dynamics, farm profitability, and environmental quality (EPA, 2011; Robertson and Vitousek, 2009). Nitrogen also can be lost from agroecosystems as gaseous ammonia emitted from fertilizer and manure applied to the soil, or from senescing crops (EPA, 2011; Smil, 1999). Erosion of topsoil and the organic forms of N it contains constitutes another pathway for N loss from agroecosystems (Smil, 1999). In situations where large amounts of crop residue are harvested from fields, soil organic matter stocks may become depleted and the lack of protective soil cover may result in increased amounts of N lost through erosion and runoff (Blanco-Canqui, 2010). Overall, the magnitudes of various N losses from agroecosystems are highly variable in space and time, and they are strongly influenced by weather conditions and management practices.
Human Health and Environmental Concerns
Reactive N released from agroecosystems is responsible for a number of adverse public health and environmental effects. Four of the most salient effects for the United States are noted here.
Drinking water contamination Nitrate coming from farmland is an important contaminant of drinking water in many agricultural regions (EPA, 2011). It constitutes a potential health threat due to its ability to (1) induce methemoglobinemia, a condition in which the oxygen-carrying capacity of blood is inhibited; (2) promote endogenous formation of N-nitroso compounds, which are carcinogens and teratogens; and (3) inhibit iodine uptake, thereby inducing hypertrophic changes in the thyroid (Ward, 2009). These health concerns are not restricted to members of the farm population. Nitrate contamination of surface water is common in the Corn Belt and is a recurrent challenge to cities such as Des Moines, Iowa, which draws drinking water from the Raccoon and Des Moines Rivers, both of which drain intensively farmed areas. After repeatedly violating the U.S. Environmental Protection Agency’s (EPA’s) drinking water standard of 10 mg L−1 for nitrate-nitrogen, and challenged by increasing levels of nitrate in its source water, the Des Moines Water Works constructed the largest ion exchange nitrate removal facility in the world in 1991 (Hatfield et al.,
2009). The need for this facility, which provides service to 500,000 people, has not abated, as record high levels of nitrate were encountered in Des Moines’ drinking water sources in 2013. Nitrate also poses a significant threat to groundwater used for drinking water. A recent report focusing on the Tulare Lake Basin and Salinas Valley of California, which together contain 40 percent of the state’s irrigated cropland and more than 50 percent of its dairy cattle, found that nitrate poses a significant threat to the health of rural communities dependent on well water, with nearly 1 in 10 people in the two regions now at risk (Harter et al., 2012). The report identified agricultural fertilizers and animal wastes as the largest sources of nitrate in groundwater in the areas investigated; it also noted that 40 out of the 51 community public water systems in the study area that had excessive nitrate levels are in “severely disadvantaged communities” with high poverty rates. These populations are especially susceptible to nitrate pollution because they generally cannot afford drinking water treatment or capital-intensive alternative water supplies.
Eutrophication and hypoxia Reactive N in water draining from agricultural regions can be responsible for eutrophication of freshwater bodies and hypoxia in coastal waters (Galloway et al., 2003). High levels of N in water stimulate harmful algal blooms, leading to suppression of desired aquatic vegetation, and when the algae die, their subsequent decomposition by bacteria leads to large reductions in dissolved oxygen concentrations, with concomitant reductions in populations of shellfish, game fish, and commercial fish.
Eutrophication and hypoxia effects are often spatially separated from their causes. For example, an estimated 71 percent of the N entering the northern Gulf of Mexico, the largest hypoxic zone in the United States and the second largest hypoxic zone worldwide, comes from croplands, rangelands, and pastures upstream in the Mississippi River Basin, with 17 percent of the total N load coming from Illinois, 11 percent from Iowa, and 10 percent from Indiana (Alexander et al., 2008). Thus, because of the mobility of reactive N, agricultural practices and land uses in one region can affect water quality, recreational activities, and economic sectors like fisheries hundreds of miles downstream.
Greenhouse gas loading Agricultural practices, principally fertilizer use, are responsible for about 74 percent of U.S. emissions of nitrous oxide (N2O), a greenhouse gas with a global warming potential 300-fold greater than that of carbon dioxide (EPA, 2013). Although the agricultural sector is responsible for only 6.3 percent of total U.S. greenhouse gas emissions (EPA, 2013), it is notable that agricultural emissions can offset efforts to use agricultural systems to mitigate climate change by sequestering carbon
dioxide or providing alternative energy sources (Robertson and Vitousek, 2009). Nitrous oxide emissions from agriculture also are notable as illustrations of how practices taking place locally on farmlands can have global-scale effects.
Ecological and human health effects of ammonia and other NHx-N emissions In 2002, the United States emitted 3.1 Tg of N into the atmosphere as ammonia and other NHx-N compounds, with agricultural practices, principally manure and fertilizer management, estimated to be responsible for 84 percent of that total (EPA, 2011). Most of these emissions are deposited within 1,000 km downwind as ammonia or ammonium in rainwater and aerosols (Robertson and Vitousek, 2009). Ammonia emissions can lead to the formation of fine inorganic particulate matter (PM2.5) as ammonium-sulfate-nitrate salts, which are a factor for premature human mortality (Paulot and Jacob, 2014).
Deposition of reactive N from the atmosphere can acidify soils and waters and alter plant and soil community composition in grasslands and forests, leading to reductions in overall biological diversity and increases in the abundance of certain weedy species (EPA, 2011; Robertson and Vitousek, 2009). Like the movement of reactive N in water from agricultural regions to coastal ecosystems, the aerial movement and deposition of NHx-N compounds illustrates that agriculture’s impact on the environment can extend into other ecosystems that may be located considerable distances from farmlands.
Using models of ammonia sources and transport and PM2.5 formation and deposition, Paulot and Jacob (2014) calculated the quantities of atmospheric ammonia and PM2.5 that are related to U.S. food exports and the associated impacts of these pollutants on human health. They concluded that over the study period of 2000 to 2009, 5,100 people died annually due to these emissions, incurring a cost of $36 billion. This value greatly exceeded the net value of the exported food ($23.5 billion per year). The investigators noted that these human health and economic costs indicated “extensive negative externalities,” and that taking into account other environmental impacts of agriculture, such as eutrophication, loss of biodiversity, and greenhouse gas emissions, would further diminish the value of agricultural production and exports.
Policy and Educational Considerations
Environmental quality and human health concerns related to the use of N for crop production have important policy dimensions. In an analysis of 29 watersheds covering 28 percent of the United States, Broussard et al. (2012) noted that increases in federal farm program payments were signifi-
cantly correlated with greater dominance of cropland by corn and soybean, more expansive fertilizer applications, and higher riverine nitrate concentrations. They suggested that federal farm policies, expressed through farm payments, are a potent policy instrument that affects land-use decisions, cropping patterns, and water quality. Based on focus group interviews with farmers and residents of the Wells Creek and Chippewa River watersheds in Minnesota, Boody et al. (2005) noted that recent federal programs have encouraged the production of a narrow set of commodity crops while discouraging diversified agriculture and conservation efforts that better protect environmental quality. Similarly, Nassauer (2010, p. 190) observed that “for more than 50 years, production subsidies have vastly exceeded conservation spending—by almost ten times today—and this ratio has been clearly understood by farmers making production decisions.” Consequently, fewer opportunities exist for reducing N emissions to air and water from arable croplands through the increased use of conservation buffer strips and grasslands, reconstructed wetlands, and diversified cropping systems that include hay and other non-commodity crops.
Federal energy policies that have promoted ethanol production from corn grain have been linked to reactive N emissions. Donner and Kucharik (2008) used process-based models to simulate hydrological and nutrient fluxes in the Mississippi River Basin under different corn production scenarios. They found that the increase in corn cultivation required to meet the federal goal of producing 15 to 36 billion gallons of renewable fuels by the year 2022 would increase average annual discharge of dissolved inorganic N into the Gulf of Mexico by 10 to 34 percent.
A recent report from the EPA-specified federal policy options (EPA, 2011) for reducing emissions of reactive N from U.S. agroecosystems to better protect environmental quality and human health. Existing government policies and programs for reactive-N reduction included the Conservation Reserve Program, the Wetland Reserve Program, and the Environmental Quality Incentives Program. Market-based instruments for pollution control identified by the report included tradable water quality credits, auction-based contracting, individual transferable quotas, risk indemnification to protect farmers adopting new practices from uncertainty, and conservation easements. Biophysical and technical approaches identified by the report included decreasing the amount of N fertilizer needed through changes in human diet (principally a reduction in animal protein consumption); removing croplands susceptible to reactive N loss from crop production; increasing fertilizer use efficiency through changes in crop management practices and improved fertilizer technology; engineering and restoring wetlands to decrease nitrate loading of aquatic systems; and developing new technologies to minimize ammonia emissions from manure.
At the other end of the spectrum from federal policies that influence
N use and reactive N emissions are local and statewide efforts to change practices through education. Successful implementation of management practices, such as improved irrigation strategies, diversified crop rotations, conservation buffer strips, and improved crop N use efficiency, requires a focus on policy incentives and research as well as substantial investments in education for end-users. This can be done through established networks of science and communication and by engaging a broad spectrum of the general public and members of the agricultural community through the development of local and regional watershed groups (Dzurella et al., 2012; Morton and Brown, 2011; MPCA, 2014).
Identify the Scenarios
To understand the effects of a new intervention, policy, or technology, an assessment compares the performance of the current system as described in the scope—the baseline—with one or more alternative scenarios that reflect the proposed change. For this example, an assessment team would identify the alternative systems for N management. We illustrate this step through a literature review about prior comparisons under different circumstances.
The conceptual model shown in Figure 7-A-3 shows stocks and flows of N for a crop-soil system and illustrates that improving crop N uptake, promoting recycling within the system, and regulating flows out of the system affect N use efficiency by crops and N emissions to water and air.
Use of this conceptual model fosters comparisons of alternative configurations of farming systems and promotes the use of multiple criteria when evaluating the performance of different systems. For example, in a field experiment conducted in Michigan, McSwiney and Robertson (2005) found that corn yield increased with additions of mineral N fertilizer up to a rate of about 100 kg N ha−1 (hectares−1), but that additional fertilizer failed to increase yield. In contrast, emissions of the greenhouse gas N2O from the soil were low at fertilizer rates up to 100 kg N ha−1, but they more than doubled as fertilizer rates exceeded that threshold. Nonlinear, exponentially increasing rates of nitrogen oxide emissions in response to increases in N fertilizer rates also were observed by Hoben et al. (2011) on five commercially farmed fields used for corn production in Michigan. At the two N fertilizer rates above those recommended for maximum economic return (135 kg N ha−1), average nitrogen oxide fluxes were 43 and 115 percent higher than were fluxes at the recommended rate. Other studies have found that nitrate leaching increases with increasing rates of N fertilization (Drinkwater and Snapp, 2007). Thus, in terms of the model shown in Figure 7-A-3, carefully managing the rate of fertilizer N addition to meet but not exceed crop demand could optimize the amount of soil
mineral N and crop N uptake, while minimizing N loss to the atmosphere through denitrification and N loss to water through leaching and runoff.
Crops differ in their effects on nitrate emissions to ground and surface waters, due to crop-specific rates of N fertilizer application, biological N fixation, N uptake, and N return in residue (Robertson and Vitousek, 2009). In the Mississippi River Basin, nitrate-N concentrations in streams and rivers are directly proportional to the amount of land within watersheds planted with corn and soybean (Broussard and Turner, 2009; Schilling and Libra, 2000), largely because those crops are small in size or not actively growing during periods of the year when substantial quantities of dissolved N are moving from fields in runoff and leachate (Hatfield et al., 2009; Randall et al., 1997). Consequently, as noted previously, nitrate contamination of surface and groundwaters within the Corn Belt that supply drinking water is a major concern, as is the flow of nitrate-laden river water into the Gulf of Mexico, where it contributes to hypoxia.
In contrast to corn and soybeans, which are relatively ineffective at preventing N emissions to water, small grains, such as oat, and perennial grasses and legumes used for forage production are more effective in preventing N from entering drainage and surface waters, due to their greater use of water-carrying dissolved N during spring and autumn and, in the case of forage crops, a longer period of growth and N uptake throughout the year (Hatfield et al., 2009; Randall et al., 1997). Cover crops, which take up N during periods of the year when cash and feed crops like corn and soybean are not present in fields, can strongly reduce N losses to water by reducing soil mineral N stocks (Kaspar et al., 2007; Syswerda et al., 2012; Tonitto et al., 2006). Diversified crop rotation systems that use small grain, forage, and cover crops in addition to corn and soybeans can reduce N emissions to water by increasing inputs of N through biological fixation, increasing the size of soil organic N stocks, reducing requirements for mineral fertilizer, and maximizing crop uptake of soil mineral N (Blesh and Drinkwater, 2013; Drinkwater et al., 1998; Gardner and Drinkwater, 2009; Oquist et al., 2007).
Unlike the Corn Belt, where most crop production occurs under rain-fed conditions, most production in California is irrigated, especially in intensively cropped regions. Because the movement of reactive N is related to soil moisture conditions and water fluxes, water management and N management are linked closely. Dzurella et al. (2012) recommended that reductions of nitrate in California groundwater aquifers should be pursued by optimizing application rates and timing of water, fertilizer, and manure applications to better match crop need. In addition, they recommended that adjustments and improvements be made to crop rotation strategies and storage and handling of fertilizers and manure, and that manure N be accounted for by reducing mineral fertilizer N applications accordingly.
Alternative configurations of cropping systems and N sources may be particularly useful in addressing emissions of reactive N from California cropping systems. For example, Wyland et al. (1996) investigated the effects of winter cover crops (phacelia and rye) in broccoli-based cropping systems in the Salinas Valley and found that the cover crops reduced nitrate leaching by 65 to 70 percent relative to a winter fallow treatment. The effect was attributed to the cover crops’ ability to capture N and water that would otherwise have been lost from the soil profile. In a long-term field experiment conducted in California’s Sacramento Valley, soil N storage was greater and N losses were smaller for cropping systems that relied largely or exclusively on N inputs from leguminous cover crops and manure and that minimized or eliminated the use of mineral N fertilizer (Poudel et al., 2001). Using the same experiment site, Kramer et al. (2002) measured N uptake by corn from mineral fertilizer, residues of a vetch cover crop, and poultry manure and found that as compared to relying exclusively on mineral fertilizer, combinations of organic sources of N with low rates of fertilizer were sufficient to produce high yields while better matching N supply with crop demand in the latter part of the growing season. The investigators concluded that combining organic N sources with mineral fertilizer “holds promise for reducing the use of inorganic fertilizers and possible N losses from agroecosystems” (Kramer et al., 2002, p. 242).
The fate of N in cropping systems managed with different forms of N inputs and different cropping practices can be depicted in two contrasting conceptual models. Figure 7-A-4 shows possible N dynamics in a system that mostly relies on mineral fertilizers and that does not use cover crops or perennial crops to increase N uptake and retention. Losses of N to air and water could be substantial in such systems, with concomitant costs to farmers, due to low use efficiency for purchased N fertilizer, and to society, due to degradation of water resources and impairment of human health.
Figure 7-A-5 depicts possible N dynamics in an alternative cropping system that relies less on mineral N fertilizer and places greater emphasis on biological N fixation, manure and organic matter amendments, cover crops, and perennial crops. Losses of N to air and water in this alternative system could be much smaller than in the fertilizer-dependent system, with concomitant reductions in environmental and health costs to society. Farmers, however, might incur greater costs through the use of manure and other soil amendments rather than mineral fertilizer and through the production of non-cash crops.
With adequate confidence in the accuracy and precision of plot- and field-level measurements, system-level comparisons of N dynamics can be extended to landscape and watershed scales using biogeochemical process models that are spatially referenced for site-specific soil, climate, and management conditions. For example, De Gryze et al. (2009) employed data
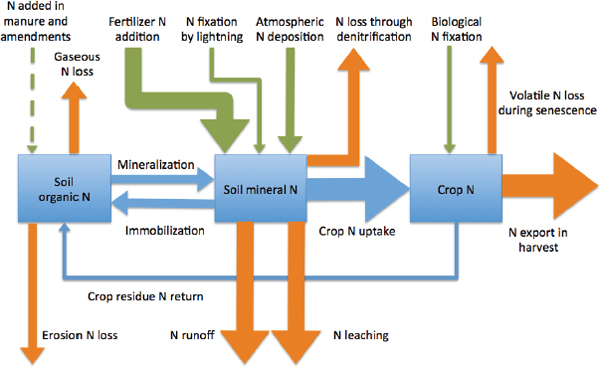
FIGURE 7-A-4 Hypothetical N stocks and flows for a cropping system using mainly mineral N inputs. Boxes representing N stocks and arrows representing N flows are not drawn to scale.
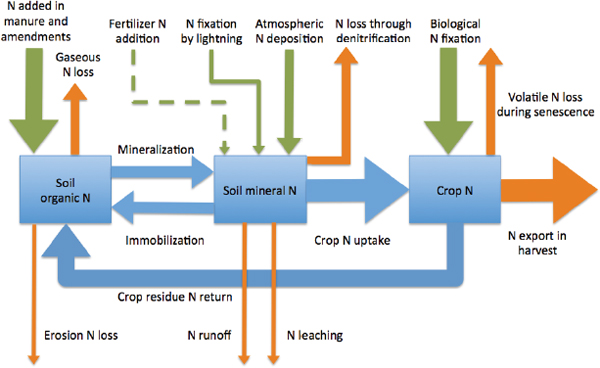
FIGURE 7-A-5 Hypothetical N stocks and flows for a cropping with low reliance on mineral N fertilizer, but with emphasis on biological N fixation, manure and organic matter amendments, cover crops, and perennial crops. Boxes representing N stocks and arrows representing N flows are not drawn to scale.
from four long-term field experiment sites and the CENTURY/DAYCENT model to examine nitrous oxide emissions from regions of the Sacramento and San Joaquin Valleys used for the production of the seven most abundant crops in both valleys: rice, alfalfa, cotton, tomatoes, winter wheat, corn, and safflower. When manure was used instead of mineral fertilizer or when 25 percent less mineral fertilizer was used, predicted nitrous oxide emissions were reduced by 0.5 to 1.2 Mg CO2 equivalent ha−1 yr−1. The investigators noted that manure releases N to the soil system slowly, resulting in better synchrony between nutrient supply and crop demand, and that reducing use of inorganic fertilizer decreases the amount of mineral N in the soil available for loss through denitrification. Though the modeling results indicated greater reliance on manure, and fertilizer rate adjustments would result in only modest reductions in nitrous oxide emissions, the modeling process illustrated how region-wide impacts of alternative crop and soil management systems on reactive N emissions might be assessed.
Biophysical process models that describe N dynamics can be extended from the field level to landscape and watershed levels for assessment of the water quality impacts of alternative patterns of land use. For example, Boody et al. (2005) used the ADAPT (Agricultural Drainage and Pesticide Transport) model to evaluate N emissions to streams under four different scenarios for land use in two agriculturally dominated watersheds in Minnesota: Wells Creek (16,264 ha), and Chippewa River (17,994 ha). The scenarios included (1) a continuation of current patterns of land use, mostly corn, soybean, and sugar beet production; (2) the use of “Best Management Practices,” including conservation tillage practices, 30-meter wide buffer strips along stream banks, and application of fertilizer rates to match but not exceed crop demands; (3) increased landscape and cropping system diversity through wetland restoration, greater use of long rotations that included small grains and perennial forage crops with corn, soybean, and sugar beet, and increased use of pastures; and (4) an extension of the third scenario that further increased vegetative cover by shifting more arable cropland to grasslands, increasing the width of riparian buffers to 90 meters, and planting cover crops wherever row crops were produced. In addition to changes in water quality, changes in farm production inputs and net farm income were assessed using economic databases.
Under scenarios 3 and 4 in both watersheds, N fertilizer use fell 62 to 90 percent, N exported from land to streams decreased 51 to 74 percent, and government payments for commodity price support declined 44 to 70 percent, while net farm income rose 12 to 105 percent over the current baseline. Boody et al. (2005) concluded that environmental and economic benefits could be attained through changes in agricultural land management without increasing public costs. Landscape and cropping system diversification also resulted in large predicted reductions in stream N concentrations
in simulations conducted for two watersheds in Iowa by Santelmann et al. (2004) using the SWAT (Soil and Water Assessment Tool) model.
Conduct the Analysis
In this step of an assessment, data, metrics, and analysis tools are used to examine the likely health, environmental, social, and economic effects associated with the alternative scenarios. For this example, we consider the data, metrics, and tools that would be used to compare the N management scenarios described above.
Empirical datasets with which to account for the full complement of N dynamics in different agricultural production systems are difficult to obtain (Vitousek et al., 2009). Although it can be relatively easy to monitor N inputs in the form of mineral fertilizers and manure, and N outputs in the form of harvested crop materials and marketed animal products, accurate measurements of biological N fixation, gaseous losses through denitrification, aqueous losses due to leaching, and N transformations between organic and mineral forms can be technically challenging, subject to considerable temporal and spatial variation, and expensive (Galloway et al., 2004). Consequently, despite the centrality of N dynamics for agricultural production, most experimental and observational studies have focused on a limited subset of N fluxes and transformations.
Building complete N budgets for contrasting management systems will require longer-term commitments and greater investment than are typical for the majority of more narrowly focused agricultural research projects. The Long-Term Ecological Research site operated by Michigan State University (Robertson et al., 2014; Syswerda and Robertson, 2014; Syswerda et al., 2012) is one of the few large-scale, long-term, multidisciplinary cropping system experiments conducted within the United States in which a large number of N stocks and flows have been studied with sufficient detail to provide insight into system-level characteristics. If N dynamics in all of the major agricultural production systems of the United States are to be understood, long-term investment in a distributed network of agroecosystem research sites is critically important, due to the need to (1) observe soil conditions for multiple years to detect slow impacts of farm management practices, (2) accommodate interannual variability in weather and pest conditions, and (3) effectively address the wide range of geographic conditions in which farming takes place. As noted by Robertson et al. (2008), this approach is largely lacking from the U.S. agricultural research portfolio.
The earlier scoping and scenario sections should make it clear that additional measurements and assessments, beyond yields, N fluxes, and N use efficiency, are necessary to understand the full impacts of N use and management in agroecosystems. These include quantification of the off-
site health, environmental, and economic effects and costs of N emissions. Given the long distances that reactive forms of N can move downstream and downwind and the long lag times that may occur before effects are observed (Galloway et al., 2003), such measurements and assessments must be conducted at spatial scales much greater than individual fields, must be conducted for multiple years, and must include a much wider spectrum of plants, animals, microbes, and human populations than those encountered on farms. Socioeconomic investigations also must be integrated with biophysical research to (1) understand the signals and types of information that most affect farmers’ decisions concerning N use and management; (2) determine the economic impacts of using alternative N management and cropping systems at farm, regional, and national scales; and (3) identify changes in policy that might affect the N-related impacts of agroecosystem management (Robertson and Vitousek, 2009; Robertson et al., 2008).
The use and management of N in agroecosystems is not restricted to the United States alone; it is an issue of worldwide concern (UNEP, 2007; Vitousek et al., 2009). Thus, improvements in analytical methods and approaches may be gained from investigations conducted internationally.
REFERENCES
Alexander, R. B., R. A. Smith, G. E. Schwarz, E. W. Boyer, J. V. Nolan, and J. W. Brakebill. 2008. Differences in phosphorus and nitrogen delivery to the Gulf of Mexico from the Mississippi River Basin. Environmental Science and Technology 42:822-830.
Blanco-Canqui, H. 2010. Energy crops and their implications on soil and environment. Agronomy Journal 102:403-419.
Blesh, J., and L. E. Drinkwater. 2013. The impact of nitrogen source and crop rotation on nitrogen mass balances in the Mississippi River Basin. Ecological Applications 23:1017-1035.
Boody, G., B. Vondracek, D. A. Andow, M. Krinke, J. Westra, J. Zimmerman, and P. Welle. 2005. Multifunctional agriculture in the United States. Bioscience 55:27-38.
Broussard, W., and R. E. Turner. 2009. A century of changing land-use and water-quality relationships in the continental U.S. Frontiers in Ecology and the Environment 7:302-307.
Broussard, W. P., R. E. Turner, and J. V. Westra. 2012. Do federal farm policies influence surface water quality? Agriculture, Ecosystems and Environment 158:103-109.
De Gryze, S., M. V. Albarracin, R. Catala-Luque, R. E. Howitt, and J. Six. 2009. Modeling shows that alternative soil management can decrease greenhouse gases. California Agriculture 63(2):84-90.
Dinnes, D. L., D. L. Karlen, D. B. Jaynes, T. C. Kaspar, J. L. Hatfield, T. S. Colvin, and C. A. Cambardella. 2002. Nitrogen management strategies to reduce nitrate leaching in tile-drained Midwestern soils. Agronomy Journal 94:153-171.
Donner, S. D., and C. J. Kucharik. 2008. Corn-based ethanol production compromises goal of reducing nitrogen export by the Mississippi River. Proceedings of the National Academy of Sciences of the United States of America 105:4513-4518.
Drinkwater, L. E., and S. S. Snapp. 2007. Nutrients in agroecosystems: Rethinking the management paradigm. Advances in Agronomy 92:63-186.
Drinkwater, L. E., P. Wagoner, and M. Sarrantonio. 1998. Legume-based cropping systems have reduced carbon and nitrogen losses. Nature 396:262-265.
Dzurella, K. N., J. Medellin-Azuara, V. B. Jensen, A. M. King, N. De La Mora, A. FryjoffHung, T. S. Rosenstock, T. Harter, R. Howitt, A. D. Hollander, J. Darby, K. Jessoe, J. R. Lund, and G. S. Pettygrove. 2012. Nitrogen source reduction to protect groundwater quality. Technical Report 3. In Addressing nitrate in California’s drinking water with a focus on Tulare Lake Basin and Salinas Valley groundwater. Center for Watershed Sciences, University of California, Davis. http://groundwaternitrate.ucdavis.edu (accessed December 23, 2014).
EPA (U.S. Environmental Protection Agency). 2011. Reactive nitrogen in the United States—an analysis of inputs, flows, consequences, and management options. EPA-SAB-11-013. Washington, DC: Environmental Protection Agency. http://yosemite.epa.gov/sab/sabproduct.nsf/WebBOARD/INCSupplemental?OpenDocument (accessed December 23, 2014).
EPA. 2013. Inventory of U.S. greenhouse gas emissions and sinks: 1990-2011. EPA 430-R-13-001, Washington, DC: EPA. http://www.epa.gov/climatechange/Downloads/ghgemissions/US-GHG-Inventory-2013-Main-Text.pdf (accessed December 23, 2014).
ERS (Economic Research Service). 2008. Agricultural projections to 2017. Washington, DC: U.S. Department of Agriculture, Economic Research Service. http://www.ers.usda.gov/publications/oce-usda-agricultural-projections/oce-2008-1.aspx (accessed December 23, 2014).
Foley, J. A., N. Ramankutty, K. A. Brauman, E. S. Cassidy, J. S. Gerber, M. Johnston, N. D. Mueller, C. O’Connell, D. K. Ray, P. C. West, C. Balzer, E. M. Bennett, S. R. Carpenter, J. Hill, C. Monfreda, S. Polasky, J. Rockstrom, J. Sheehan, S. Siebert, D. Tilman, and D. P. M. Zaks. 2011. Solutions for a cultivated planet. Nature 478(7369):337-342.
Galloway, J. N., J. D. Aber, J. W. Erisman, S. P. Seitzinger, R. W. Howarth, E. B. Cowling, and B. J. Cosby. 2003. The nitrogen cascade. BioScience 53:341-356.
Galloway, J. N., F. J. Dentener, D. G. Capone, E. W. Boyer, R. W. Howarth, S. P. Seitzinger, G. P. Asner, C. C. Cleveland, P. A. Green, E. A. Holland, D. M. Karl, A. F. Michaels, J. H. Porter, A. R. Townsend, and C. J. Vorosmarty. 2004. Nitrogen cycles: Past, present, and future. Biogeochemistry 70:153-226.
Gardner, J. B., and L. E. Drinkwater. 2009. The fate of nitrogen in grain cropping systems: A meta-analysis of N-15 field experiments. Ecological Applications 19:2167-2184.
Harter, T., J. R. Lund, J. Darby, G. E. Fogg, R. Howitt, K. Jessoe, G. S. Pettygrove, J. F. Quinn, J. H. Viers, D. B. Boyle, H. E. Canada, N. De La Mora, K. N. Dzurella, A. FryjoffHung, A. D. Hollander, K. L. Honeycutt, M. W. Jenkins, V. B. Jensen, A. M. King, G. Kourakos, D. Liptzin, E. M. Lopez, M. M. Mayzelle, A. McNally, J. Medellin-Azuara, and T. S. Rosenstock. 2012. Addressing nitrate in California’s drinking water with a focus on Tulare Lake Basin and Salinas Valley groundwater. Center for Watershed Sciences, University of California, Davis. http://groundwaternitrate.ucdavis.edu (accessed December 23, 2014).
Hatfield, J. L., L. D. McMullen, and C. S. Jones. 2009. Nitrate–nitrogen patterns in the Raccoon River Basin related to agricultural practices. Journal of Soil and Water Conservation 64:190-199.
Hoben, J. P., R. J. Gehl, N. Millar, P. R. Grace, and G. P. Robertson. 2011. Nonlinear nitrous oxide (N2O) response to nitrogen fertilizer in on-farm corn crops of the US Midwest. Global Change Biology 17:1140-1152.
Jackson, L. L., D. R. Keeney, and E. M. Gilbert. 2000. Swine manure management plans in north-central Iowa: Nutrient loading and policy implications. Journal of Soil and Water Conservation 55:205-212.
Kaspar, T. C., D. B. Jaynes, T. B. Parkin, and T. B. Moorman. 2007. Rye cover crop and gamagrass strip effects on NO3 concentration and load in tile drainage. Journal of Environmental Quality 36:1503-1511.
Kramer, A. W., T. A. Doane, W. R. Horwath, and C. van Kessel. 2002. Combining fertilizer and organic inputs to synchronize N supply in alternative cropping systems in California. Agriculture, Ecosystems and Environment 91:233-243.
MacDonald, J., M. Ribaudo, M. Livingston, J. Beckman, and W. Y. Huang. 2009. Manure use for fertilizer and for energy. Administrative Publication No. AP-037. Washington, DC: U.S. Department of Agriculture, Economic Research Service.
McSwiney, C. P., and G. P. Robertson. 2005. Nonlinear response of N2O flux to incremental fertilizer addition in a continuous maize (Zea mays L.) cropping system. Global Change Biology 11:1712-1719.
Morton, L. W., and S. S. Brown (eds.). 2011. Pathways for getting to better water quality: The citizen effect. New York: Springer.
MPCA (Minnesota Pollution Control Agency). 2014. The Minnesota nutrient reduction strategy. St. Paul, MN. http://www.pca.state.mn.us/index.php/view-document.html?gid=20213 (accessed December 23, 2014).
Nassauer, J. I. 2010. Rural landscape change as a product of U.S. federal policy. In Globalisation and agricultural landscapes: Change patterns and policy trends in developed countries, edited by J. Primdahl and S. Swaffield. Cambridge, UK: Cambridge University Press. Pp. 185-200.
Oquist, K. A., J. S. Strock, and D. J. Mulla. 2007. Influence of alternative and conventional farming practices on subsurface drainage and water quality. Journal of Environmental Quality 36:1194-1204.
Paulot, F., and D. J. Jacob. 2014. Hidden cost of U.S. agricultural exports: Particulate matter from ammonia emissions. Environmental Science and Technology 48:903-908.
Poudel, D. D., W. R. Horwath, J. P. Mitchell, and S. R. Temple. 2001. Impacts of cropping systems on soil nitrogen storage and loss. Agricultural Systems 68:253-268.
Randall, G. W., D. R. Huggins, M. P. Russelle, D. J. Fuchs, W. W. Nelson, and J. L. Anderson. 1997. Nitrate losses through subsurface tile drainage in conservation reserve program, alfalfa, and row crop systems. Journal of Environmental Quality 26:1240-1247.
Ribaudo, M., J. Delgado, L. Hansen, M. Livingston, R. Mosheim, and J. Williamson. 2011. Nitrogen in agricultural systems—implications for conservation policy. Economic Research Service Report No. 127. Washington, DC: U.S. Department of Agriculture, Economic Research Service.
Robertson, G. P., and P. M. Vitousek. 2009. Nitrogen in agriculture: Balancing the cost of an essential resource. Annual Review of Environment and Resources 34:97-125.
Robertson, G. P., V. G. Allen, G. Boody, E. R. Boose, N. G. Creamer, L. E. Drinkwater, J. R. Gosz, L. Lynch, J. L. Havlin, L. E. Jackson, S. T. A. Pickett, L. Pitelka, A. Randall, A. S. Reed, T. R. Seastedt, R. B. Waide, and D. H. Wall. 2008. Long-term agricultural research: A research, education, and extension imperative. BioScience 58:640-645.
Robertson, G. P., K. L. Gross, S. K. Hamilton, D. A. Landis, T. M. Schmidt, S. S. Snapp, and S. M. Swinton. 2014. Farming for ecosystem services: An ecological approach to production agriculture. Bioscience 64(5):404-415.
Santelmann, M. V., D. White, K. Freemark, J. I. Nassauer, J. M. Eilers, K. B. Vache, B. J. Danielson, R. C. Corry, M. E. Clark, S. Polasky, R. M. Cruse, J. Sifneos, H. Rustigian, C. Coiner, J. Wu, and D. Debinski. 2004. Assessing alternative futures for agriculture in Iowa, U.S.A. Landscape Ecology 19:357-374.
Schilling, K. E., and R. D. Libra. 2000. The relationship of nitrate concentration in streams to row crop land use in Iowa. Journal of Environmental Quality 29:1846-1851.
Shapouri, H., P. W. Gallagher, W. Nefstead, R. Schwartz, R. Noe, and R. Conway. 2010. 2008 Energy balance for the corn–ethanol industry. Agricultural Economic Report 846. Office of the Chief Economist. Washington, DC: U.S. Department of Agriculture.
Smil, V. 1999. Nitrogen in crop production: An account of global flows. Global Biogeochemical Cycles 13:647-662.
Syswerda, S. P., and G. P. Robertson. 2014. Ecosystem services along a management gradient in Michigan (USA) cropping systems. Agriculture, Ecosystems and Environment 189:28-35.
Syswerda, S. P., B. Basso, S. K. Hamilton, J. B. Tausig, and G. P. Robertson. 2012. Long-term nitrate loss along an agricultural intensity gradient in the Upper Midwest USA. Agriculture, Ecosystems and Environment 149:10-19.
Tonitto, C., M. B. David, and L. E. Drinkwater. 2006. Replacing bare fallows with cover crops in fertilizer-intensive cropping systems: A meta-analysis of crop yield and N dynamics. Agriculture, Ecosystems and Environment 112:58-72.
UNEP (United Nations Environment Programme). 2007. Reactive nitrogen in the environment—too much or too little of a good thing. Paris, France: UNEP. http://www.whrc.org/resources/publications/pdf/UNEPetal.2007.pdf (accessed December 23, 2014).
Vitousek, P., R. Naylor, T. Crews, M. B. David, L. E. Drinkwater, E. Holland, P. J. Johnes, J. Katzenberger, L. A. Martinelli, P. A. Matson, G. Nziguheba, D. Ojima, C. A. Palm, G. P. Robertson, P. A. Sanchez, A. R. Townsend, and F. S. Zhang. 2009. Nutrient imbalances in agricultural development. Science 324:1519-1520.
Ward, M. H. 2009. Too much of a good thing? Nitrate from nitrogen fertilizers and cancer. Reviews on Environmental Health 24:357-363.
Wyland, L. J., L. E. Jackson, W. E. Chaney, K. Klonsky, S. T. Koike, and B. Kemple. 1996. Winter cover crops in a vegetable cropping system: Impacts on nitrate leaching, soil water, crop yield, pests and management costs. Agriculture, Ecosystems and Environment 59:1-17.


