
Overview of the U.S. Food System
To develop a framework for assessing the effects of a food system, it is essential to define the internal components and boundaries of the system, as well as its linkages to an “external” world. Previous scholars have operationalized a definition of the U.S. food system in many ways (Kinsey, 2001, 2013; Oskam et al., 2010; Senauer and Venturini, 2005). Nearly all contain some notion of a “food supply chain” through which raw materials and inputs are turned into edible food products that are consumed by end-users. Other definitions include significant attention to the biophysical and social/institutional environments within which the supply chain operates. The committee has used this more comprehensive approach in developing its framework. But today’s food system has been shaped historically by different internal and external drivers (e.g., policy, markets, environmental change) that have evolved with time as well. To view the food system in this historical context, the chapter describes the current system followed by a brief history of its evolution as it has been shaped by those drivers. Because the focus of this report is to develop a framework and not to represent a historical account of events, the committee treats the history and evolution of the food system succinctly, avoiding extensive descriptions of events or identification of all of the drivers and their interactions. Furthermore, to assess the effects of the food system, it is necessary to have a good understanding of its drivers (see Chapter 7). Because the food system is dynamic and the drivers will likely be different in the future, the intent of this chapter is simply to expose the readers (and future assessors of the food system) to ideas for potential drivers. Some of
the drivers, however, are elaborated further in other chapters to exemplify the complexities of the food system.
DEFINING AND MAPPING THE CURRENT U.S. FOOD SYSTEM
Food Supply Chain
In a simple subsistence agricultural society, the number of actors, inputs, flows, processes, and outputs in a food supply chain might be relatively few because most producers and consumers of food are the same. In the modern U.S. food system, however, the food supply chain is extremely complex, and the delivery of a single type of food to a consumer involves many actors. Here, we describe a system that has experienced significant changes over the past 50 years, with multiple positive and negative effects on health, the environment, society, and the economy.
Food Supply Chain Components
Figure 2-1 illustrates the core components of the modern U.S. food supply chain.1 Primary production of food commodities usually originates in the farm production sector, in which farmers, fishers, and ranchers combine their land, water, and labor resources with capital, machinery, and manufactured inputs from an input supply sector to produce raw agricultural commodities (crops and livestock).
Although food sold directly from farmers to consumers is a small but growing segment of the market, the overwhelming bulk of food is handled by several other sectors before being consumed. Initially, many commodities are sold by farmers to first line handlers or primary processors who aggregate, store, and provide initial processing of commodities before shipping them to wholesalers or the processing and manufacturing sectors. First line handlers include both for-profit commodity trading companies and farmer cooperatives that aggregate the output of individual farms to gain economies of scale and market access to the rest of the food supply chain. First line handlers also include companies that wash, wax, wrap, and pack fruits and vegetables, as well as flour millers, oilseed processors, and other firms that prepare raw materials for use in the processing and manufacturing of finished food products. By-products from this sector often are fed to livestock or used in industrial processes. The food processing and manufacturing sector includes meat packers, bakeries, and consumer product
_____________
1 A more detailed description of the key actors within each subsector is provided in Chapter 5.
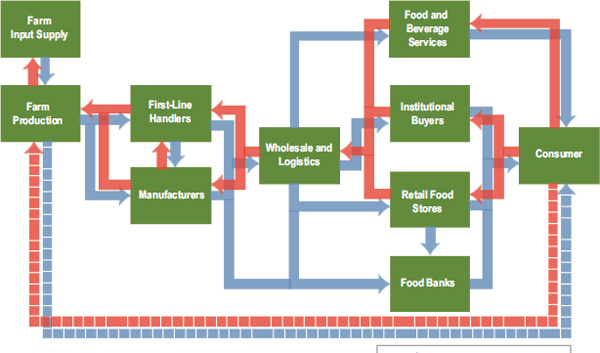
FIGURE 2-1 Conceptual model of a food supply chain. Elements or actors in this supply chain in one area (e.g., region or country) also have interactions (e.g., international trade) with actors in other areas.
goods companies that turn raw materials into higher-value packaged and processed food products.
The food products provided by first line handlers and the processing and manufacturing sector are often passed along to a wholesale and logistics sector. The wholesale food industry consists of companies that purchase and store food products in a network of warehouse facilities and then sell and distribute these products to retail outlets using an extensive transportation infrastructure. A logistics firm refers to a company that does not actually assume ownership of the food products but is paid to provide the service of logistical distribution and inventory coordination.
Ultimately, most food products are passed along to the retail food and food service sectors, where most consumers in the United States purchase their food. The retail food sector includes grocery stores, convenience stores, vending machines, and other retail outlets where individual consumers buy food products for home preparation and consumption. The food service sector includes restaurants, fast-food outlets, eating and drinking establishments, and institutional cafeterias where individuals purchase both
food and the service of having that food prepared and served. This sector represents a growing percentage of the retail food supply.
In most graphic depictions of the food supply chain, consumers represent the final actors. Consumers are individuals who purchase (and store) food to be prepared or eaten at home or elsewhere, or who eat in a food service establishment. Some consumers receive food assistance through governmental programs such as the Supplemental Nutrition Assistance Program (SNAP) and the Special Supplemental Nutrition Program for Women, Infants, and Children (WIC).
Others may receive food through school feeding programs or through private food banks and shelves.
Supply Chain Material Flows
Figure 2-1 also highlights the flows of food, services, and information about food (orange arrows), which begin at the input and farm production sector and extend along the food supply chain until they reach the consumer. This information includes grades, brands, nutritional labels, and advertising. At the same time, the figure illustrates the flows of information about consumer preferences (blue arrows) expressed in terms of market demand (purchases) or pressure on policy makers that move back up the chain and influence the types of foods that are grown, processed, distributed, and sold.
To put the material flows in perspective, the approximate volumes of different types of food that flow through the U.S. food system are highlighted in Figure 2-2. All quantities are converted to billions of pounds and are based on 2009 numbers from the U.S. Department of Agriculture (USDA). The first observation is that about one-third of the 1,260 billion pounds (b. lbs) of all field crop production in the United States is used directly for animal feed. Livestock are also fed a considerable amount of forages (from harvested hay, pastures, and rangelands) that is not included in the figure. As a rough approximation, U.S. producers harvested 130-155 million tons of hay and forage for livestock feed in 2007 and 2012 (USDA, 2009, 2014). Statistics about the total volume of forages consumed by livestock grazing on pasture and rangeland are not systematically gathered by USDA, but estimates of average intake for grazing livestock suggest an equal or larger share of total beef, dairy, and sheep livestock forage intake (USDA, 2003). Another 18 percent of field crops (230 b. lbs) are exported as bulk commodities. This export market has been a source of economic growth and stability for producers. Because the United States imports only 67 b. lbs of food products (both crops and livestock), the U.S. food system has contributed to moving the overall U.S. balance of trade toward the positive side.
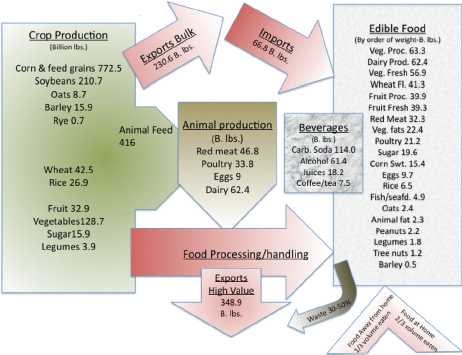
FIGURE 2-2 Flow of food in the U.S. food system.
NOTE: Approximations based on 2009 data from http://www.ers.usda.gov/dataproducts.aspx (accessed April 2, 2015).
SOURCE: Adapted from Kinsey, 2013, p. 22. Reprinted with permission from Springer.
Most of the field crop production in the United States that is not exported or fed to livestock (roughly half the total) goes through some type of food processing and manufacturing before being consumed by people. Although many fruits and vegetables are consumed in raw form, most are still subjected to washing, sorting, waxing, storing, and transportation through the commercial supply chain.
Some representations of the food supply chain that are based on “full life cycle accounting” approaches also include the actors and subsectors that deal with food loss, waste, and recovery. Food loss and waste occur all along the food supply chain, from farm to fork. Examples of loss2 include farmers finding it economically unfeasible to send all of their product to market; food producers deciding not to use products that fail to meet qual-
_____________
2 Loss is the edible, post-harvest food available for human consumption but not consumed for any reason.
ity standards; quality of product not meeting standards at retail; households discarding food that is out of date or spoiled; and consumers not always saving leftover food for future consumption. The waste stream also includes products that result from food consumption.
The roughly 1 trillion lbs of crop products (1,260 b. lbs minus 230 b. lbs of exports) are converted into roughly 664 billion pounds of beverages and edible food. This implies a one-third loss in weight between production and retail. Some of this weight loss is due to field trimming and storing, but much of the volume is recycled as by-products used in animal husbandry or industrial applications. Other weight losses come in processing and manufacturing, as raw products are trimmed of fat and bone, peeled, cooked, dried, and stored. Spoilage occurs, especially in fresh product.
Retail and household losses of edible food are estimated to be 31 percent of the pounds of food available for consumption and 33 percent of the calories in food available for consumption (Buzby et al., 2013, 2014). In 2010, this aggregate loss/waste equaled $161.6 billion (Buzby et al., 2014),
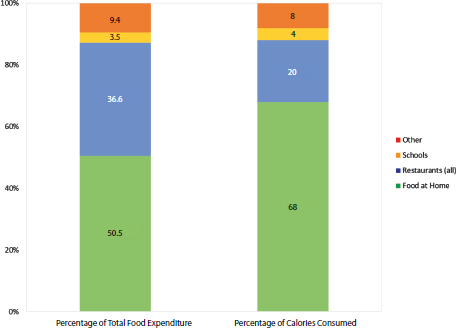
FIGURE 2-3 Percentage of calories and food expenditures for food consumed at home and away from home.
SOURCES: ERS, 2013a; Lin and Guthrie, 2012.
which is about 11 percent of the total value of food and beverage sales in 2013 dollars ($1,624 billion) (Food Institute, 2014).
The 664 billion pounds of beverages and edible food available to consumers can be further subdivided to illustrate the relative importance of different retail outlets. Figure 2-3 uses data from the 2005-2008 National Health and Nutrition Examination Survey (NHANES) and 2012 data from the USDA Economic Research Service (ERS) to show that about two-thirds of the volume of the available edible foods and beverages and about half of the dollars spent on food were consumed at home, with the remainder consumed away from home (Lin and Guthrie, 2012).
Economic Importance of U.S. Food Chain Components
The percentage of income spent on food is approximately 10 percent (ERS, 2013a), although it varies somewhat depending on household income (see Chapter 5). Overall, however, the food system represents one of the most significant components of the U.S. economy. It affects the social and economic well-being of nearly all Americans and plays a significant role in the well-being of the global community. The USDA/ERS estimates that agriculture and food contributed nearly $776 billion to the U.S. gross domestic product (GDP) in 2012 (nearly 5 percent of the total) (ERS, 2014a).
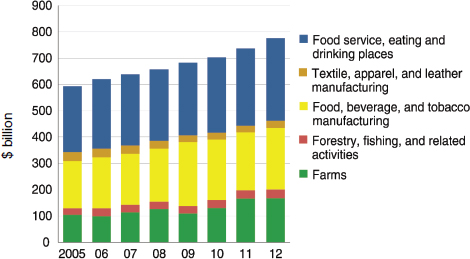
FIGURE 2-4 Estimated value added to GDP by sectors of U.S. food supply chain, 2005-2012.
NOTE: GDP = gross domestic product.
SOURCE: ERS, 2014a.
Although production agriculture generates slightly less than 1 percent of GDP, the food processing and manufacturing as well as the food service industries (including retail stores) each account for an additional 2 percent of U.S. economic output (see Figure 2-4). The U.S. food and fiber system accounted for 18 percent of employment (King et al., 2012), 4 percent of imported goods, and 11 percent of exports in 2011 (ERS, 2014c).
The relative economic contribution of each various step of the U.S. food supply chain has changed significantly over the past 100 years. Generally speaking, the economic importance of the farm production subsector has steadily diminished relative to the shares of the other components of the food supply chain. This reflects the increasing role of processing, distribution, and marketing activities in transforming raw agricultural commodities into food products and services and transferring them to consumers in an increasingly national and global marketplace. USDA regularly estimates what the typical consumer’s food dollar is used to pay for, according to three perspectives (Canning, 2011). Figure 2-5 shows how the consumer dollar was divided between the farm and marketing sectors between 1993 and 2012. The marketing share in 2012 illustrates the fact that more than
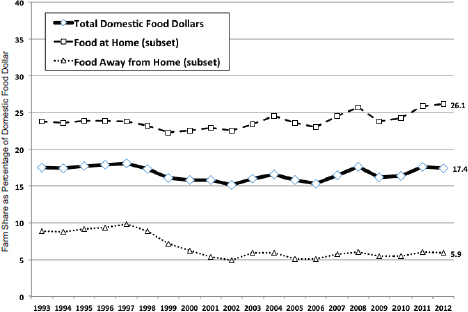
FIGURE 2-5 Farm share of consumer food expenditures, 1993-2012.
SOURCE: ERS, 2014b.
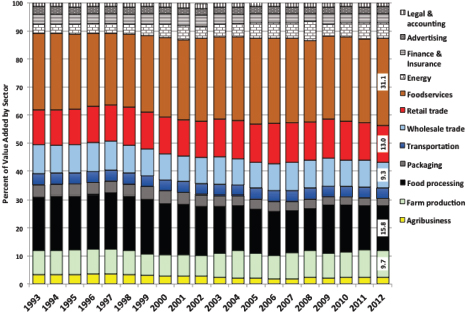
FIGURE 2-6 Distribution of value added across subsectors of food supply chain, 1993-2012.
SOURCE: ERS, 2014b.
80 percent of consumer food dollars pay for services throughout all of the post-harvest segments of the food supply chain; the remaining 17 percent is returned as gross receipts to farm producers. As a point of historic comparison, in 1950 more than 40 percent of consumer food expenditures went to farm producers (Schnepf, 2013). Much of the change in the farm share of food expenditures over time also reflects the growing consumption of food away from home (where, by definition, food service industries capture a larger share of dollars). Still, in recent years, the farm share of home-consumed food expenditures has actually increased to more than 26 percent.
Figure 2-6 looks at the consumer food dollar from a second aspect, namely, the distribution of consumer food dollars based on the value added (or marginal economic contribution) made by each successive step in the food production and distribution process. “Value added” is defined as proceeds from the sale of outputs minus the outlays for goods and services purchased from other establishments. Using value added measures for 2012, farming and agribusiness input firms are responsible for just 12 percent of total economic value created in the food system (9.7 percent and 2.4 percent, respectively). Food processing and packaging together represent roughly 19 percent of value, while the food retail and food services sectors
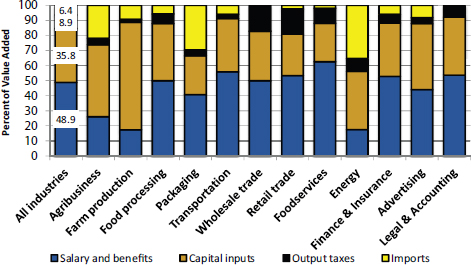
FIGURE 2-7 Distribution of value added by factor of production across subsectors of the U.S. food supply chain, 2012.
SOURCE: ERS, 2014b.
contribute the greatest economic value added, with more than 44 percent of the total (ERS, 2014b).
A third approach to understanding the distribution of the consumer food dollar among different sectors captures this distribution based on an allocation of economic value to the primary factors of production: domestic labor, capital, output taxes, and imports (see Figure 2-7). Approximately one-third of all spending on food covers the capital costs associated with ownership or rental of property (land, machinery, buildings, and other capital inputs) required for food production. Half of all spending goes to compensate workers and managers (through net returns to labor and management, wages, salaries, and benefits). This reflects the fact that transforming raw commodities into safe and edible food products requires a variety of tasks and that consumers now depend on various food industry sectors for much of this labor. Figure 2-7 also shows the distribution of value added to various factors of production for each subsector in the food supply chain. The farm production sector is notable for allocating most of its economic returns to capital inputs, while the food service sector is most focused on labor expenses.
Biophysical and Social/Institutional Contexts
Up to this point, the report has focused on the food supply chain as the core of the U.S. food system. Yet this economic system of producing, processing, distributing, marketing, and consuming food developed and operates within a broader biophysical and social/institutional context. Figure 2-8 provides a visual illustration of the connections among the various components of the U.S. food system and this broader context.
Biophysical Environment
Initially, it should be obvious that the natural resource base (e.g., land, water, nutrients, sunlight, energy, biodiversity, and genetic diversity) provide critical inputs to the farming sector that make possible the productivity and output that enter the rest of the food supply chain. In terms of the sheer size and quality of our farmland, water resources, and the variety of favorable climatic growing zones, the United States is one of the two most fertile areas in the world, according to a 2006 study by the Potsdam Institute for Climate Impact Research (Dutia, 2014). These natural endowments have been augmented by public and private investments in productivity-enhancing research and development: fertilizers and agricultural chemicals,
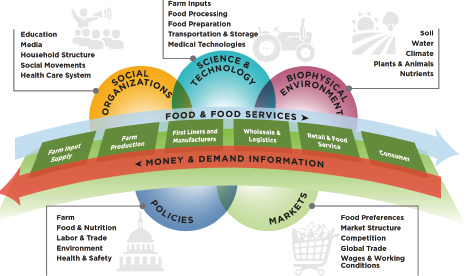
FIGURE 2-8 Links between the food supply chain and the larger biophysical and social/institutional context.
mechanization, efficient plant and animal breeding, information management systems, and constantly evolving handling and processing systems. As a result, the United States has a global comparative advantage in producing many types of agricultural products for both domestic use and export.
Despite these advantages, the development and performance of the food supply chain also can diminish the natural resource base by consuming scarce resources (like energy or nutrients), contaminating resources, or generating outputs (often waste products) that diminish the quality of the biophysical environment. These negative effects can be reduced through public and private investments to mitigate or ameliorate harms, and such investments have taken an increasing share of research and development (R&D) funding in recent decades. Today, soil degradation in North America affects only 25 percent of cropland, compared to roughly two-thirds in Africa and more than 50 percent in Latin America (Wiebe, 2003). Consequently, the United States also has an environmental comparative advantage in producing land-intensive crops and livestock products.
As both a source of critical inputs and a recipient of the waste stream and by-products of farm and food production, the biophysical environment is an integral component of the U.S. food system, and its quality and condition is critical to the long-term sustainability of the food system. Key biophysical elements of the food system are illustrated in Figure 2-8.
Social/Institutional Context
A wide range of social and institutional factors also shapes the ways in which the U.S. food system evolves and operates. These factors can be grouped into four categories: (1) markets, (2) policies, (3) science and technology, and (4) social organizations. Examples of the kinds of forces at work in each category are illustrated in Figure 2-8.
Markets The food system is clearly driven by the structure of markets, changes in supply and demand, and shifts in the economic status of U.S. consumers through time. Shifts in the size, number, and organization of farm and food businesses over the past 50 years also have dramatically reshaped the ways that food products are produced and economic returns are distributed throughout the food supply chain. These changes are tied to shifts in consumer preferences and food consumption patterns. The food system also interacts with other sectors of the U.S. economy through exchanges of inputs or outputs and competition for raw materials and consumer dollars. For example, land as a resource is critically important for producing food, but it also grows fiber, energy crops, and trees, and it serves as a carbon sink. Land also is a critical resource for residences, businesses, roads, recreation, and amenities. At the consumption link, nutritional pat-
terns interact with lifestyles to shape health outcomes. So, while the food system has boundaries, those boundaries are permeable and often overlap with other important human systems. As a result, to understand any food system, it is important to include a careful analysis of how markets shape and are shaped by the behaviors of farmers, processors, handlers, manufacturers, marketers, and consumers.
Policies Many local, state, and federal policies directly affect U.S. farming activities, food processing and marketing practices, nutrition guidance, and food consumption behaviors. These include farm commodity and risk management policies, nutrition programs, food safety regulations, labor regulations, environmental laws, and programs to promote or shape patterns of international trade in farm commodities and food products. The trajectory of change and performance of any food system requires an understanding of the configuration of public and private policies and the politics and resources behind them, and new laws, regulations, and changes in public spending can be major levers used by societal actors to alter food system behaviors.
Science and technology Research and innovations shape the trajectory of technological change in the farm and food industry sectors. In the United States, drivers of technological innovation in food and agriculture include the extensive network of public agricultural research institutions (e.g., land-grant universities, the Agricultural Research Service) as well as the significant R&D programs implemented by private-sector agribusiness and food industry firms. With their mission to integrate research, education, and extension, land-grant universities have been especially critical for agricultural R&D by creating an effective avenue of communicating the most pressing concerns from farmers to researchers, and communicating solutions from researchers to farmers through the extension network. Together, the public- and private-sector institutions determine the information that key food system actors have about the performance of alternative approaches to farming and food provision and affect the relative economic viability of different farm production and food processing systems. At this time, budgets for public research in agriculture and food are declining, in many instances replaced by R&D funding from the private sector for the development of commercial products (Buttel, 2003b; Pardey et al., 2013).
Social organizations Many actors, organizations, and stakeholder groups actively seek to change consumer and producer behaviors and to shape “the structure and behavior of public and private institutions” (NRC, 2010, p. 272). Private firms, government agencies, and nonprofit organizations regularly disseminate information to consumers in the hope of influencing
their food consumption behaviors. Other actors are only indirectly engaged in the food system, but their interests and preferences directly influence food-system dynamics. These include farm and food interest groups, government agencies, community civic organizations, media commentators, and academics. The activities of these groups shape (and respond to) the behaviors of individual actors and firms in the farm’s production and food system, altering markets and, often, public policies.
Boundaries of the U.S. Food System
As described above, the committee’s working definition of the U.S. food system includes both the core components of the food supply chain as well as key features of the broader biophysical and social/institutional context within which food production, processing, distribution, marketing, and consumption activities take place. Any assessment of the effects of alternative configurations of the U.S. food system will require specification of the boundaries of the system of interest (see Chapter 7). Depending on the questions of greatest interest, this approach may require a local, sectoral, national, or global approach.
At one level, it is possible to conceive of the entire U.S. food system as a single national system. This would include all of the segments of the food supply chain that exist within U.S. borders as well as the biophysical resources on which farm and food production depend and the social and institutional components that most directly shape the dynamics of farm and food system activity.
Many analyses will choose to focus on a smaller scale, perhaps by examining the dynamics of the food system in particular regions of the United States, or by focusing on the production of a particular commodity or class of commodities (say the poultry production system, or the fruit and vegetable system). In these cases, the general conceptual model that includes both the supply chain and the biophysical and social/institutional components is still helpful in pointing to the key components that an assessment would need to include. In these cases, the physical and economic boundaries of the components that are considered to be “inside” or “outside” the system may differ, depending on the focus of the study.
Although drawing a bright line at the U.S. border when defining the food system can be analytically helpful, it is impossible to ignore the fact that the U.S. food system is increasingly integrated within a much larger global food system. The boundaries of the U.S. food system are highly permeable to the rest of the world’s food system (see Figure 2-9). People migrate, agricultural inputs and food products are traded, and policies and markets create price and behavioral repercussions elsewhere. Changes in global environmental conditions also affect food system dynamics across
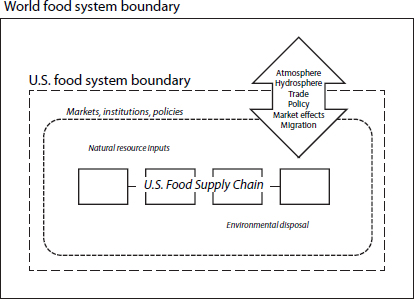
FIGURE 2-9 Conceptual model of connections between the U.S. food system and the global food system.
national boundaries. Some of these interactions are episodic, but many have become deeply embedded interdependencies. As a result, any analysis of the effects of changes in the U.S. food system would be incomplete without accounting for responses and feedbacks related to global markets, policies, technology, and influencers.
EVOLUTION OF THE U.S. FOOD SYSTEM
This section provides a brief history of food and agriculture in the United States by highlighting events that shaped the development of the current food system. It points to the core drivers and major trends that will continue to shape this constantly changing and evolving system in the future. As the committee discusses in more depth in Chapter 6, the food system is a good example of a complex adaptive system where changes in one part (or outside the system) often generate unexpected outcomes in other parts of the food system. Assessing the effects of different configurations of the food system needs to integrate considerations of how key drivers and feedbacks will affect outcomes.
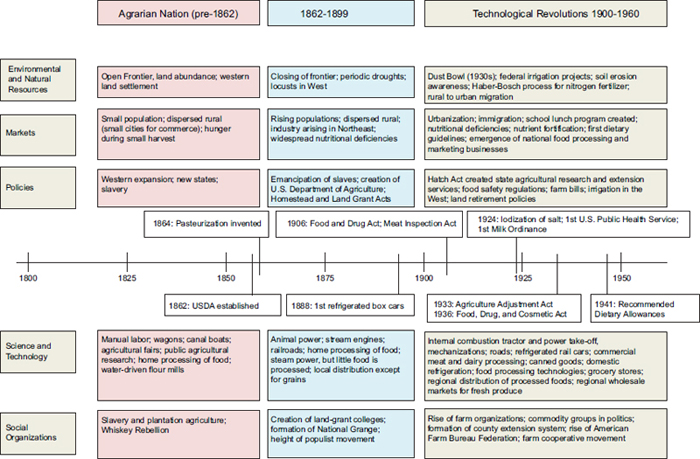
FIGURE 2-10 Major drivers and changes in food and agriculture in the United States from 1800s to 1960.
SOURCES: ARS, 2014; Backstrand, 2002.
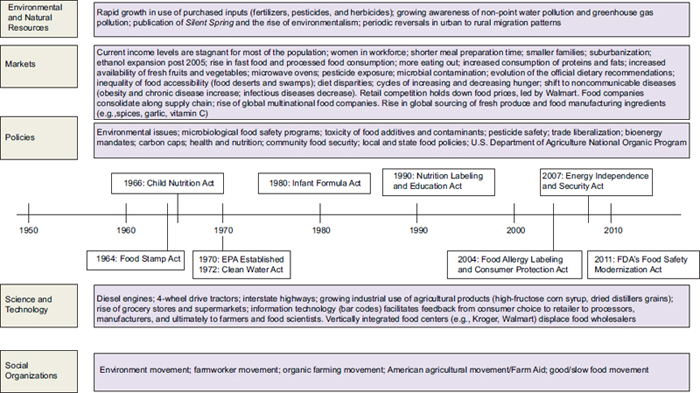
FIGURE 2-11 Major drivers and changes in food and agriculture in the United States from 1960 to present.
SOURCE: Gardner, 2002.
The timeline shown in Figures 2-10 and 2-11 provides a very general chronological guide to some of the key events or changes in natural resources, markets, policies, science, and technology, as well as the social organizations that shaped the evolution of the U.S. farm and food system from 1800 to 2014. Taking a long view, the current U.S. food system clearly bears little resemblance to the food system that sustained the nation’s population throughout the 19th century. Figure 2-12 shows how the farm sector witnessed dramatic growth (in both farm numbers and farm acreage) throughout the 19th century, as high rates of immigration and the rapid expansion of frontier land settlement contributed to the growth of the nation. During the 20th century, output continued to rise, but technological change and growth in farm size was associated with a steady drop in farm numbers and the size of the hired farm labor force. Meanwhile, total acres used in farming remained relatively stable, though the total available prime farmland has declined slowly as urban and suburban areas have expanded onto former farm fields at the outskirts of cities and small towns.
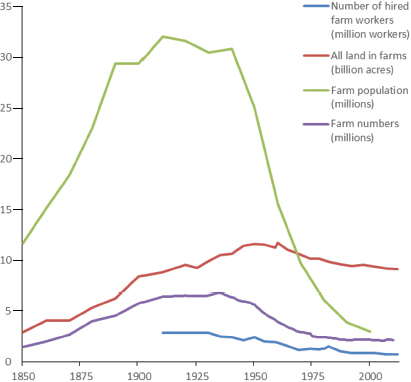
FIGURE 2-12 Number of acres of farmland, farm numbers, farm population, and number of hired farm workers in the United States from 1850 to 2012.
SOURCES: Agriculture in the Classroom, 2014; BLS, 2014; NASS, 2014a,b; U.S. Census Bureau, 2014a,b; USDA, 2012.
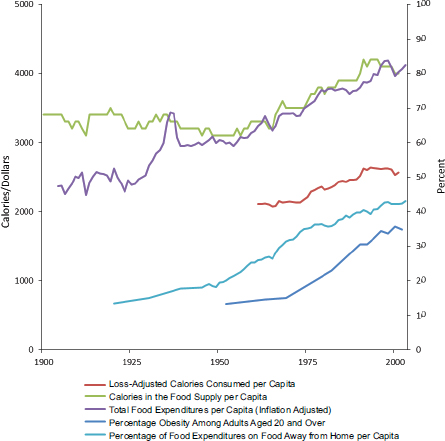
FIGURE 2-13 Trends in major indicators of food supply, expenditures, and nutrition in the United States, 1900-present.
SOURCES: CDC/NCHS, 2014; CNPP, 2014; ERS, 2013a.
Similar dramatic changes have occurred throughout the food supply chain, with dramatic impacts on the nutrition and health status of the population. Figure 2-13 illustrates a steady growth in the availability of calories (on a per-capita basis) since the middle of the 20th century. The graph also shows a steady rise in the inflation-adjusted volume of food expenditures in the United States, possibly due in part to improvements in diets, increased consumption of livestock products, and a shift toward consumption of food away from home. On the down side, an increase in obesity and in the loss-adjusted calories consumed per capita also has occurred since the middle of the 20th century.
Although these figures provide some highlights of overall trends, they
do not fully explain the environmental, farm, off-farm, and societal developments that both resulted from and shaped this agricultural transformation. In the next few sections, we explore the importance of these developments in more detail. This discussion is organized around the five major drivers of change introduced above: (1) environmental change; (2) markets; (3) policies; (4) technology; and (5) social organizations. Each of these forces represents dynamic processes that will continue to shape the health, environmental, social, and economic effects of the U.S. food system.
Environmental Change
The quality and spatial distribution of our natural resources—soils, water, and climate—have contributed to the overall development and regional character of farm production across the United States. Over the past 100 years, changes in resource conditions (e.g., soil quality and water availability) and growing awareness of the environmental effects of agricultural activities (and associated policy responses) have been important drivers of change within the U.S. farm sector.
Frederick Jackson Turner, an eminent American historian, argued that the early 20th century represented an important turning point in American society and culture (Cronon, 1987). Before that time, the growth and development of the nation was based on the availability of relatively large quantities of untapped land and natural resources on the nation’s frontier. Early settlers discovered a relatively rich agricultural land with good soils and a favorable climate. A series of migrations westward ensued as farmland in the original 13 colonies began to be depleted because of intensive cultivation there as well as competition from farmers who had moved into newly opened lands (e.g., the Ohio River Valley and Corn Belt states) with climates and soils more suited to crop production.
Regional differences in climate, land quality, and the availability of labor led to the development of distinctive farming systems (Pfeffer, 1983). Patterns of settlement in the Midwest during the mid-1800s also were shaped by large numbers of northern European immigrants, who had extensive experience with mixed crop–livestock systems. The southeastern United States was dominated by a slave-supported plantation agriculture that produced export crops (cotton, tobacco) and led to little investment in social infrastructure. California after Spanish settlement had a hacienda system in place where large landowners established elaborate irrigation systems and farming operations that spread over extensive land. Differences in the original natural resource base and changes in resource conditions associated with different farming systems shaped patterns of land management and population movement. One major factor in this evolution was that the availability of land in most areas of the United States was much greater
than the availability of labor, except where slaves were used. In Iowa and much of the Midwest, the U.S. government gave away quarter sections (160 acres)3 to those who could show they used it effectively.
The closing of the American frontier occurred simultaneously with the rise of industrialization and concentration of economic activity in the urban centers of the growing nation. A process of outmigration from agriculture was associated with a time when the amount of land available for farming was at its peak (see Figure 2-11), leading to growth in farm size and rapid technical changes that allowed greater productivity and production by a smaller number of people.
The availability and quality of natural resources continues to be a primary driver behind management decisions within the U.S. food system, particularly at the farm level. Farmers make crop decisions based on the availability of water, climate appropriateness, and soil quality. As a result, prime farmland tends to be located where natural resources are plentiful (i.e., rich, deep soils; available surface and groundwater sources; and favorable climates). During the early decades of the 20th century, in many parts of the United States, prime farmland was replaced by urban centers reliant on natural resources, especially water, and favorable climatic conditions. This forced food production to lands characterized by fewer natural resources and less satisfactory growing conditions. The agriculture sector overcame this obstacle by substantially increasing yields on both prime and marginal farmland through the development and implementation of technological advances in the 1930s and 1940s, such as new genetics (e.g., hybrid corn), the use of synthetic fertilizers, investment in large water projects to irrigate the West, greater use of pesticides to combat pest outbreaks, and a widespread shift to mechanical traction and tillage.
These technologies led to the successful production of food for a growing population, but not without significant environmental consequences. In the 1930s, U.S. agriculture in the Great Plains and the West faced severe drought and widespread soil erosion (known as the “Dust Bowl”), leading to a focus on soil conservation policies and practices. Growing concerns over the impacts of pesticide and synthetic fertilizer use on soil quality, species biodiversity, and water and air quality in the latter half of the 20th century, as well as overpumping of groundwater in several parts of the country, sparked the development of additional conservation policies, environmental protection regulations, and a renewed interest in the production of food, fiber, and fuels that used management strategies having minimal impact on the environment. Conservation policies and environmental regulations enacted at the federal, state, and local levels—mainly since the 1970s, in response to the degradation of air and water quality—sought to protect
_____________
3 Homestead Act of 1862, Public Law 37-64, 37th Cong., 2nd sess. (December 2, 1861).
natural resources while at the same time meeting the growing demands for a safe, affordable, and plentiful food supply.
The 1960s brought further concerns over the impact of pesticides on the environment. The publication of Silent Spring by Rachel Carson in 1962 is credited with initiating the development of such landmark policies as the formation of the Environmental Protection Agency (EPA) in 1970, the 1972 Federal Insecticide, Fungicide, and Rodenticide Act,4 and the 1972 Federal Water Pollution Control Act5 (commonly known as the Clean Water Act). In more recent years, the development and adoption of integrated pest management strategies continues to increase in an effort to address pest problems while reducing pest resistance, protecting water quality, and reducing human and wildlife exposure to potentially toxic chemicals. Additionally, widespread eutrophication of freshwater systems and hypoxia zones in the Gulf of Mexico over the past 30 years, attributed to nutrient loading mainly from agriculture, has heightened the call for increased regulations on non-point source pollution in several U.S. states.
Recently, consumer demands for environmentally friendly products are shaping agricultural management decisions. For example, the increase in the demand for organic foods and humanely raised animals is a result of consumer choice and attendant changes in corporate buyer standards (a phenomenon known as “market pull”). Additionally, climate change will most likely become a significant driver of U.S. farming practices, as changes in temperature and rainfall patterns may limit the types and quantity of crops grown in what is now the most productive agricultural land in the United States.
Markets
A major driver of the U.S. food system’s evolution—one that continues today—is market forces, especially the competitive pressure to produce more, ever more efficiently. Market forces reflect decisions by economic actors seeking to maximize their well-being, and always take place within broader institutional, political, and technological contexts (discussed in more detail in the next sections), which in turn shape the distribution of economic costs and benefits. Over the past century, intense market competition, globalization, and changes in consumer preferences have contributed to a dramatic restructuring of the organization of both farm and food production, and to the development of new and rapidly evolving food markets and technologies. Some of these interdependent changes are described briefly below.
_____________
4 Federal Insecticide, Fungicide, and Rodenticide Act, 7 U.S.C. § 136 et seq. (1996).
5 Federal Water Pollution Control Act, Public Law 92-500, 92nd Cong., 2nd sess. (October 18, 1972).
Restructuring of Farm and Food Production
Competition to be productive and profitable and the development of new technologies and management practices have contributed to significant farm consolidation in the United States. In 1850, roughly half of the U.S. population lived on farms; today, less than 1 percent of Americans earn their livelihoods from farming (BLS, 2014; U.S. Census Bureau, 2014a). This has been termed the “great agricultural transition” of the 20th century; farming was abandoned as a household livelihood strategy (Lobao and Meyer, 2001). The mass decline of the farm population resulted in fewer and larger farms. The concentration of farm sales and assets, the specialization of farm enterprises and regions, and agribusiness concentration increased greatly over the last half of the 20th century (Buttel, 2003a) and continue to this day.
Roughly 80 to 90 percent of U.S. food production is now provided by the 10 to 20 percent of farmers who farm full-time (Hoppe and Banker, 2010). They are typically well educated and run commercial businesses with sales often well above USDA’s $350,000 threshold for “large commercial farms” (Hoppe and MacDonald, 2013). Parallel to this, the number of farming-dependent counties has fallen to fewer than 500 today, with such off-farm activities as manufacturing, services, and amenities becoming more important sources of local well-being in rural counties (ERS, 2006, 2012). Where rural communities have lost off-farm activities, many services, such as hospitals and schools, have closed.
Concentration also has occurred in the hog and beef industries, where production has shifted to large specialized farms (MacDonald and McBride, 2009). For example, in 2004, 80 percent of the hog farms had more than 2,000 animals, up from 30 percent in 1992 (Key and McBride, 2007). Vertical integration of production, processing, and marketing has remade many animal protein supply chains. An example is the poultry industry, where integrators (companies that resulted from the integration of feeding, hatching, and processing poultry) and growers have altered their reciprocal business relationships. The integrators now own the birds and feed and control the production process. This structure, combined with the fact that a few integrators control an increasing market share, has resulted in a greater power over poultry growers, with important social consequences. (For research data on concentration of meat markets, see Ward and Schroeder, 1994.)
The seed industry provides a good illustration of the broader pattern of agribusiness firm consolidation in the latter 20th century. The small circles in Figure 2-14 were each independent seed companies that sold inputs to farmers well into the 1970s and 1980s. However, a series of mergers and acquisitions in the 1990s (prompted mainly by the entry of pharmaceutical
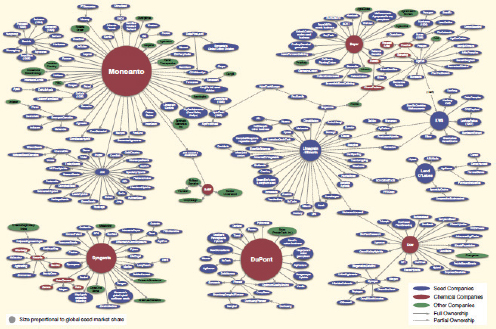
FIGURE 2-14 Seed industry structure, 1996-2013.
SOURCE: Howard, 2014. Reprinted with permission. https://www.msu.edu/~howardp/seedindustry.html (accessed January 8, 2015).
and chemical companies into the sector and with the rise of biotechnology methods to genetically engineer seeds) led to rapid consolidation in the seed industry. In 2013, this sector was under the control of eight major firms (Howard, 2009, 2014).
As a result of these mergers, the crop seed/biotechnology input sector now has what is termed a “four-firm concentration ratio” of 53.9, meaning that the four largest firms have nearly 54 percent of the global market sales for these types of products. The four largest firms in each of the other input industries (agricultural chemicals, farm machinery, animal health, and animal genetics) also have more than 50 percent of the global market sales (Fuglie et al., 2012). In 2012, the U.S. Department of Justice organized a series of workshops that allowed farmers and others to voice their concerns about competing in a highly consolidated market (USDOJ, 2012). (For a selection of potential effects due to industry restructuring, see Chapter 5.)
Similar changes—consolidation, use of new technology, vertical integration, market expansion, and market differentiation—have occurred in the organizational structure of many other parts of the food supply chain. Although some vibrant alternative food systems are emerging, most of the food produced today relies on the logistical coordination of elaborated sup-
ply chains. The competitive pressure to reduce prices has been a key goal stimulating greater efficiencies and organizational changes in the supply chain, from the retailer back to the farmer.
The food processing sector provides a good illustration of the concentration of the material flows within the food supply chain in the United States. The 12 percent of plants with more than 100 employees ship 77 percent of all of the value of food, and mergers and acquisitions continue to occur often (ERS, 2014d). Concentration is not limited to food manufacturing. The top four beef processing companies increased their share of the slaughter market from 36 to 79 percent between 1980 and 2005, while the four firm concentration ratio in hog and poultry reached 64 and 53 percent by 2005 (Macdonald and McBride, 2009). The most concentrated food processing sectors continue to be beef packing and soybean crushing (see Figure 2-15). By 2007, the concentration ratio in poultry reached 58 percent (see Figure 2-15). The most dramatic increase in the concentration of food processing sectors since 1990 may be in pork packing, where the four-firm concentration ratio increased from 40 to 66 percent in 2007 (Hendrickson and Heffernan, 2007; Sexton, 2013).

FIGURE 2-15 Four-Firm Concentration Index (CR4): Percentage of total processed volume controlled by top four firms, 1990 and 2007.
SOURCE: Data from Hendrickson and Heffernan, 2007.
Farm and Food System Labor
The evolution of the U.S. farm and food sector also is shaped by the skills and availability of the labor force. Farm production suffers from the particular challenge of requiring large amounts of labor at critical times (e.g., during crop harvest), followed by extended periods of low labor demand. Regional differences in the structure of U.S. farming have been linked to the relative abundance or scarcity of labor (Pfeffer, 1983). Family-run farms have survived in part because unpaid family members were able to provide flexible labor to the operation without the fixed costs of a hired workforce (Reinhardt and Barlett, 1989). In recent years, U.S. farmers and the food manufacturing and food service industries have come to rely more heavily on hired workers, many of whom are believed not to be authorized to work in the United States (Martin, 2013; Martin and Jackson-Smith, 2013). Immigration policies, access to land for independent operators, efforts to organize or unionize hired workers, and competition from non-farm sectors offering better income or benefits have all contributed to the degree to which farm and food production has been able to rely on unpaid family labor and inexpensive hired workers (Findeis et al., 2002; Martin, 2009).
The availability of a flexible labor force willing to work for relatively low wages and minimal benefits has been an important factor in the evolution of farming and food system industries (FCWA, 2012). On the other hand, the farm and food sectors have seen dramatic increases in labor productivity related to mechanization and other technological changes. For much of the 20th century, mechanization has facilitated the growth in scale and productivity on most U.S. farms, and it has freed labor to flow to non-farm industries in urban areas (Gardner, 2002; Lobao and Meyer, 2001). The pace and direction of mechanization in farm production and food processing have been linked to situations where global competition is intense and domestic labor costs are relatively high due to scarcity, changes in labor law, or efforts to unionize workers (Calvin and Martin, 2010; Fidelibus, 2014; Friedland et al., 1981).
Restructuring of Food Sales Sector
The retail–wholesale sector also has evolved dramatically since the 1980s with the advent of self-distribution centers by large retail food companies (those with more than 100 stores). Traditionally, wholesalers have bought foodstuffs (and other consumer product goods) from processors and manufacturers, held the inventory in their warehouses, and resold and delivered them to retail stores or other buyers. In recent years, many of these wholesalers have gone out of business, shrunk to providing these ser-
vices to smaller stores, or become logistics companies. This evolution came about as part of retail business strategies designed to hold as little inventory as possible, which in turn induced wholesale warehouses to shrink their inventory and switch to a faster turnover model. The ideal, though not attainable, goal is to have a just-in-time delivery model.
The 1990s saw the creation of retail “supercenters” and big box stores that also offer nonfood products. Key operational changes that made these stores possible were (1) the increased collaboration between retailers and suppliers with the development of retailer-owned distribution centers; (2) the acquisition and analysis of consumer purchasing data at each store;6 (3) lower food prices (and less profitability in the food segment) that could be sustained by retailers with more profitable sales in general merchandise; and (4) restructuring of operations, closing older stores and focusing on core areas to further cut costs. Other strategies to stay competitive have been (1) globalization, which lowers the costs of marketing and provides year-round availability of fresh produce; (2) product differentiation, such as organics or private labels; (3) perks for consumers (nonfood products, e.g., gas, electronics, car washes); and (4) new technologies, such as self-checkout lines.
Smaller retailers and midsize consumer package goods firms have not been able to compete with the supercenters’ ability to negotiate low prices. Because of the economies of scale, the costs of technology, and the speed of the changes, the big retailers and suppliers have been able to buy or merge with other companies while smaller firms have been bought or simply disappeared.
Structural changes in this sector have led to a situation in which the largest 20 retail food companies have 64 percent of all of the sales. The top four have nearly 40 percent of retail food sales, and the top one has almost 20 percent of retail food sales. Ninety-one percent of retail food sales are in some type of supermarket (ERS, 2014f). Figure 2-16 illustrates the growing share of sales captured by the top 4, 8, and 20 retail food companies between 1992 and 2013. The 2007-2009 recession, however, slowed the rise in the share of sales.
Evolution of Other Food System Sectors
In contrast to the sales sector, consolidation has not happened as quickly in the food service sector. In fact, the number of companies in this
_____________
6 This practice of sharing information about sales was started by large food retailers in the early 1990s and it resulted in inventory efficiencies for processors/manufacturers, wholesalers, and retailers. It was later adopted by other retailers domestically, then internationally.
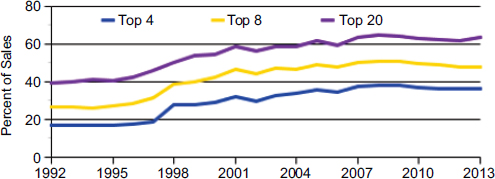
FIGURE 2-16 Top 4, 8, and 20 firms’ share of U.S. grocery store sales, 1992-2013.
SOURCE: ERS, 2014f.
sector has increased. Small venues can perform well when they can differentiate themselves based on products and services offered.
The development of a national infrastructure also has affected the evolution of the food supply chain. Improved cold chain and transportation economics have opened the potential for national markets for fresh meats, seafood, and fruits and vegetables, which can sometimes supplement and sometimes displace local, seasonal production. Freeze-drying and ultra-high temperature techniques have had similar effects for coffee and dairy products. Completion of the interstate highway system has made truck delivery of both fresh and packaged goods possible to virtually every city and town. This has facilitated development of national brands and consolidation among food processors and manufacturers, and it has had a similar effect on retail, with the growth and then consolidation of supermarket chains. Infrastructure developments also have underpinned the uniform product offerings and quality controls that have facilitated the growth of fast-food chains.
Falling costs also have resulted in offsetting developments. For example, private labels seek to offer a comparable product to national brands at a lower price point. Their market share now approaches 25 percent (IRI, 2013). Lower costs also make premium brands and offerings available to larger markets, giving rise to supermarkets and restaurants that are priced between discount houses/fast-food chains and deluxe establishments. With food costs overall declining toward 10 percent of the average American’s disposable income, more meals eaten away from home also have become accessible to more people (ERS, 2013a).
One of the most important market developments has been the emer-
gence of futures markets7 traded on centralized exchanges. This has made price discovery more transparent, brought national and international supply/demand factors to bear on local markets, facilitated forward sales and contracting, and given farmers, handlers, processors, distributors, and users new tools for managing price risks in future time periods. Moreover, clearinghouses at these centralized exchanges have eliminated the risk of default, making futures markets an attractive way to hedge or unload unwanted price risks.
Changes in Food Prices
Food prices are a function of the interaction of supply and demand, which are, in turn, functions of major drivers involving bioavailability (land and climate), income of both producers and consumers, the productivity (efficiency) of crop and livestock production, and the growth in population. On the supply side, crop production and productivity respond to technology (e.g., seed, fertilizer, and capital equipment) as well as the availability of land. The more efficient the production is (more output per acre of land), the lower the price of the commodity. The caveat on this price is that the productive units (e.g., farmers, processors, and distribution companies) must cover at least their average variable costs and provide a margin for profit. If the prices that these suppliers can receive in the market are less than their costs, they will go out of business. Public policy that encourages more crop production can act to decrease the costs and therefore the price (corn and soybeans) or decrease competition and increase the price (sugar). Increased demand for the crops and livestock will increase the price when demand exceeds the supply.
On the demand side, consumer income, population growth, and changing tastes and preferences influence food demand. The willingness to pay for more or better quality food rises as income rises. The feedback loop from consumer markets is critical to informing food producers all along the supply chain about the quantity and quality of food that will sell on the market. Heterogeneous consumer tastes and lifestyles heavily influence the types of food that are demanded in the market. As incomes rise in low- to middle-income populations globally, consumers demand more animal protein and the raising of more livestock demands greater crop production and generally higher prices. The demand for animal feed is a driver for increased crop production, yet as crop production becomes more efficient, the price per bushel can actually drop. In addition, the demand for crops used to
_____________
7 A futures market is a central financial exchange where people can trade standardized futures contracts, that is, a contract to buy specific quantities of a commodity at a specified price with delivery set at a specified time in the future.
produce fuel or other nonfood products incents greater supply at higher prices, which also increases the price of the commodity used for food.
An important point to understand is that the consumer of raw agricultural commodities is generally not the final consumer, but the supply chain customer (e.g., processor/manufacturer, wholesaler, or retailer). These agents provide the feedback from final consumers about final demand and willingness-to-pay at the retail point of sale. Retail competition plays an important role in holding down final prices to consumers, reducing profit margins all along the supply chain.
As clearly demonstrated in Figure 2-6, the price of food is shaped by many economic sectors beyond agricultural production. Changes in food processing, marketing, transportation, packaging, and retail sectors now have more impact on consumer food prices than do changes in production practices or variation in farm yields and output. As the complexity of the food supply chain increases, the price of food consumed by the public will reflect the gains from greater production efficiencies and the costs associated with increased processing and handling. When food choices are abundant, consumers are likely to substitute among alternatives as the relative prices change. This price and cross-price elasticity of demand8 influences the intersection of supply and demand and the final food price. In addition, a cycle of over- and undersupply of basic crops and livestock occurs as farmers respond to higher and lower prices in the market. Typically, they overshoot their estimates of next year’s prices, creating an oversupply in the years after prices have been high, which suppresses prices in the current year. This continual adjustment occurs and responds to both global and domestic demands.
Price competition among food retailers is one reason why short-term price fluctuations in commodity prices are not fully reflected in the retail store, although over the long run, inflationary pressures will affect consumer food prices. Food price inflation has traditionally been followed with overall inflation. Figure 2-17 illustrates the relative stability of food price increases since 1975.
Changes in Consumer Preferences
Changes in U.S. consumer behaviors also are reshaping markets and the food system (see “Factors Influencing Food Purchase Decisions” in Chapter 5). During the 1960s, with many women entering the workforce for the first time, the food industry used this opportunity to market to
_____________
8 Elasticity of demand is a measure used in economics to show the responsiveness of the quantity demanded of a good or service to a change in its price. It gives the percentage change in quantity demanded in response to a 1 percent change in price.
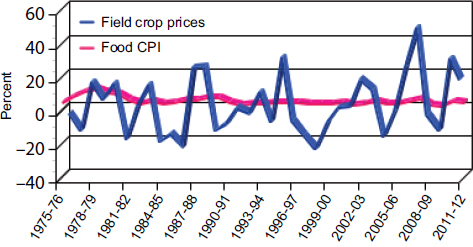
FIGURE 2-17 Percentage change in the annual CPI for food and prices for field crops, 1976-2012. CPI is a measure of the average change over time in the prices paid by consumers for a market basket of consumer goods and services. Field crop prices are represented by the production-weighted average farm price of corn, wheat, and soybeans in the United States.
NOTES: Calculated by the Economic Research Service, based on Bureau of Labor Statistics and National Agricultural Statistics Service data. CPI = Consumer Price Index.
SOURCE: http://www.ers.usda.gov/data-products/food-price-outlook/charts.aspx#fieldcrop (accessed January 8, 2015).
women who had less time to cook for their families. Advances in domestic technologies (e.g., refrigerators and microwaves) and in packaging increased shelf life and made preparation more convenient (Bell and Valentine, 1997; Mintz and Du Bois, 2002). As a result of this and other social trends and changes in consumer attitudes and behavior, over the past 60 years a growing percentage of food in the United States is consumed away from home (ERS, 2013a). Altogether, these changes have likely led to increasingly individualized consumption patterns and larger amounts of added sugars, sodium, and fats in diets.
Many changes in food distribution and consumption have been due to the automobile (Jakle and Sculle, 1999; Schlosser, 2001). The car quickly transformed the architecture of cities and towns across the country—and gradually located supermarkets in the suburbs and away from urban areas. Additional transformations induced by the car were quick-service restaurants and stores with drive-through windows to speed up sales. Although the restaurant industry as a whole steadily grew, fast-food businesses in particular exploded during the late 20th century (Jakle and Sculle, 1999;
Schlosser, 2001). More recently, a study found that the percentage of calories consumed from fast food in adults was lower in 2007-2010 (10 percent of calories) as compared to 2003-2006 (13 percent of calories) (Fryer and Ervin, 2013).
Although some 20th-century trends have contributed to a smaller number of foods in American diets, recent decades have seen a resurgence in diversification. The types of food products and markets available are driven by consumer demands, as they become stimulated by sellers. Alongside commodity, convenience, and staple products, conventional food companies have provided new offerings built around market segmentation and product differentiation. Perhaps the most significant change in consumption patterns in the 21st century has been remarkable growth in demand for food produced or marketed in ways that are perceived to support the health, environmental, or social equity goals of farmers and consumers, such as organic, free range, fair trade, local, and natural. Animal welfare concerns have encouraged the development of free-range, cage-free, and grass-fed products. New interests, such as gluten free, high fiber, and omega-3, have burst onto the market as a result of consumers’ desires for a healthful diet. For example, demand for organic foods in the United States has grown at roughly 20 percent annually (ERS, 2014e). Despite potential benefits and safety protections, some customers—especially in Europe—have expressed preferences for food products grown without the use of genetically modified organisms (GMOs). Concurrently, new alternative food marketing and distribution systems have emerged and grown to deliver such products, including farmers’ markets, community cooperatives, alternative restaurants, or specialized supermarkets.
The role of “risk” in the food system also has changed in response to increased consumer attention and sensitivity to this issue. Some consumers seem to be paying more attention to perceived risks and giving more weight in buying decisions to suspect sources, processes, or future dangers. As per-capita incomes rise, the threshold of acceptable risk has appeared to escalate, moving from risk reduction toward avoidance. At the same time, techniques for detecting chemical residues or foreign substances have become more sensitive (from parts per million to parts per billion or trillion). Although this led to the Food Quality Protection Act9 and effectively repealed the Delaney Clause for pesticides, it also has heightened consumer awareness of and sensitivity to foodborne risks. As described below, government safety policies and risk management strategies by industry (e.g., labeling and certification systems and traceability) also have expanded substantially and become increasingly expensive.
_____________
9 Food Quality Protection Act of 1996, Public Law 104-170, 104th Cong., 2nd sess. (August 3, 1996).
Globalization
As indicated earlier, the U.S. food system has strong connections to the global food system. As recently as the mid-1980s, U.S. agricultural exports and imports were valued at less than $30 billion each (ERS, 2013b). By 2012, exports were worth about $135 billion, and imports were approaching $105 billion, more than a threefold increase for each (Flake et al., 2013). At the same time, global trade of grains, rice, oilseeds, meat, and other commodities has grown dramatically, causing interregional interdependencies.
Global food trade also is beginning to reflect more specialization along lines of relative resource endowments and comparative advantage. Regions with abundant land resources (e.g., North and South America) are shipping hundreds of millions of tons of food per year to densely populated or resource-stressed regions (e.g., the Middle East, North Africa, and Asia) (Portnoy, 2013). Labor-intensive agricultural production, such as fruits, vegetables, aquaculture, and horticulture, are being produced in larger amounts for domestic use and for export to labor-scarce regions, such as the United States.
Changes in food supply and demand in other countries promise to be a major driver of commodity prices and marketing opportunities for U.S. farmers and food processing and distribution firms. For example, a serious problem in many countries is continuing food insecurity, which can take the form of chronic hunger, periodic food crises, or malnutrition among vulnerable population groups. During much of the 20th century, the drive for greater efficiency in agricultural production yielded a steady decline in inflation-adjusted food prices. These falling real food prices, in turn, were a major factor in reducing chronic global hunger. By contrast, rising real commodity prices in the first decade of the 21st century has reversed this decline, and it will add as many as 600 million people to the list of the chronically hungry by 2025 if the trend continues (Runge and Senauer, 2007). Moreover, tight supplies produced serious, temporary food crises in 2008 and 2012, which were aggravated by market-disrupting price-control and export-control policies.
The problem of food insecurity for some has been compounded by economic development and increases in per-capita incomes, which have generated an increased preference for animal protein in the diet. Although these dietary shifts reflect strong preferences as disposable income rises, they also add to the challenge of feeding 9 billion people by 2050. In addition, urbanization is proceeding at the fastest rate in human history; Africa and Asia are likely to be two-thirds urban within two decades. In addition, virtually all of the projected global population growth between now and 2050 will occur in low-income countries, many of them already crowded.
This combination of forces will reshape the food security challenge in critical ways.
Policies
The unfolding of market forces in U.S. agriculture has always been shaped by the policies and institutions that were developed to accomplish a wide range of public goals. The development of local, state, and federal policies to address farm production, food safety, and other public goals has played a pivotal role in the evolution of the current U.S. food system.
Farm Policy
Modern farm policy has its roots in the federal response to the Great Depression through the Agricultural Adjustment Act of 1933 and its successors. A collapse in both domestic food demand and exports had led to price-depressing surpluses. U.S. farm policy responded by supporting prices of designated commodities at levels thought to be fairer than market prices. The main commodities covered were grains, oilseeds, cotton, rice, and dairy, although marketing orders came to be available for some fruits and vegetables. This quickly resulted in accumulation of surpluses for those commodities.
The farm policy response involved paying farmers and warehousers to store surpluses, paying farmers to reduce their production by idling land or culling herds and paying for surplus disposal through domestic food programs (e.g., 1964 Food Stamp Act10 and 1966 Child Nutrition Act11) and through exports, both as food aid (e.g., Public Law 83-48012) and as subsidized commercial sales. As costs of this strategy mounted, the Kennedy administration conducted a farm referendum in 1963 to see whether farmers would accept mandatory production controls (Cochrane and Runge, 1992). When that referendum failed, farm policy began a process of separating income supports from commodity prices in the marketplace. In the 1960s, political support for farm programs was sustained by broadening the scope of an omnibus legislation to include support for farmers as well as food and nutrition programs designed to address problems and priorities of urban legislators.
The ensuing decades witnessed a sequence of policy shifts that shaped
_____________
10 The Food Stamp Act of 1964, Public Law 88-525, 88th Cong., 2nd sess. (August 31, 1964).
11 Child Nutrition Act of 1966, Public Law 89-642, 89th Cong., 2nd sess. (October 11, 1966).
12 Agricultural Trade Development and Assistance Act of 1954, Public Law 83-480, 83rd Cong., 2nd sess. (July 10, 1954).
the development of the nation’s farm and food industries. During the 1970s, rapid growth in global market opportunities and rising commodity prices led to policy reforms to remove caps on acreage that could be planted with particular crops. When production exceeded demand, market prices for farm commodities were allowed to fall, which benefited food processors and consumers. Meanwhile, federal payments were mainly used to compensate producers for the gap between the market and a designated target price for their products. In the 1980s, efforts to renew farm programs faltered, and environmental advocates succeeded in tying support for farmers to the expansion of programs to incentivize conservation of soil and natural resources. By the early 1990s, the balance of farm output and market demand appeared to be stabilizing, and a desire to reduce government intervention in the decisions of farm producers (“freedom to farm”) led to a shift toward fixed “direct payments” to farmers that were based on historic planting practices rather than annual variation in production or market prices (Gardner, 2000). This experiment was short lived, as severe market downturns led to the restoration of price supports, emergency payments, and other income protection programs for farmers (on top of the continued direct payment programs). Farm policy changed course with passage of the Agricultural Act of 201413 (2014 Farm Act), which was signed on February 7, 2014, and will remain the law until 2018. It makes major changes in commodity programs, adds new insurance options, consolidates conservation programs, and expands programs for specialty crops, organic farmers, bioenergy, rural development, and beginning farmers and ranchers. Price and income support for farmers is now provided primarily through an elaborate suite of subsidized insurance programs. The Act also eliminates the controversial direct payments to farmers and most countercyclical price programs. Although the law reauthorizes SNAP, it tightens the criteria for participation. The Act passed after a 2-year delay, in part as a compromise between rural and urban interests and in part because a reversion to so-called permanent farm law was feared to be highly disruptive.
Environmental Policies
Environmental policies are an increasingly important driver of the evolution of the U.S. food system, particularly with respect to the practices used in production agriculture. The two lead federal agencies responsible for writing and implementing environmental policy are USDA and EPA. Traditional farm policies have tended to subsidize farm production while reducing the risks of farming on marginal lands and drought- or flood-prone areas. These approaches have tended to aggravate the environmental
_____________
13 Agricultural Act of 2014, Public Law 113-79, 113th Cong., 2nd sess. (February 7, 2014).
stresses that agriculture imposes on land and water resources, and the costs of these externalities are not usually captured in the price consumers pay for their food (Buttel, 2003b).
USDA’s approach has focused on voluntary programs and public investments that provide technical and financial assistance to encourage farmers to adopt practices that minimize soil erosion and other environmental impacts. Since the 1980s, federal policy has tied receipt of commodity payments to the adoption of conservation plans (called “conservation compliance”) and paid farmers to retire the most environmentally sensitive lands from active production (under the Conservation Reserve Program and the Wetland Reserve Program). Current programs also provide cost-share incentives for adopting or maintaining environmentally sound practices under the Environmental Quality Incentives and the Conservation Stewardship Programs. The funding of these initiatives often has lagged behind the intent of the authorizing measures (Cochrane and Runge, 1992). Still, some success can be appreciated in the expansion of land under restoration initiatives, the investments in joint ventures where USDA helps with technical assistance and capacity building in sustainable practices, and investments in research. The 2014 Farm Act reduced funding for the Conservation Reserve Program, consolidated conservation programs, and linked crop insurance premium subsidies to conservation compliance.
Debates among agricultural producers, environmental groups, and rural communities in regard to the strictness of the policies to manage animal waste by concentrated animal feeding operations (CAFOs)14 continue. EPA started regulating CAFOs under the Clean Water Act15 in 2003. As with other environmental policies, national guidelines are set up by EPA whereas the states are charged to address specific issues and are responsible for preventing and reducing environmental pollution. Under the National Pollutant Discharge Elimination System (EPA, 2014a), EPA grants states jurisdiction to implement programs to regulate CAFOs to protect surface water. This decentralized approach allows flexibility to respond to unique local industry and resource conditions, but also allows standards to vary from state to state. Recently, EPA has been asked by environmental groups to consider regulating CAFOs under the Clean Air Act,16 but it is unclear whether their emissions exceed established statutory thresholds. In the absence of federal rules, some local governments (notably in California,
_____________
14 CAFOs are agricultural enterprises where animals are confined on a small land area and feed is brought to the animals. The EPA has delineated three categories of CAFOs, ordered in terms of capacity: large, medium, and small. The relevant animal unit for each category varies depending on species and capacity.
15 Federal Water Pollution Control Act, Public Law 92-500, 92nd Cong., 2nd sess. (October 18, 1972).
16 The Clean Air Act, 42 U.S.C. § 7401 et seq. (1970).
the leading agricultural producer in the country) have adopted their own regulations to ensure that agricultural operations do not affect air quality.
Health and Safety Policies
Agriculture and food operations are subject to regulations to prevent the release of potentially hazardous chemicals into the environment. The initial Federal Insecticide, Fungicide, and Rodenticide Act17 sought to ensure that such chemicals performed as advertised. First passed in 1947, changes in the 1970s shifted the focus to protecting humans, including farm workers, and wildlife from harm. The Food Quality Protection Act of 199618 heightened safety standards, especially for infants and children, and required a complete reassessment of tolerances. Initial guidance on appraising the toxicity of chemicals in food was published in 1949 and revised in 1982 with guidance on toxicological considerations for food additives (this guidance is called the “Redbook” [FDA, 2007]). The Food Allergen Labeling and Consumer Protection Act19 (2004) was enacted to ensure accurate labeling of food products relative to allergens present, as this is the only way that consumers can avoid consuming potentially life-threatening food allergens.
Food safety policy also has focused on managing the risks from pathogen contamination. Microbial contamination can originate on farms or food handlers and can be introduced as food is stored, transported, or processed. Regulations to prevent and control pathogen contamination began with the Pure Food and Drug Act of 190620 and were supplemented by a number of laws dealing with milk (1924), shellfish (1925), and restaurants (1934), culminating in the 1938 Food, Drug, and Cosmetic Act.21 Other important laws are the Federal Meat Inspection Act,22 the Poultry Products Inspection Act,23 and the Egg Products Inspection Act,24 administered by USDA’s Food Safety and Inspection Service. In the 1960s, the Hazard Analysis and
_____________
17 Federal Insecticide, Fungicide, and Rodenticide Act, 7 U.S.C. § 136 et seq. (1996).
18 Food Quality Protection Act of 1996, Public Law 104-70, 104th Cong., 2nd sess. (August 3, 1996).
19 Food Allergen Labeling and Consumer Protection Act of 2004, Public Law 108-282, 108th Cong., 2nd sess. (August 2, 2004).
20 Pure Food and Drug Act of 1906, Public Law 59-384, 59th Cong., 1st sess. (June 30, 1906).
21 Federal Food, Drug, and Cosmetic Act, Public Law 75-717, 75th Cong., 3rd sess. (June 25, 1938).
22 Federal Meat Inspection Act, 21 U.S. Code Chapter 12 § 601.
23 Poultry Products Inspection Act, Public Law 85-172, 85th Cong., 1st sess. (August 28, 1957).
24 Egg Products Inspection Act, Public Law 91-597, 91st Cong., 2nd sess. (December 29, 1970).
Critical Control Points (HACCP) risk-based approach to food safety was initiated, first for the U.S. space program but subsequently for the broader food supply. The HACCP’s prevention-focused approach for pathogens and chemical and physical hazards has expanded voluntarily throughout many segments of the food industry. In response to significant outbreaks and concerns, HACCP-based regulations have been introduced, including the Food and Drug Administration’s (FDA’s) Low Acid Canned Foods regulations (1970), USDA’s Pathogen Reduction/HACCP rule (1996), and FDA’s HACCP regulations for seafood (1999) and juice (2001). The 2010 Food Safety Modernization Act25 (FSMA) extended this preventive strategy for food safety to foods not covered by HACCP regulations. Other important provisions of FSMA currently under consideration by FDA are first-time mandatory preventive controls at the farm level and stricter controls of imported foods. FSMA also placed more responsibility on food companies to record and report food safety issues.
FDA and USDA food safety regulations apply only to products in interstate commerce, while food service and retail food safety considerations are managed by state and local jurisdictions. FDA’s Food Code, updated every 2 years, provides a model for adoption by these jurisdictions. This consensus-based process, managed by the Conference for Food Protection, involves government, academic, industry, and consumer delegates and leads to science-based requirements to minimize biological, chemical, and physical hazards in foods.
In addition to health and safety policies, two types of nutrition policies have been key drivers of the food system. The first is the Recommended Dietary Allowances (RDAs) for key nutrients, which were established in 1941 because of concerns about nutrition deficiencies among many recruits during World War II. In 1989, the National Research Council published the 10th (and last) edition of the RDAs. The Dietary Reference Intakes (DRIs), first published in 1997, represented a new methodological approach to the development of nutrient reference standards. The most recent edition of the DRIs was released in 2010. Developed by expert committees, they are used to plan and assess diets for healthy people, including the standards for government nutrition assistance programs (e.g., WIC and SNAP), and to estimate the percent of recommended nutrients on the Nutrition Facts panel of packaged foods.
A second nutrition policy is the Dietary Guidelines for Americans (DGA), which has been published jointly by the U.S. Department of Health and Human Services and USDA every 5 years since 1980. The Guidelines are based on the recommendations of a panel of experts (USDA and HHS,
_____________
25 FDA Food Safety Modernization Act, Public Law 111-353, 111th Cong., 2nd sess. (January 4, 2011).
2010). The DGA provides guidance about reducing consumption of foods that are believed to increase the risk of chronic disease and increase consumption of foods that promote health. In addition to advice for the general population, the DGA represents a statement of federal nutrition policy and forms the basis of all federal nutrition programs.
The importance of nutrition assistance programs in relieving food insecurity cannot be overemphasized. For example, in 2013 SNAP helped more than 47 million participants with their food purchases each month. In 2010, it reached approximately 75 percent of eligible individuals in a month (Rosenbaum, 2013). Other programs, such as WIC and the School Breakfast and Lunch programs, have a similarly large impact on the ability of individuals and families to access a nutritious diet. Fifty-one percent of infants born in the United States participate in WIC during the first year of life (Betson et al., 2011). The National School Lunch Program serves more than 30 million children per day. The School Breakfast Program has 13.5 million participants (FNS, 2014). Many private feeding initiatives, including Feeding America and its local food banks, local food shelves, and institutional feeding programs for the homeless, play a critical role in reducing food insecurity.
Energy Policies
Early in the 21st century, major changes to energy policy began to affect the food system. Prompted by concerns about dependence on oil imports and risks from climate change, the Energy Policy Act of 200526 and the subsequent Energy Independence and Security Act of 200727 mandated the blending of renewable fuels (especially ethanol) into the national automobile fuel supply. Associated farm policy added subsidies and tariffs to favor domestic U.S. ethanol production. As a result, grain ethanol production quickly came to consume 40 percent of the U.S. corn crop, though some of the by-products returned to the food system as livestock feed (see Chapter 7, Annex 2).
Other Policies
Two final broader policy arenas that continue to shape the evolution of the modern U.S. food system have been trade and climate policies. Agricultural protection has persisted through a number of trade-negotiating rounds, both in the United States and in key customer countries. This is
_____________
26 Energy Policy Act of 2005, Public Law 109-58, 109th Cong., 1st sess. (August 8, 2005).
27 Energy Independence and Security Act of 2007, Public Law 110-140, 110th Cong., 1st sess. (December 19, 2007).
because much governmental support for agriculture is through high and protected domestic prices rather than through direct subsidies, and it has resulted in lower exports of commodities in which the United States has a comparative advantage (especially grains, oilseeds, and livestock products) and lower imports of commodities in which other countries—particularly developing countries—have a comparative advantage (e.g., sugar, seafood, and fruits and vegetables) (Josling et al., 1996).
Climate change concerns have ushered in more attention to farming practices, as agriculture is estimated to contribute to greenhouse gas (GHG) emissions (EPA, 2014b; IPCC, 2014; Vermeulen et al., 2012). On the other hand, agriculture also is a potentially important carbon sink, so its overall carbon footprint has become more important in policy debates and production and marketing practices (Clay, 2004). Still, comprehensive national legislation to curtail GHG emissions is just starting to be developed. Progress has been made on adaptation, however, where the federal government has made some efforts to support local communities. For example, as part of President Obama’s initiative to reduce methane emissions, USDA has created seven new “climate hubs” to help farmers adapt their operations to a changing climate. In addition, in September 2014 Obama announced the launch of the Global Alliance for Climate Smart Agriculture to promote solutions in agriculture that can help decrease the impact of climate change. Future climate policy initiatives will undoubtedly be a driver of how the food system will develop.
Technology
Technology has exerted an enormous influence on the food system, both in lifting resource constraints and in ushering in new issues and concerns. At the production end, hybrid seeds, synthetic fertilizers, chemical pesticides, mechanical innovations, information technologies, genetics, bioengineering, and precision agriculture have transformed the face of conventional farming. Together, they have continued to lift the productivity of land and labor; reduced losses to pests, diseases, and waste; increased resilience of plants and animals to weather variations; and produced an abundant quantity and variety of food choices. At the same time, they have given rise to new concerns about chemical residues in foods; pollution of air, land, and, especially, water; and worker exposure to new hazards.
Some of the most significant technological changes that have transformed production agriculture over the past 100 years include
- Mechanization, which freed up land from producing feed for draught animals for use to produce food while enabling individuals to farm more land;
- Synthetic fertilizers and pesticides, which increased yields per acre and reduced losses to pests and diseases;
- Plant and animal breeding, which increased land, feed, animal, and human productivity and shortened time to market; and
- Information and management practices, which made agronomics and animal husbandry increasingly science based and data driven.
At the processing and distribution levels, technology has enabled better control of pathogens and spoilage organisms, a larger range of product offerings, the substitution of capital and machinery for labor (especially in repetitive tasks), and the minimization of loss or waste. Because new technologies can convey a competitive advantage to early developers or adopters, however, they also have further facilitated industry consolidation and growth in market reach of firms to national and international levels while resulting in dislocations of workers and communities (see Chapter 5).
Consumption of food also has been reshaped by technologies. Packaging improvements have prolonged the useful life of many foods. Appliances—especially the microwave—have changed food preparation and use. Our mobile society has created huge markets for ready-to-eat and handheld items. Declining real food costs, demands for fresh (not frozen or canned) foods, and ease of disposal have increased waste at points of consumption. Bar codes have facilitated inventory management as well as an awareness of consumer behavior, giving added impetus to some market segmentation and product differentiation. Concentration, vertical integration,28 and inventory management have not only lowered food costs and expanded choices but also contributed to an environment in which obesity and other unhealthy behaviors have increased.
Modern genetic engineering techniques also have been a powerful force for change. Genetically engineered corn and soybeans have led to the most rapid transformation of global cropping patterns in history. In the United States, 90 percent of all cotton, corn, and soybean acres have genetically engineered traits (Fernandez-Cornejo et al., 2014), and globally they are planted in 28 countries (James, 2012). From a global perspective, the Food and Agriculture Organization acknowledges that biotechnology can be a useful tool to address the issue of food security when applied appropriately (FAO, 2014). Potential benefits of GMO food applications include improved nutritional value (e.g., the incorporation of the vitamin A precursor, β-carotene, to rice), increased fish yield (e.g., aquaculture tilapia), and tolerance of poor environmental conditions (e.g., drought-resistant
_____________
28 Vertical integration is a form of business organization in which all stages of production of a good, from the acquisition of raw materials to the retailing of the final product, are controlled by one company.
and salt-tolerant crops). Although 60 percent of the area planted to bioengineered seeds is in the United States and Canada, adoption in developing countries is expanding rapidly, and 90 percent of the 14 million farmers planting transgenic crops live in developing countries (James, 2012). This rapid adoption is driven by higher yields and lower pesticide costs that more than offset higher seed costs, with these benefits captured by small and large farmers alike (Raney and Pingali, 2007).
Since their first commercial introduction in 1996, the costs and benefits of genetically engineered plants and animals have generated controversy among consumers, farmers, advocates, and scientists. Potential risks that need to be managed include inadequate control (e.g., GMO genes transferring to non-GMO crops), transfer of allergens, displacement of native species, and other unpredicted issues. Some stakeholders are concerned about the emergence of super-weeds, reliance of farmers on agrichemical inputs, reduced biodiversity, or other environmental and trade issues (Benbrook, 2012; Garcia and Altieri, 2005; Gurian-Sherman, 2009; Liberty Beacon Staff, 2013). As a result, the technology has been taken up very unevenly. For example, in the United States, no wheat or rice is genetically modified. Globally, Western Europe has imposed strict labeling and tracking requirements that have essentially banned products of the technology there, while Canada, China, Brazil, and Argentina grow genetically modified crops, especially for animal feed. Differing standards and timing of approvals for genetically engineered products has disrupted trade patterns and led to disputes. Overall, genetic engineering continues to struggle for acceptance among some consumers and for additional applications, such as in animal and aquaculture production. Past National Academy of Sciences (NAS) reports have examined these questions, but with the limited data available at that time, the reports were only able to provide informed advice about the potential unintended consequences on health and environment (NRC, 2000, 2002; NRC and IOM, 2004). Currently, another NAS study is being conducted to examine the data and critically evaluate the issues.
Social Organizations
The demand for food products is driven by consumer preferences as they are shaped by marketing and advertising, but important social organizations also contribute to product demand (and changes in policies). These include public and private educational institutions where many U.S. children are first exposed to information about diet, nutrition, and health (Golden and Earp, 2012; St. Leger, 2001), as well as the extensive food advertising and marketing efforts by the food industry (Brownell and Horgen, 2003). Changes in the structure of the family and related shifts in the role of women in the workforce also have been important drivers of
food system changes. Social movements—historically built around issues of food safety, but more recently related to how food is produced in the United States—have always been important drivers of change in policy and dietary practices. Finally, changes over time in the structure and organization of the U.S. health care industry can have significant effects on the incentives and disincentives to consume food in particular ways.
Whether food marketing is based on the way foods are presented at a grocery store, labeling on the food itself, or various forms of advertising, the food industry (like other industries) is aggressive in its marketing strategies. Some of these practices have been sharply criticized. For example, a 2006 Institute of Medicine report concluded that “food and beverage marketing practices geared to children and youth are out of balance with healthful diets, and contribute to an environment that puts their health at risk” (IOM, 2006, p. 10). Chandon and Wansink (2012) also proposed that food marketing has contributed to obesity by increasing the accessibility to large portions of inexpensive, tasty, and calorie-dense food.
Although the growth of television advertising is often thought of as the best example of using marketing tools—for good or ill—to shape consumer preferences and values, other industry advocacy practices also have shaped the landscape of the food system. Conventional food production companies have pursued growth through market segmentation and new product offerings for ever more selective tastes. Evidence also suggests that some companies have been able to find economic advantages from offering healthy options (Cardello and Wolfson, 2013).
Social movements are important drivers of food system changes. A wide range of social and political actors have sought to influence public policy and cultural values surrounding food. A tradition of critical food system journalism and literature goes back at least as far as Upton Sinclair, whose classic exposé of meat packing in Chicago led to dramatic reforms of labor law and public health regulations (Sinclair, 1906). This interest is exemplified by groups such as the Union of Concerned Scientists, the Center for Science in the Public Interest, and the Consumer Federation of America; organic producers; and food system critics like Michael Pollan and Mark Bittman. The organization of a consumer boycott and unionization of Californian farmworkers by Cesar Chavez in the 1960s dramatically changed the ability of farm employers in the fruit and vegetable industries to rely on poorly paid migrant workers to bring in their crops and stimulated changes in labor law, mechanization, and consumer awareness of the social costs of modern farm and food production (Holmes, 2010). The long history of academic research and writing also has contributed by raising concerns about the alignment of a market-driven food system with broader social interests, from the health, environmental, social, and economic concerns
addressed in this report to issues such as stewardship of the oceans, climate, atmosphere, and other global “commons.”
Many of these advocacy activities have made indelible marks on the food system. Information, private and public organizations, and social movements have contributed to many of the most significant changes in consumer food behaviors, public policy, industrial restructuring, and technological change over the past 100 years. Cooperatives, antitrust exemptions for producer groups, and farm/commodity programs are policy-based results of such forces.
Advocacy—by industry and its critics—has played and will continue to play a pivotal role in identifying food-related concerns, raising awareness of them, prompting research about them, and promoting debate about them. Some of these concerns ultimately prove to be marginal or misguided, but many of them reshape markets and technologies deployed in the food system or policies that regulate and guide it.
CONCLUDING REMARKS
By many measures, the U.S. food system is very successful. Productivity in agriculture is high due to mechanization, fertilizer and agrichemicals, genetic improvements, and improved information management practices. This has resulted in a food system that is able to nourish the majority of the population and provide food exports to much of the rest of the world. In terms of supporting farmers’ incomes and wealth, from its inception in the Great Depression, farm policy has reduced volatility in farm income and food prices and raised the incomes and wealth of many farm households and landowners (Cochrane, 1993, 2003; Gardner, 2002; Pasour and Rucker, 2005). The food system contribution to the larger economy occurs off the farm, with more than 80 cents from each consumer dollar spent on food going to a wide range of input, output, and consumption services. The food system as a whole still provides about 10 percent of total U.S. employment.
Recognizing these benefits and attributes, this report describes some of the health, environmental, social, and economic effects (both positive and negative) of the U.S. food system and their interrelationships (see Chapters 3-5). Some of the most prominent issues relate to effects on human health, environment, climate change, food insecurity, and social and economic inequalities, which incur social and monetary costs. As demonstrated in this chapter, the effects of the U.S. food system reflect today’s environmental and social/institutional contexts, each of which is constantly evolving in response to many drivers. With food demand globally projected to increase by 70 percent in the next 40 years, the food system will continue to evolve as it responds to new pressures and creates new issues. Although
some of the health, environmental, social, and economic effects of this evolving food system will align with efficiency, others could entail added costs. This creates complex trade-offs that need to be teased out and understood as policy makers, consumers, and other actors make decisions. The analytical framework, discussed in Chapter 7, is aimed at providing tools to understand the effects, interactions, and trade-offs within the food system.
REFERENCES
Agriculture in the Classroom. 2014. Growing a nation: The story of American agriculture. Historical timeline. https://www.agclassroom.org/gan/timeline/index.htm (accessed November 24, 2014).
ARS (Agricultural Research Service). 2014. ARS timeline. 144 years of ag research. http://www.ars.usda.gov/is/timeline/chron.htm (accessed December 16, 2014).
Backstrand, J. R. 2002. The history and future of food fortification in the United States: A public health perspective. Nutrition Reviews 60(1):15-26.
Bell, D., and G. Valentine. 1997. Consuming geographies: We are where we eat. London: Routledge.
Benbrook, C. N. 2012. Impacts of genetically engineered crops on pesticide use in the U.S.—the first sixteen years. Environmental Sciences Europe 24(24):1-13.
Betson, D., M. Martinez-Schiferl, L. Giannarelli, and S. R. Zedlewski. 2011. National- and state-level estimates of Women, Infants, and Children (WIC) eligibles and program reach, 2000-2009. Washington, DC: U.S. Department of Agriculture, Food and Nutrition Service.
BLS (Bureau of Labor Statistics). 2014. Labor force statistics from the Current Population Survey. http://www.bls.gov/cps/cpsaat01.htm (accessed November 24, 2014).
Brownell, K. D., and K. B. Horgen. 2003. Food fight: The inside story of the food industry: America’s obesity crisis, and what we can do about it. Columbus, OH: McGraw-Hill.
Buttel, F. H. 2003a. Continuities and disjunctures in the transformation of the U.S. agro-food system. In Challenges for rural America in the twenty-first century, edited by D. L. Brown and L. E. Swanson. University Park: The Pennsylvania State University Press.
Buttel, F. H. 2003b. Internalizing the societal costs of agricultural production. Journal of Plant Physiology 133(4):1656-1665.
Buzby, J. C., H. F. Wells, and T. G. Bentley. 2013. ERS’s food loss data help inform the food waste discussion. USDA Economic Research Service. Amber Waves. Washington, DC: U.S. Department of Agriculture, Economic Research Service.
Buzby, J. C., H. F. Wells, and J. Hyman. 2014. The estimated amount, value and calories of postharvest food losses at the retail and consumer levels in the United States. Economic Information Bulletin, No. 121. Washington, DC: U.S. Department of Agriculture, Economic Research Service.
Calvin, L., and P. Martin. 2010. The U.S. produce industry and labor: Facing the future in a global economy. USDA-ERS Research Report 106. http://www.ers.usda.gov/publications/err-economic-research-report/err106.aspx (accessed November 25, 2014).
Canning, P. N. 2011. A revised and expanded food dollar series. A better understanding of our food costs. Economic Research Report, No. 114. Washington, DC: U.S. Department of Agriculture, Economic Research Service.
Cardello, H., and J. Wolfson. 2013. Lower-calorie foods and beverages drive Healthy Weight Commitment Foundation companies’ sales growth. Interim report. Washington, DC: Hudson Institute.
Carson, R. 1962. Silent spring. New York: Houghton Mifflin.
CDC/NCHS (Centers for Disease Control and Prevention/National Center for Health Statistics). 2014. Health, United States 2013. With special feature on prescription drugs. Hyattsville, MD: NCHS. http://www.cdc.gov/nchs/hus.htm (accessed November 25, 2014).
Chandon, P., and B. Wansink. 2012. Does food marketing need to make us fat? A review and solutions. Nutrition Reviews 70(10):571-593.
Clay, J. 2004. World agriculture and the environment: A commodity-by-commodity guide to impacts and practices. Washington, DC: Island Press.
CNPP (Center for Nutrition Policy and Promotion). 2014. Nutrient content of the U.S. food supply 1909-2010. http://www.cnpp.usda.gov/USFoodSupply.htm (accessed November 25, 2014).
Cochrane, W. W. 1993. The development of American agriculture: A historical analysis. Minneapolis: University of Minnesota Press.
Cochrane, W. W. 2003. The curse of American agricultural abundance. Lincoln: University of Nebraska Press.
Cochrane, W. W., and C. F. Runge. 1992. Reforming farm policy: Toward a national agenda. 1st ed. Ames: Iowa State University Press.
Cronon, W. 1987. Revisiting the vanishing frontier: The legacy of Frederick Jackson Turner. Western Historical Quarterly 18(2):157-176.
Dutia, S. G. 2014. AgTech: Challenges and opportunities for sustainable growth. Kansas City, MO: Ewing Marion Kauffman Foundation.
EPA (U.S. Environmental Protection Agency). 2014a. Agriculture. Overview. http://water.epa.gov/polwaste/npdes/Agriculture.cfm (accessed November 24, 2014).
EPA. 2014b. Sources of greenhouse gas emissions. http://epa.gov/climatechange/ghgemissions/sources/agriculture.html (accessed November 24, 2014).
ERS (Economic Research Service). 2006. Rural employment at a glance. Economic Information Bulletin No. 21. Washington, DC: U.S. Department of Agriculture, Economic Research Service.
ERS. 2012. County typology codes. Description and maps. http://www.ers.usda.gov/dataproducts/county-typology-codes/descriptions-and-maps.aspx#.VD619RawSew (accessed November 25, 2014).
ERS. 2013a. Food expenditure series. http://ers.usda.gov/data-products/food-expenditures.aspx#.U71xNLEYePM (accessed November 25, 2014).
ERS. 2013b. Foreign agricultural trade of the United States (FATUS): Value of U.S. agricultural trade, by calendar year. http://www.ers.usda.gov/data-products/foreign-agriculturaltrade-of-the-united-states-%28fatus%29/calendar-year.aspx#26444 (accessed November 7, 2014).
ERS. 2014a. Ag and food sectors and the economy. http://www.ers.usda.gov/data-products/agand-food-statistics-charting-the-essentials/ag-and-food-sectors-and-the-economy.aspx#.VD1ZXRawSAo (accessed November 25, 2014).
ERS. 2014b. Food dollar series. http://www.ers.usda.gov/data-products/food-dollar-series/documentation.aspx (accessed November 25, 2014).
ERS. 2014c. Indicator table. March 14. http://www.ers.usda.gov/amber-waves/2014-march/indicator-table.aspx#.VFjoypV0y71 (accessed November 4, 2014).
ERS. 2014d. Manufacturing. http://www.ers.usda.gov/topics/food-markets-prices/processingmarketing/manufacturing.aspx#.Uvowa_vwv3t (accessed November 24, 2014).
ERS. 2014e. Organic market overview. http://www.ers.usda.gov/topics/natural-resourcesenvironment/organic-agriculture/organic-market-overview.aspx (accessed November 25, 2014).
ERS. 2014f. Retail trends. http://www.ers.usda.gov/topics/food-markets-prices/retailingwholesaling/retail-trends.aspx#.Uu1RPCg7rj (accessed November 24, 2014).
FAO (Food and Agriculture Organization of the United Nations). 2014. Biotechnology and food security fact sheet. http://www.fao.org/worldfoodsummit/english/fsheets/biotech.pdf (accessed May 15, 2014).
FCWA (Food Chain Workers Alliance). 2012. The hands that feed us: Challenges and opportunities for workers along the food chain. http://foodchainworkers.org/wp-content/uploads/2012/06/Hands-That-Feed-Us-Report.pdf (accessed November 25, 2014).
FDA (U.S. Food and Drug Administration). 2007. Redbook 2000. Guidance for industry and other stakeholders. Toxicological principles for the safety assessment of food ingredients. http://www.fda.gov/Food/GuidanceRegulation/GuidanceDocumentsRegulatoryInformation/IngredientsAdditivesGRASPackaging/ucm2006826.htm#TOC (accessed November 24, 2014).
Fernandez-Cornejo, J., S. Wechsler, M. Livingston, and L. Mitchell. 2014. Genetically engineered crops in the United States. Economic Research Report Number 162. Washington, DC: Economic Research Service.
Fidelibus, M. W. 2014. Grapevine cultivars, trellis systems, and mechanization of the California Raisin Industry. Journal of HortTechnology 24(3):285-289.
Findeis, J. L., A. M. Vandeman, J. M. Larson, and J. L. Runyan. 2002. The dynamics of hired farm labor: Constraints and community responses. New York: CABI Publishing.
Flake, O., A. Jerardo, and D. Torgerson. 2013. Outlook for U.S. agricultural trade: August 2013. Washington, DC: U.S. Department of Agriculture, Economic Research Service and Foreign Agricultural Service.
FNS (Food and Nutrition Service). 2014. Summary of annual data, FY 2009-2013. http://www.fns.usda.gov/pd/overview (accessed November 25, 2014).
Food Institute. 2014. The Food Institute report. http://www.foodinstitute.com (accessed November 25, 2014).
Friedland, W., A. Barton, and R. Thomas. 1981. Manufacturing green gold: Capital, labor, and technology in the lettuce industry. Cambridge, UK: Cambridge University Press.
Fryer, C. D., and R. B. Ervin. 2013. Caloric intake from fast food among adults: United States, 2007-2010. National Center for Health Statistics Data Brief (114):1-8.
Fuglie, K., P. Heisey, J. King, and D. Schimmelfennig. 2012. Rising concentration in agricultural input industries influences new farm technologies. Amber Waves 10(4):1-6.
Garcia, M. A., and M. A. Altieri. 2005. Transgenic crops: Implications for biodiversity and sustainable agriculture. Bulletin of Science, Technology & Society 25(4):335-353.
Gardner, B. L. 2000. Economic growth and low incomes in agriculture. American Journal of Agricultural Economics 82(5):1059-1074.
Gardner, B. L. 2002. American agriculture in the twentieth century: How it flourished and what it cost. Cambridge, MA: Harvard University Press.
Golden, S. D., and J. A. Earp. 2012. Social ecological approaches to individuals and their contexts: Twenty years of health education & behavior health promotion interventions. Journal of Health Education and Behavior 39(3):364-372.
Gurian-Sherman, D. 2009. Failure to yield. Evaluating the performance of genetically engineered crops. Cambridge, MA: Union of Concerned Scientists.
Hendrickson, M., and W. Heffernan. 2007. Concentration of agricultural markets. Report prepared for National Farmers Union. http://www.nfu.org/media-galleries/document-library/heffernan-report/2007-Heffernan-Report (accessed November 25, 2014).
Holmes, T. 2010. The economic roots of Reaganism: Corporate conservatives, political economy, and the United Farm Workers movement, 1965-1970. The Western Historical Quarterly 41(1):55-80.
Hoppe, R. A., and D. E. Banker. 2010. Structure and finances of U.S. farms. EIB-66. Washington, DC: U.S. Department of Agriculture, Economic Research Service.
Hoppe, R. A., and J. MacDonald. 2013. Updating the ERS farm typology. Economic Information Bulletin No. 110. Washington, DC: U.S. Department of Agriculture, Economic Research Service.
Howard, P. H. 2009. Visualizing consolidation in the global seed industry: 1996-2008. Sustainability 1(4):1266-1287.
Howard, P. H. 2014. Seed industry structure. https://www.msu.edu/~howardp/seedindustry.html (accessed November 25, 2014).
IOM (Institute of Medicine). 2006. Food marketing to children and youth: Threat or opportunity? Washington, DC: The National Academies Press.
IPCC (Intergovernmental Panel on Climate Change). 2014. Climate change 2014. Mitigation of climate change. New York: Cambridge University Press. http://www.ipcc.ch/report/ar5/wg3 (accessed November 24, 2014).
IRI (Information Resources, Inc.). 2013. Private label and national brands: Paving the path to growth together. https://foodinstitute.com/images/media/iri/TTDec2013.pdf (accessed November 24, 2014).
Jakle, J. A., and K. A. Sculle. 1999. Fast food: Roadside restaurants in the automobile age. Baltimore, MD: Johns Hopkins University Press.
James, C. 2012. Global status of commercialized biotech/GM Crops. ISAAA Brief No. 44. Ithaca, NY: International Service for the Acquisition of Agri-Biotech Applications.
Josling, T., S. Tangermann, and T. K. Warley. 1996. Agriculture in the GATT. New York: St. Martin’s Press.
Key, N. D., and W. McBride. 2007. The changing economics of U.S. hog production. Washington, DC: U.S. Department of Agriculture, Economic Research Service.
King, R. P., M. Anderson, G. DiGiacomo, D. Mulla, and D. Wallinga. 2012. State level food system indicators, August 2012. http://foodindustrycenter.umn.edu/Research/foodsystemindicators/index.htm (accessed November 24, 2014).
Kinsey, J. D. 2001. The new food economy: Consumers, farms, pharms, and science. American Journal of Agricultural Economics 83(5):1113-1130.
Kinsey, J. 2013. Expectations and realities of the food system. In U.S. programs affecting food and agricultural marketing, edited by W. J. Armbruster and R. Knutson. New York: Springer Science + Business Media. Pp. 11-42.
Liberty Beacon Staff. 2013. Genetically modified foods pose huge health risk. The Liberty Beacon, May 9, 2013. http://www.thelibertybeacon.com/2013/05/09/genetically-modified-foods-pose-huge-health-risk (accessed October 10, 2014).
Lin, B.-H., and J. Guthrie. 2012. Nutritional quality of food prepared at home and away from home, 1977-2008. Economic Information Bulletin, No. 105. Washington, DC: U.S. Department of Agriculture, Economic Research Service.
Lobao, L., and K. Meyer. 2001. The great agricultural transition: Crisis, change, and social consequences of twentieth century US farming. Annual Review of Sociology 27:103-124.
MacDonald, J. M., and W. D. McBride. 2009. The transformation of U.S. livestock agriculture. Scale, efficiency and risks. Economic Information Bulletin, No. 43. Washington, DC: U.S. Department of Agriculture, Economic Research Service.
Martin, P. 2009. Importing poverty: Immigration and the changing face of rural America. New Haven, CT: Yale University Press.
Martin, P. 2013. Immigration and farm labor: Policy options and consequences. American Journal of Agricultural Economics 95(2):470-475. http://ajae.oxfordjournals.org/content/95/2/470.full (accessed November 24, 2014).
Martin, P., and D. Jackson-Smith. 2013. An overview of farm labor in the United States. Rural Connections 8(1):21-24. http://wrdc.usu.edu/files/publications/publication/pub_2846540.pdf (accessed November 24, 2014).
Mintz, S. W., and C. M. Du Bois. 2002. The anthropology of food and eating. Annual Review of Anthropology 31:99-119.
NASS (National Agricultural Statistics Service). 2014a. Farm labor. http://usda.mannlib.cornell.edu/MannUsda/viewDocumentInfo.do?documentID=1063 (accessed November 25, 2014).
NASS. 2014b. Quick stats. http://quickstats.nass.usda.gov (accessed November 25, 2014).
NRC (National Research Council). 2000. Genetically modified pest-protected plants: Science and regulation. Washington, DC: National Academy Press.
NRC. 2002. Environmental effects of transgenic plants: The scope and adequacy of regulation. Washington, DC: The National Academies Press.
NRC. 2010. Toward sustainable agricultural systems in the 21st century. Washington, DC: The National Academies Press.
NRC and IOM. 2004. Safety of genetically engineered food: Approaches to assessing unintended health effects. Washington, DC: The National Academies Press.
Oskam, A., G. Backus, J. Kinsey, and L. Frewer. 2010. The new food economy. In E.U. policy for agriculture, food and rural area. Wageningen, The Netherlands: Wageningen Academic Publishers. Pp. 297-306.
Pardey, P. G., J. M. Alston, and C. Chan-Kang. 2013. Public food and agricultural research in the United States: The rise and decline of public investments, and policies for renewal. Washington, DC: AGree.
Pasour, E.C., Jr., and R. R. Rucker. 2005. Plowshares and pork barrels: The political economy of agriculture. Oakland, CA: The Independent Institute.
Pfeffer, M. J. 1983. Social origins of three systems of farm production in the United States. Rural Sociology 48:540-562.
Portnoy, S. 2013. The U.S. role in a global food system—an agribusiness perspective. Presentation to IOM Committee on a Framework for Assessing the Health, Environmental, and Social Effects of the Food System. Washington, DC, September 16.
Raney, T., and P. Pingali. 2007. Sowing a gene revolution. Scientific American 297(3):104-111. Reinhardt, N., and P. Barlett. 1989. The persistence of family farms in the United States. Sociologia Ruralis 29(3/4):203-225.
Rosenbaum, D. 2013. SNAP is effective and efficient. Washington, DC: Center on Budget and Policy Priorities.
Runge, C. F., and B. Senauer. 2007. How biofuels could starve the poor. Foreign Affairs 86(3):41.
Schlosser, E. 2001. Fast food nation: The dark side of the all-American meal. Boston, MA: Houghton Mifflin.
Schnepf, R. 2013. Farm-to-food price dynamics. Congressional Research Service Report R40621. Washington, DC: Congressional Research Service.
Senauer, B., and L. Venturini. 2005. The globalization of food systems: A concept framework and empirical patterns. In Food agriculture and the environment, edited by E. Defrancesco, L. Galletto, and M. Thiene. Milan, Italy: FrancoAngeli. Pp. 197-224.
Sexton, R. J. 2013. Market power, misconceptions, and modern agricultural markets. American Journal of Agricultural Economics 95(2):209-219.
Sinclair, U. 1906. The jungle. New York: Doubleday, Page & Co.
St. Leger, L. 2001. Schools, health literacy and public health: Possibilities and challenges. Health Promotion International 16(2):197-205.
U.S. Census Bureau. 2014a. Census of population and housing. http://www.census.gov/prod/www/decennial.html (accessed November 25, 2014).
U.S. Census Bureau. 2014b. Fast facts. http://www.census.gov/history/www/through_the_decades/fast_facts (accessed November 25, 2014).
USDA (U.S. Department of Agriculture). 2003. National range and pasture handbook. Revision 1. Washington, DC: U.S. Department of Agriculture, Natural Resources Conservation Service.
USDA. 2009. 2007 Census volume 1, chapter 1: U.S. national level data. Table 1. http://www.agcensus.usda.gov/Publications/2007/Full_Report/Volume_1,_Chapter_1_US (accessed February 10, 2014).
USDA. 2012. Historical Census publications. http://www.agcensus.usda.gov/Publications/Historical_Publications/index.php (accessed December 16, 2014).
USDA. 2014. 2012 Census of agriculture. United States. http://www.agcensus.usda.gov/Publications/2012 (accessed November 25, 2014).
USDA and HHS (U.S. Department of Health and Human Services). 2010. Dietary guidelines for Americans, 2010. Washington, DC: USDA and HHS.
USDOJ (U.S. Department of Justice). 2012. Competition and agriculture: Voices from the workshops on agriculture and antitrust enforcement in our 21st century economy and thoughts on the way forward. http://www.justice.gov/atr/public/reports/283291.pdf (accessed October 27, 2014).
Vermeulen, S. J., B. M. Campbell, and J. S. I. Ingram. 2012. Climate change and food systems. Annual Review of Environment and Resources 37:195-222.
Ward, C. E., and T. C. Schroeder. 1994. Packer concentration and captive supplies. http://cals.arizona.edu/arec/wemc/cattlemarket/PckrConc.pdf (accessed December 16, 2014).
Wiebe, K. D. 2003. Linking land quality, agricultural productivity, and food security. Washington, DC: U.S. Department of Agriculture, Economic Research Service.


