
Health Effects of the U.S. Food System
This chapter describes health effects that are associated with the food system. It does not attempt to be comprehensive; rather, it reviews some of the most salient health effects affecting the U.S. population, their prevalence, and some potential causes. Important health effects resulting from exposure of the general population to environmental pollutants that are associated with food and agricultural operations also are included. Additionally, health effects of agriculture and food workers that are independent of food consumption are described in Chapter 5, where other health effects for this particular population are presented. Although the chapter focuses on health effects as primary outcomes, it also emphasizes that health effects are rarely independent of social and environmental effects; examples of trade-offs, interactions, and other complexities that are inherent in the current food system are briefly mentioned. Finally, the chapter points to important challenges encountered when measuring health outcomes and establishing associations with the food system. A list of selected data, metrics, and methodologies to measure health effects are in Tables B-1 through B-4 in Appendix B. The committee did not attempt to estimate non-market economic values for health effects.
THE FOOD SYSTEM AND HEALTH EFFECTS
The federal government invests resources to achieve certain public health goals. It monitors dietary patterns, nutrient intakes, and nutrition status indicators to promote human health and to prevent chronic disease.
It also encourages individuals to consume diets that promote health and prevent chronic disease by funding nutrition research and disseminating evidence-based nutrition information and guidelines, including the Dietary Guidelines for Americans (DGA) (USDA and HHS, 2010a) and the Dietary Reference Intakes (DRIs)1 (IOM, 2014). Federal government resources also are invested in understanding acute disease associated with microbial or chemical foodborne illness. Regulations, warnings, and recommendations are issued to reduce the risks of foodborne illness and to protect the public’s health.
Dietary practices in the United States are driven in part by consumer demands and preferences, influenced by culture, cost, taste, and convenience, and influenced by industry advertising and marketing practices (Hawkes, 2009; Popkin, 2011; Stuckler and Nestle, 2012). As Chapter 5 describes, the most profitable food production sectors are snack food producers, as opposed to producers of healthier alternatives. The unbalanced promotion of fewer nutritious products and their lower cost can influence dietary practices negatively (see below, e.g., on the association between marketing to children and obesity). Other drivers, such as policies, technology, and market forces, indirectly affect dietary practices by influencing food cost, preference formation, or accessibility (see Chapter 2). Market forces, including consumer demand, do not always support dietary practices that are consistent with public health nutrition recommendations, such as the DGA, and their associated public health goals (e.g., reducing chronic disease risk and micronutrient deficiencies). For example, current consumption of fruits and vegetables is well below recommended levels.
In some cases, interventions have been implemented to change food consumption patterns or alter the composition of consumed foods to achieve public health goals (see Box 3-1). These interventions include nutrient fortification regulations when common dietary practices fail to provide an adequate level of intake of a particular nutrient, and food assistance and nutrition-education programs that promote healthy diet planning and food preparation practices. In the absence of federal action, local governments have proposed policies to improve dietary practices by banning trans fats
_____________
1 DRIs are nutrient intake standards for healthy individuals. The Estimated Average Requirement (EAR) is the average daily nutrient intake level estimated to meet the requirement of half of the healthy individuals in a particular life stage and gender group; the Recommended Dietary Allowance is the average daily nutrient intake level sufficient to meet the nutrient requirement of about 97-98 percent of the population in a particular life stage and gender group; the Upper Level is the highest level of daily nutrient intake for which there are no adverse health consequences in the population; and an Adequate Intake is established when insufficient data are available to establish an EAR, and it is based on observed or experimentally determined approximations of nutrient intake by a group of healthy people that are assumed to be adequate.
(Assaf, 2014), requiring menu labeling (Rutkow et al., 2008), or taxing or limiting the size of sugar-sweetened beverages (Mariner and Annas, 2013). Likewise, the federal government regulates food safety. Food safety is not considered a competitive advantage by the food industry in the United States. Thus, significant food safety advances are pioneered by industry as a whole and shared and adopted among companies.
Sometimes public health problems generated by market forces are not so easily corrected. This can occur when the relationships among causes and effects are not clear and therefore solutions are not easily identified. In other cases, potential interventions to promote health, such as proposed taxes on sugar-sweetened beverages or bans on advertising of low-nutrient foods on children’s television programs, are rejected because the social, economic, or environmental impacts are not viewed favorably by key actors. In still other cases, feedback loops can reinforce a negative attribute of the food system. For example, the U.S. food system provides many low-cost, calorie-dense foods, which leads to an abundance of calories in the food supply but also to an increased likelihood of excessive calorie consumption, overweight, and obesity (Hawkes, 2009). This excessive consumption might be perceived as a need for higher production. At the same time, policies that subsidize a narrow number of commodities can increase calories in the food system at the expense of dietary diversity, leading to lower micronutrient intakes (Pingali, 2012).
Total alignment between market forces and public health goals for the general population, in fact, may not be possible. Population heterogeneity, including genetic, ethnic, life stage, and cultural groups, results in differing food preferences and needs among individuals within a population. Therefore, solutions increasingly may require targeted interventions and recommendations. Salient examples include susceptibility of individuals to food allergens or genetic and life-stage differences that affect nutrient requirements (Solis et al., 2008; Stover, 2006) (see folic acid fortification as an example below). Sometimes, consumer food preferences are not aligned with public health goals. For example, some groups within the population may have food beliefs that promote risky behavior, such as the consumption of raw milk despite the increased risk of foodborne illness. Unpasteurized dairy products were found to be 150 times more likely to cause illness than were pasteurized products based on the total volume of products sold in the U.S. marketplace (Langer et al., 2012). Cost, convenience, or taste can lead to dietary patterns that do not support public health goals (see also Chapter 5).
Trade-offs occur when a particular food source simultaneously promotes health (e.g., fish, which contains healthful omega-3 fatty acids) but carries health risks (e.g., fish also may contain harmful levels of methylmercury) (IOM, 2006b). Trade-offs also occur when beneficial public health
BOX 3-1
Examples of Public Health Interventions
Policies
- U.S. Department of Agriculture (USDA) nutrition assistance programs (e.g., Special Supplemental Nutrition Program for Women, Infants, and Children [WIC]; Supplemental Nutrition Assistance Program [SNAP]; the Food Emergency Program; National School Lunch Program; National School Breakfast Program)
- Food and Drug Administration (FDA) regulations requiring nutrient fortification of certain products
- USDA Pathogen Reduction and Hazard Analysis and Critical Control Points (HACCP) systems regulations, which requires meat and poultry processing plants to have safety plans to prevent contamination
- Food Safety Modernization Act, which mandates FDA to write policy to improve food safety management
- FDA Food Allergen Labeling and Consumer Protection Act, which informs consumers about allergens in foods
- FDA Food Code, a model of food safety regulations that state and local governments can adopt for the food retail and service industries
- FDA guidance with recommendations on the use of antimicrobials in foods (an attempt to voluntarily scale back the use of antibiotics in livestock) (FDA, 2013)
- FDA Nutrition Labeling and Education Act, which provides for the Nutrition Facts label to inform consumers about the nutrient content of packaged food products
- Competitive school foods rules as part of the Healthy, Hunger-Free Kids Act of 2010 (Public Law 111-296)
outcomes come at the expense of beneficial social, economic, or environmental outcomes. For example, meeting dietary omega-3 recommendations by consuming ocean fish has the potential to deplete fish stocks, a detrimental environmental outcome (Venegas-Caleron et al., 2010). Greenhouse gas emissions are similarly influenced by the architecture of the food system, including the balance between vegetable production and animal protein production (Macdiarmid et al., 2012). Achieving human health outcomes and reducing hunger may encourage labor and immigration policies that help maintain low food prices, which can be beneficial for the general population but carries social and economic inequalities. In other cases, social effects can create negative feedback loops across the dimensions of the food system, magnifying social and economic inequities, which in turn lead to health inequities. For example, some neighborhoods are character-
Voluntary Programs
- Industry-driven food safety initiatives (e.g., Global Food Safety Initiative, HACCP implementation before regulatory requirements, environmental monitoring for Listeria monocytogenes and other emerging pathogens)
- Food Allergy Research and Resource Program (industry-supported research and education)
Education Efforts
- Nutritional information on the front of the product package to inform consumers about salient benefits of the products
- Educational campaigns, such as the White House’s Let’s Move, which aims at improving the health of children and has nutrition as one of its core components
- Food safety education to consumers, such as the website foodsafety.com, established by the Centers for Disease Control and Prevention, FDA, and USDA
- Trade association food safety education on Listeria environmental monitoring and controls
- Nutrition education provided by USDA on the Dietary Guidelines for Americans (e.g., ChooseMyPlate.gov)
- State nutrition education standards, benchmarks, or expectations
- SNAP-Ed, administered by USDA with the goal of improving the food decisions of persons eligible for the SNAP program
ized by blight, crime, and disorder that can impede access to goods and services, including healthy food. The resulting negative health consequences of poor dietary practices may reinforce poverty and disadvantage among the affected populations (Bader et al., 2010).
Food system interventions are more likely to succeed if they are informed by an understanding of the intrinsic dynamics associated with public health, environmental, and social and economic outcomes, and an appreciation that their interactions are nonlinear and not always readily predicted. Maintaining alignment of the beneficial effects in all of these domains of the food system requires ongoing monitoring and evaluation of important health, environmental, social, and economic indicators, and implementation of interventions at key leverage points in the system that correct misalignments and limit the impact of trade-offs.
POTENTIAL SPECIFIC HEALTH EFFECTS OF THE FOOD SYSTEM
In the United States and in most Western countries, poor dietary patterns make the greatest contribution to the burden of noncommunicable disease (see Figure 3-1) (IHME, 2013).
The primary diet-related risks to disease of the current food system are related to food overconsumption, and contribute to the etiology of several leading causes of mortality and morbidity, including cardiovascular disease (CVD), type 2 diabetes, cancer, and osteoporosis (CDC, 2013b). Nutrient deficiencies and foodborne illness also contribute to diet-related disease.
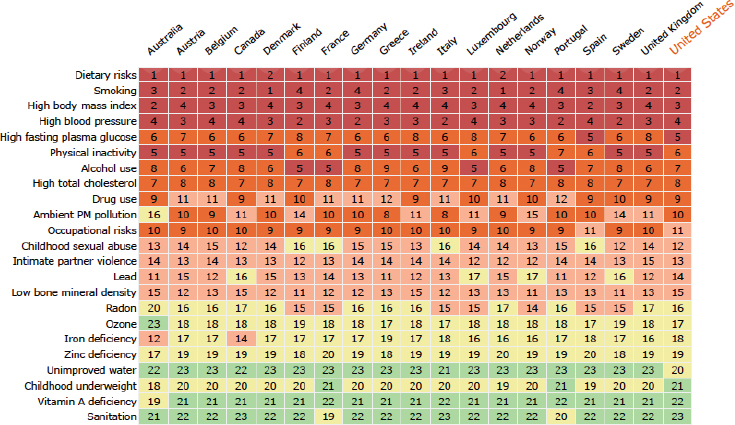
FIGURE 3-1 Heat map of the top risk factors that contribute to the burden of noncommunicable diseases in Western countries. The major dietary risks are low consumption of fruit, nuts, seeds, vegetables, and whole grains and elevated intakes of sodium, fat, processed meats, and trans fats. The colors and numbers designate the ranking based on number of risk factors, with red representing countries with a higher number of risk factors for a particular disease and therefore higher in the rank. A breakdown of dietary risks can be found at http://vizhub.healthdata.org/gbd-compare (accessed January 8, 2015).
NOTE: PM = particulate matter.
SOURCE: IHME, 2013. Reprinted with permission from the Institute for Health Metrics and Evaluation.
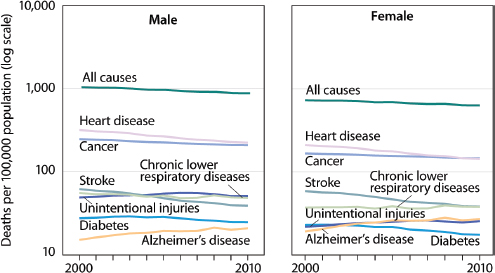
FIGURE 3-2 Age-adjusted death rates for selected causes of death for all ages, by gender: United States, 2000-2010.
NOTE: Cause of death is coded according to the 10th revision of the International Statistical Classification of Diseases and Related Health Problems.
SOURCE: CDC/NCHS, 2014a.
Figure 3-2 presents age-adjusted death rates for several chronic diseases2 in the United States between 2000 and 2010 (CDC/NCHS, 2014a).
These diseases, together with their risk factors, including obesity, hypertension, and hypercholesterolemia, account for significant medical and productivity costs, and they exact a heavy toll on quality of life in the United States. The Centers for Disease Control and Prevention (CDC) estimates that 75 percent of our health care dollars are used to treat preventable chronic diseases and conditions. One estimate of the burden of cardiovascular disease in the United States is more than $300 billion each year, including the cost of health care services, medications, and lost productivity (Go et al., 2014). In 2012, the total burden of diabetes types 1 and 2 was estimated to be $245 billion, including hospital inpatient care, medications, and loss of productivity (ADA, 2013). In 2008, it was esti-
_____________
2 Chronic disease, as defined by the U.S. National Center for Health Statistics, is a disease lasting 3 months or longer. About one-fourth of people with chronic conditions have one or more daily activity limitations, often understood as a hindrance or an inability to perform major activities in one’s life.
mated that obesity cost the U.S. health care system around $147 billion (or 9.1 percent of annual medical spending) for treatment of obesity-related disorders, such as type 2 diabetes (Finkelstein et al., 2009).
A discussion of five broad categories of health outcomes of the food system follows, including (1) obesity; (2) chronic diseases (e.g., hypertension, CVD, and type 2 diabetes); (3) micronutrient deficiencies; (4) microbiological foodborne illness; and (5) chemical foodborne illness.
Obesity
The dynamics of the U.S. food system have created an abundant food supply, which has reduced hunger but also plays an important role in our current obesity epidemic. Obesity is classified as a disease by the American Medical Association, and it is also a risk factor for other common chronic diseases, such as CVD, type 2 diabetes, certain cancers, osteoarthritis, liver and gall bladder disease, and others (Dagenais et al., 2005; IOM, 2005; Malnick and Knobler, 2006). Obesity results from complex interactions among behavioral, genetic, and environmental factors (i.e., environments for physical activity, food and beverage, health care, work, and school) that influence what we eat throughout life. Ultimately, obesity is the result of habitually consuming more energy than is expended and the development of excess adipose tissue.
The National Health and Nutrition Examination Survey (NHANES; see section Methodologies to Measure Health Outcomes p. 109 and also Appendix B, Table B-3) tracks U.S. civilians in terms of health status and self-reported dietary intake. Data from NHANES show that in the period 2011-2012, 35.1 percent of U.S. adults were considered obese (body mass index [BMI] ≥30), while an additional 33.9 percent were considered overweight (BMI ≥25) (Fryar et al., 2014). The total prevalence of obesity among adults age 20 and older steadily increased from 1960-1962 to 2011-2012, from 10.7 to 33.9 percent for men and 15.8 to 36.6 percent for women (Fryar et al., 2014) (see Figure 3-3).
In 2009-2010, about 18 percent of children older than age 5 had obesity, a significant increase since 1976-1980, when the prevalence was about 5 percent (Fryar et al., 2012). Recent data from the Institute for Health Metrics and Evaluation (http://vizhub.healthdata.org/obesity [accessed January 8, 2015]) show that overweight and obesity among youth ages 10 to 14 in 2013 was 38 percent, and 18 percent in children ages 1 to 4 (see Figure 3-4), suggesting a flattening of the obesity rate for children. A recent article documented that this flattening of obesity growth is true for high-income categories but masks continued growth in obesity rates in lower income groups (Frederick et al., 2014).
Obesity prevalence varies by population and disproportionately affects
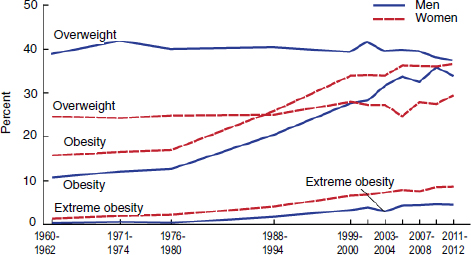
FIGURE 3-3 Trends in adult overweight, obesity, and extreme obesity among men and women ages 20-74: United States, selected years 1960-1962 through 2011-2012.
NOTES: Age-adjusted by the direct method to the year 2000 U.S. Census Bureau estimates using age groups 20-39, 40-59, and 60-74. Pregnant females were excluded. Overweight is body mass index (BMI) of 25 or greater but less than 30; obesity is BMI greater than or equal to 30; and extreme obesity is BMI greater than or equal to 40.
SOURCE: Fryar et al., 2014, with data from Centers for Disease Control and Prevention/National Center for Health Statistics, National Health Examination Survey 1960-1962; and National Health and Nutrition Examination Surveys 1971-1974, 1976-1980, 1988-1994, 1999-2000, 2001-2002, 2003-2004, 2005-2006, 2007-2008, 2009-2010, and 2011-2012.
certain race, ethnicity, and income groups. CDC reports that 49.5 percent of non-Hispanic blacks, 39.1 percent of Hispanics, and 34.3 percent of non-Hispanic whites had obesity (Flegal et al., 2012). From 2005 to 2008, the prevalence of obesity was 42 percent among women below the federal poverty level, compared to 32.9 percent among women above 130 percent of the poverty level.
Obesity: A Complex Etiology
The reasons for the marked increase in the rates of obesity in the U.S. population are complex and due to the interaction of many factors. Some evidence suggests that specific genes convey a higher risk for obesity if expressed (den Hoed et al., 2010; Dina et al., 2007; Frayling et al., 2007).
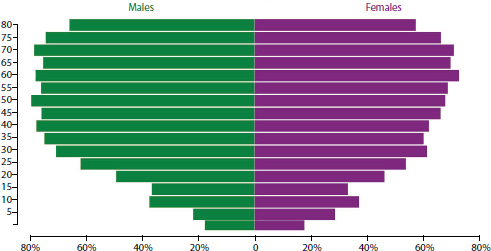
FIGURE 3-4 Percentage overweight and obesity (x-axis, body mass index greater than or equal to 25) by age (y-axis) and gender in the United States, 2013.
SOURCES: IHME, 2014; Ng et al., 2014. Reprinted with permission from the Institute for Health Metrics and Evaluation.
Leibel (2008) has argued that these genes act primarily on the central nervous system and affect both the conscious and the unconscious aspects of food intake and energy expenditure. He then postulated that no regulatory gene acting alone or with others can explain the risk of becoming obese, in part because its expression depends so much on the interaction with other genes as well as with the food environment. Although it is virtually impossible that a major genetic change has occurred in the U.S. population in the past 30 to 40 years, genes can sensitize individuals to obesity in obesity-promoting (obesogenic) environments. Therefore much attention has been given to the food environment in an effort to understand the dramatic rise in obesity.
Westerterp and Speakman (2008) have argued that Americans have not become less active during the period when obesity was rising at a rapid rate, but others have found otherwise (Archer et al., 2013; Church et al., 2011). There is no consensus at this time regarding the individual quantitative contributions of diet and physical activity to obesity in populations. Increases in the obesity rate in the United States since the 1980s, however, have coincided with substantial changes in the availability of food, food consumption, and the food environment. These changes, in turn, are driven by an evolution in technology, agricultural policies, marketing, and consumer life styles. The calories (not corrected for losses in processing and
waste) available in the U.S. food supply remained relatively constant at about 3,300 calories per day from the early 1900s until the early 1980s. Available calories then rose to about 3,900 calories per day by the year 2000 (see Figure 3-5).
Researchers have suggested a number of potential pathways by which increased calorie levels in the food supply have translated into rising obesity rates. For example, individual studies and systematic analysis have found strong associations between eating an excess amount of sugar and weight gain (de Ruyter et al., 2012; Ebbeling et al., 2012; Malik et al., 2013; Perez-Morales et al., 2013; USDA and HHS, 2010b). In addition, the U.S.
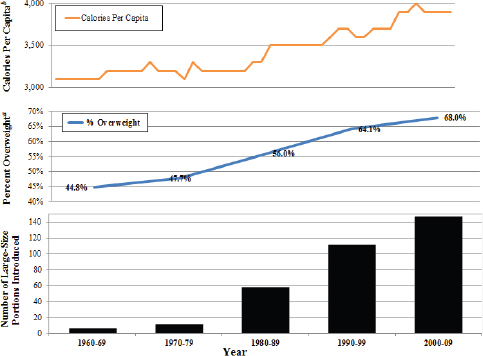
FIGURE 3-5 Available calories per capita per day, overweight, and number of large size portions introduced.
NOTES: The line for overweight includes both the percentage of overweight and obesity. Not corrected for losses in processing and waste.
a U.S. adults ages 20 years and above with BMI >25.
b Data from USDA food availability series.
SOURCE: Nestle and Nesheim, 2012. Reprinted with permission from the University of California Press.
Department of Agriculture’s (USDA’s) Economic Research Service has found evidence that eating one meal away from home each week, a growing trend, translates to an annual weight gain of 2 extra pounds each year, or 134 calories/day (Todd et al., 2010). Others have hypothesized that the trend to consume foods away from home, combined with the increases in portion sizes in food eaten away from home (Young and Nestle, 2007), is a potential reason for the parallel increase in average weight of the U.S. population.
A number of studies have explored how increased portion size increases caloric intake and food waste. In one study, participants consumed 30 percent more energy at lunch when offered the largest portion of food than when offered the smallest portion. This response to the variations in portion size was the same, regardless of who determined the amount of food on the plate, investigators or the subject (Rolls et al., 2002). Another study found that moviegoers ate more popcorn if randomly given a large container than a smaller one, even those subjects who reported not liking the popcorn (Wansink and Park, 2001). Further evidence of the influence of portion sizes on intake was found in a study of self-refilling soup bowls, in which participants unknowingly eating from self-refilling soup bowls ate 73 percent more soup than did those eating from normal bowls. The study authors suggest that, without visual cues, people are less able to self-monitor their intake (Wansink et al., 2005).
Price and preference formation also play an important role in household food purchasing, and thus in food consumption. Wilde et al. (2012) examined the relationship of food prices and the obesity epidemic and found support for the “food price hypothesis,” which postulates that low prices of energy-dense foods relative to the price of less energy-dense foods leads to a higher risk of obesity. Evidence also suggests that marketing strategies to children contribute to an increased consumption of calorie-dense food. Based on evidence about industry’s practices, mainly television advertising, and a systematic review of the relationship between those practices and health, the Institute of Medicine (IOM) report Food Marketing to Children and Youth: Threat or Opportunity? concluded that food and beverage marketing practices to children and youth are out of balance with healthful diets and contribute to food environments that put their health at risk (IOM, 2006a). Chandon and Wansink (2012) have proposed that food marketing has contributed to obesity by increasing the accessibility of bigger portions of inexpensive and calorie-dense food. They proposed that food marketers could continue to maintain profits by offering healthy foods to the consumer by altering marketing strategies. The evidence to support linkages among other aspects of food system dynamics and obesity is less clear. For example, the association between access to supermarkets and obesity is not entirely clear (Wilde et al., 2012).
Because of the complex etiology of obesity—that is, obesity is affected
by many elements of the food system as well as other causes—reversing the rise in obesity in the United States does not have a simple solution. Several IOM reports that have analyzed the literature on evidence for contributors to obesity recommend a variety of strategies to make progress in obesity prevention, highlighting actions within the food and beverage environment as one salient strategy (IOM, 2005, 2012). One of these reports, Accelerating Progress in Obesity Prevention: Solving the Weight of the Nation (IOM, 2012), recommended a set of goals to deal with the rising prevalence of obesity in this country. These include interventions such as making physical activity a routine part of life, creating food and beverage environments in which healthy food and beverage options are the routine easy choice, and transforming messages about physical activity and nutrition, among others. These measures would have profound effects on the food system, the physical environment, and the socioeconomic aspects of life in the United States if they were fully implemented. The discourse about solutions is often dominated by arguments about choice, reflecting the often-contentious social and political environment surrounding food.
Chronic Diseases
Evidence supporting the relationships among diet and risk of chronic diseases has been graded and summarized in numerous reports and data resources (e.g., USDA’s Nutrition Evidence Library [NEL, 2014a], World Cancer Research Fund/American Institute for Cancer Research Diet and Cancer Report [WCRF/AICR, 2007], American College of Cardiology and American Heart Association [Eckel et al., 2014; Jensen et al., 2014]). The conclusions presented here are from USDA’s Nutrition Evidence Library, which grades the strength of evidence supporting an association among diet and health or disease as “strong” or “moderate” or “limited.”
For CVD, strong and consistent evidence demonstrates that dietary patterns rich in fruits, vegetables, whole grains, nuts, legumes, low-fat dairy, fish, and unsaturated oils, and low in red and processed meat, saturated fat, sodium, and sugar-sweetened foods and drinks, are associated with decreased risk of fatal and nonfatal CVD (USDA, 2014). Consistent evidence also shows that vegetable and fruit intakes are inversely related to the incidence of myocardial infarction and stroke, with significantly larger positive effects when intakes are greater than five servings per day. Moderate evidence suggests that the intake of milk products and whole grains is inversely associated with CVD and that consumption of two servings per week of seafood containing omega-3 fatty acids is associated with lower cardiovascular mortality (NEL, 2014a).
Hypertension is a major risk factor for CVD and a condition that affects 29.1 percent of U.S. adults age 18 and older (Nwankwo et al.,
2013). Strong evidence among adults, and moderate evidence among children from birth to age 18, indicates that higher sodium intakes are associated with increased blood pressure. Conversely, considerable evidence shows that higher potassium intakes are associated with decreased blood pressure. Increased intakes of low-fat milk products and vegetable protein also are linked to lower blood pressure.
Strong evidence demonstrates that body fatness increases the risk of several cancers, including esophageal, pancreatic, colorectal, post-menopausal breast, endometrial, and renal. In addition, convincing evidence supports an increased risk of colorectal cancer with red and processed meat intakes and of liver cancer with aflatoxin intakes. Evidence also suggests that diets rich in dietary fiber, non-starchy vegetables, and fruits are protective for a number of cancers (NEL, 2014a).
Diet is a factor in type 2 diabetes, a major chronic disease that also is an independent risk factor for CVD. Strong evidence demonstrates that saturated fatty acid intakes are associated with increased insulin resistance and risk of type 2 diabetes, and that a substitution of just 5 percent of saturated fats with monounsaturated fatty acids or polyunsaturated fatty acids can improve insulin response. Furthermore, strong evidence shows that an improved lipid profile can be achieved with the substitution of monounsaturated or polyunsaturated fatty acids for saturated fatty acids. Moderate evidence indicates that milk and milk products are associated with a lower incidence of type 2 diabetes (NEL, 2014a). Limited evidence suggests that whole grain intakes also are associated with a reduced incidence of type 2 diabetes (NEL, 2014a).
Some races and ethnic populations and the poor are more likely to have chronic diseases, some of them related to food intake (Price et al., 2013). Type 2 diabetes risk varies by race and ethnicity and is more prevalent in non-Hispanic African Americans (19.0/100,000) than in Hispanic Americans (6.9 and 4.8/100,000 in males and females, respectively) and non-Hispanic whites (3.7/100,000). The disparities are likely related to multiple factors, including access to health insurance, poverty, food insecurity, and availability of healthy and affordable food. In 2013, CDC published a report on disparities in social and health indicators, Health Disparities and Inequalities—United States, 2013 (CDC, 2013a). Despite limitations in the data, the report highlights the existence of inequalities that, in many cases, are increasing with time (see Table 3-1). For example, data from the 2009 National Vital Statistics System shows that blacks had higher age-adjusted rates of coronary heart disease (CHD) and stroke deaths than did other racial/ethnic groups.
Notably, dietary recommendations to control obesity, type 2 diabetes, CVD, hypertension, cancer, and osteoporosis are all remarkably similar (Krebs-Smith and Kris-Etherton, 2007; USDA and HHS, 2010a). For more
TABLE 3-1 Age-Adjusted Rates (number of cases/100,000) for Some Chronic Diseases Among Racial/Ethnic Groups; Data Sources and Years Vary
| Coronary Heart Disease and Strokea | Obesity in Femalesb | Diabetesc | Hypertensiond | |
| American Indian/Alaskan Native | 92 | |||
| Asian/Pacific Islander | 67.3 | |||
| Asian | 7.9 | |||
| Black | 141.3 | 51 | 11.3 | 41.3 |
| Hispanice | 86.5 | 11.5 | 27.7 | |
| White | 117.7 | 31 | 6.8 | 28.6 |
| Mexican Americans | 41 | 27.5 | ||
| Total | 116.1 | 29.6 | ||
a Data from 2009 National Vital Statistics Systems. Death rates per 100,000 U.S. standard population.
b Data from National Health and Nutrition Examination Survey (NHANES) 1999-2010. Prevalence per 100 population.
c Data from 2010 National Health Interview Survey; age-adjusted prevalence of diabetes of any duration per 100 population.
d Data from NHANES 2007-2010 prevalence of hypertension per 100 population.
e Persons of Hispanic ethnicity might be of any race.
SOURCE: CDC, 2013a.
than 30 years, federal dietary guidance has urged Americans to moderate their intakes of sodium and energy, especially from saturated fatty acids and simple carbohydrates. At the same time, they have encouraged relatively greater consumption of fruits, vegetables, and whole grains. The food supply is not aligned with these goals and, in spite of the recommendations, diets for most Americans have continued to be low in such foods and overabundant in refined grains, added sugars, saturated fats, and sodium.
Micronutrient Deficiencies
Clinical micronutrient deficiencies in the United States are uncommon, but risk of inadequacy occurs when the intake of a particular nutrient falls below reference values, referred to as DRIs (Trumbo et al., 2013). DRIs are nutrient intake standards for healthy individuals that are based on best available scientific evidence and are reviewed regularly. The specific mea-
sures and outcomes used to establish the Recommended Dietary Allowances (RDAs) vary by nutrient, but all relate to nutritional status or functional indicators that report on the level of nutrient intake required to prevent diseases associated with a particular micronutrient deficiency and/or to reduce chronic disease risk (Trumbo, 2008). Nutrient requirements can vary by population group, and the DRI process considers separate requirements for up to 22 distinct life stage and sex groups (Kennedy and Myers, 2005).
The micronutrient status of the U.S. population can be determined by comparing blood and urine measures of clinical cut-offs, accomplished primarily through NHANES (see p. 110 and Appendix B, Table B-3), or by national surveys that examine dietary intakes relative to the DRI reference values. The Second National Report on Biochemical Indicators of Diet and Nutrition in the U.S. Population (CDC, 2012) collected data on 58 biochemical indicators from specimens gathered during the period of 2003-2006 as part of NHANES. The data indicated that less than 10 percent of the general population had biochemical indicators below the clinical cut-off points. Vitamin B6, iron, and vitamin D had the most prevalent low values (see Figure 3-6). Borderline indicators were found in young women for
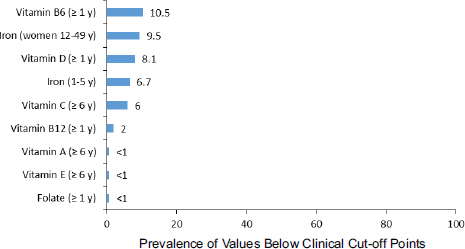
FIGURE 3-6 Prevalence estimates of nutrient deficiencies in U.S. persons, National Health and Nutrition Examination Survey, 2003-2006.
NOTES: Nutrition indicators were measured in different ages (e.g., age 1 year and older, age 6 years and older) and population groups (e.g., women ages 12-49 years, children ages 1-5 years). Cut-off values used to estimate prevalence are serum pyridoxal-5′-phosphate < 20 nmol/L, serum body iron < 0 mg/kg, serum 25-hydroxyvitamin D < 30 nmol/L, serum ascorbic acid < 114 μmol/L, serum cobalamin < 200 pg/mL, serum retinol < 20 μg/dL, serum alpha-tocopherol < 500 μg/dL, and red blood cell folate < 95 ng/mL.
SOURCE: CDC, 2012.
iodine, which is essential for normal growth and development of the fetus. Currently, most low micronutrient values in the United States are limited to particular population groups, and the rates vary by sex, age, and race/ethnicity. Non-Hispanic blacks and Mexican Americans are more likely to be low in vitamin D and folate (although rates of low values have decreased across all groups) compared to non-Hispanic whites. The prevalence of iron deficiency also varies by race and ethnicity. For children, the highest prevalence of deficiency is seen in Mexican Americans (10.9 versus 6.7 among all 1- to 5-year-old children) and, for adults, the highest prevalence deficiencies are seen in Mexican American (13.2 versus 9.5 among all women) and non-Hispanic black women (16.2 versus 9.5 among all women).
A report from USDA’s Agricultural Research Service examined the usual intake levels of 24 nutrients from food in 8,940 individuals using 2001-2002 NHANES data and compared these to the Estimated Average Requirements (Moshfegh et al., 2005). The intakes of vitamins A, E, C, and magnesium were marginally low across all population groups, whereas group-specific low intakes were seen for vitamin B6 and adult females, zinc for older adults, and phosphorus for young females. The latest data on phosphorus, magnesium, calcium, and vitamin D also found low intakes of those nutrients (Moshfegh et al., 2009). In contrast to using biomarker data, measuring micronutrient deficiency with intake data might be affected by reporting error.
The DRIs always have recognized that nutrient requirements differ by population groups, including age, sex, and life stage (e.g., pregnancy, lactation), but evidence is increasingly showing that requirements also are influenced by ethnicity and genetic variation (Solis et al., 2008) as well as obesity (Damms-Machado et al., 2012). Expanding knowledge of population heterogeneity (e.g., cultural, genetic, epigenetic, and BMI) and its impact on nutritional status have led to the idea of “individualized nutrition” (Ohlhorst et al., 2013). Individualized nutrition challenges intervention approaches at the population level because recommendations for one group within the population may be inappropriate for another group.
Microbiological Foodborne Illness
In the United States, foodborne disease surveillance is collected using both active and passive surveillance systems (see “Methodologies to Measure Health Outcomes” section on p. 109 and also Appendix B, Table B-3). The National Outbreak Reporting System (NORS) is a passive surveillance system that includes outbreaks (i.e., two or more people becoming ill from eating the same food) reported to CDC by state public health agencies. Data from NORS indicate that 831 foodborne illness outbreaks, 14,972 illnesses, 794 hospitalizations, and 23 deaths were reported in 2012 (CDC, 2014c).
Of the outbreaks with suspected or confirmed etiologies, 50 percent were associated with viruses, 42 percent with bacteria, 7 percent with chemicals and toxic agents, and 1 percent with parasites. The primary agents involved in confirmed illnesses were norovirus (50 percent) and Salmonella (28 percent). Of the hospitalizations, 61 percent of the cases involved Salmonella, 13 percent involved Shiga toxin-producing Escherichia coli (STEC), and 8 percent involved norovirus. Although the numbers of cases were not as high as those for other pathogens, severe disease is noted for Clostridium botulinum (21 illnesses, 1 death), Listeria monocytogenes (42 illnesses, 6 deaths), and mycotoxins (21 illnesses, 4 deaths). These data represent the “tip of the iceberg” in that underreporting of foodborne illness is significant (FoodNet data from 2000-2008 estimates 47.8 million illnesses annually).
The FoodNet (see next paragraph and Appendix B, Table B-3), an active surveillance program established in 1996 to monitor diarrheal foodborne illness attributed to eight bacterial pathogens and two parasites, provides better estimates than does NORS. Because data are normalized to the actual population size for participating sites, FoodNet data provide the basic metric to monitor trends from year to year. The incidence of foodborne illness associated with Salmonella, Shigella, STEC O157, Listeria monocytogenes, Yersinia, and Cryptosporidium in 2013 (CDC, 2014b) was not significantly different from a 2006-2008 baseline, while the incidence of Campylobacter and Vibrio increased 13 percent and 75 percent, respectively. The authors concluded that the lack of progress in recent years calls for more interventions and suggested possible causes. For example, the lack of progress in decreasing Salmonella infections since 2006-2008 could be due to a large outbreak associated with egg consumption in 2010, about the time when the Egg Safety Rule was being implemented. The increased incidence of Vibrio may be influenced by environmental and social factors. Vibrio spp. are naturally associated with a marine environment and seafood products. Increasingly warm coastal water temperatures provide a more favorable growth condition for Vibrio, thus increasing the risk of contamination. A majority of Vibrio foodborne illness outbreaks are associated with consumption of raw shellfish (Newton et al., 2012). Educational efforts to reduce consumption of these higher-risk products have not been effective (Newton et al., 2012).
FoodNet also is used as the basis for the current estimates of foodborne disease in the United States, which considers underreporting and the burden of disease related to unrecognized etiologies. For example, with data from 2000-2008, CDC estimates that 47.8 million illnesses, 127,839 hospitalizations, and 3,037 deaths related to foodborne illness occur every year in the United States, which translate into 1 in 6 Americans becoming ill every year from consuming contaminated food (Scallan et al., 2011a,b). Of these, known pathogens account for 9.4 million of these illnesses, 56,000
hospitalizations, and 1,400 deaths (Scallan et al., 2011a), illustrating that the burden from unknown agents is significant.
Foodborne illness estimates provided by FoodNet and NORS surveillance systems do not capture the true cost of foodborne disease. Some foodborne infectious diseases result in chronic sequelae, congenital disease, or death, which have an impact on productivity and quality of life. Quality-adjusted life year (QALY) estimates have been reported for 14 foodborne pathogens (Hoffman et al., 2012), which provide an estimate of economic and social costs of illness associated with major foodborne pathogens. The authors estimated that the annual cost of illness for the 14 pathogens ranged from $4.4 billion to $33 billion, and lost quality of life ranged from 19,000 to 145,000 QALYs. QALY calculations included factors for the estimated annual number of cases and the probability and duration of adverse health state. Non-typhoidal Salmonella spp., Campylobacter spp., L. monocytogenes, Toxoplasma gondii, and norovirus contributed to approximately 90 percent of the social and economic loss.
Chemical Foodborne Illness
Food risks are also related to chemicals, whether they are natural (e.g., allergens) or contaminants (e.g., they are not expected to be present in foods). Some contaminants have been known for many years while others are “emerging.” Examples of chemical contaminants are polychlorinated biphenyls, polychlorinated dioxins/furans, methyl mercury, lead, arsenic, cadmium, aflatoxins, other mycotoxins, marine toxins, chromium VI, other metals, polybrominated diphenyl ethers, polyfluorinated carboxylates and sulfonates, and perchlorate.
Only 7 percent of foodborne outbreaks reported for 2012 (CDC, 2014b) with a confirmed or suspected etiologic agent were associated with a chemical or toxin hazard. This represented about 1 percent of the foodborne illnesses reported. Over the longer time frame of 1998-2010 (CDC, 2013c), seafood-related agents were the most common chemical food safety issue, with scombroid toxin/histamine (351 outbreaks), ciguatoxin (190 outbreaks), mycotoxins (18 outbreaks), and paralytic shellfish poison (13 outbreaks) identified as causing the majority of outbreaks. Heavy metals, cleaning agents, neurotoxic shellfish poison, plant/herbal toxins, pesticides, puffer fish tetrodotoxin, monosodium glutamate, and other chemicals and natural toxins also were listed as causing at least one outbreak.
The effects of long exposures to low levels of chemicals through food or other environmental routes related to food production are not routinely surveyed for the general population. The time lag makes the identification of associations difficult, so resources are typically prioritized to other surveillance activities that provide more accurate results. However, some
studies have been conducted in specific populations that are exposed to higher levels of agrichemical residues through air or water, such as farmers, farm workers, or those in farming communities (see below for farming communities and Chapter 5 for health effects in farmers and farm workers).
A number of questions related to chemicals in foods are still unresolved. State of the Science of Endocrine Disrupting Chemicals—2012 (WHO, 2013) points out that significant uncertainty exists regarding the potential risk of endocrine system disruption from many chemicals used in food. In humans, the contribution of these chemicals to risk of endocrine-related diseases and human exposure levels from food and nonfood sources are not clear at this time. However, the negative impact of persistent organic pollutants on certain wildlife populations has been demonstrated, leading to recommendations to ban certain chemicals to reduce exposure. For example, banning of the nonfood-system-related pesticides DDT and tributyltin (e.g., used in ships’ paint) demonstrated positive effects on populations of birds and mollusks, respectively. Children and the developing fetus are more vulnerable to endocrine disruptors than are adults, again demonstrating that health outcomes related to the food supply can differ among human populations.
Environmental Pollutants
An important note is that in addition to food, some chemical exposures occur through air or water. For example, residents living near concentrated animal feeding operations3 (CAFOs) are reported to have increased incidence of respiratory distress, digestive disorders, anxiety, depression, and sleep disorders. Children living on farms raising swine were reported to have a higher incidence of asthma, with increasing incidence as the size of the swine operation increased (Donham et al., 2007). A report from the Iowa Health Sciences Research Center (ISU/UI Study Group, 2002) concluded that the effects on residents of communities in the vicinity of CAFOs were less definitive than for workers in the facilities but suggested that residents had similar respiratory symptoms and a reduced quality of life. The Iowa group went on to conclude that CAFO air emissions constitute a public health hazard deserving of public health precautions. Others are less convinced that health effects in communities can be attributed to emissions from CAFOs. A review of existing studies funded by the National Soybean Board and the National Pork Board concluded that evidence of a
_____________
3 CAFOs are agricultural enterprises where animals are confined on a small land area and feed is brought to the animals. The Environmental Protection Agency has delineated three categories of CAFOs, ordered in terms of capacity: large, medium, and small. The relevant animal unit for each category varies depending on species and capacity.
small increase in self-reported disease in people with allergies or familial history of allergies was inconsistent (O’Connor et al., 2010). The limitations in the quality and quantity of human health data related to CAFOs present challenges in assessing potential trade-offs associated with large-scale animal agriculture.
Likewise, ammonia (NH3) pollution from agriculture has been cited recently as a major cause of health damage in the United States (Paulot and Jacob, 2014). Ammonia, which can enter the atmosphere from fertilizer and from animal urine and manure, reacts with other components of air to create particles that can affect the lungs and cause asthma attacks, bronchitis, and heart attacks. When ammonia reacts with oxides of nitrogen and sulfur, it can form particulate matter that is less than 2.5 microns wide, a size considered most dangerous. Long-term reductions in particulate matter in the atmosphere have been related to increased life expectancy (Pope et al., 2009) (see also “Environmental Contaminants and Pollutants” in Chapter 4).
COMPLEXITIES ASSOCIATED WITH HEALTH EFFECTS OF THE FOOD SYSTEM
Many decisions, whether made by individuals or by society, involve trade-offs between a specific benefit and certain risks. Comparisons are often challenging because adequate metrics do not exist or cannot be monetized into a single metric. Other complexities can occur when an effect implicates different populations or subgroups within populations. Although it has not been unusual to consider health and economic trade-offs in decision-making processes with health goals in mind, other dimensions (e.g., social, environmental) often have been overlooked. For example, Annex 1 in Chapter 7 includes a discussion on current advice for fish consumption (based on health benefits) that does not consider environmental risks. Below are some selected examples of trade-offs and other complexities that are inherent in the food system as it exists today.
Different Outcomes for Different Populations
Abundant Food Supply, Food Insecurity, and Obesity
Despite an abundant food supply, some regions and populations in the United States experience food insecurity, which ironically may contribute to obesity. Food insecurity, which in 2012 affected 15 percent of U.S. households (Coleman-Jensen et al., 2013), is categorized in this report as a social and economic effect (a more thorough exploration of the social and economic aspects of food insecurity can be found in Chapter 5). Food
insecurity refers to those households that report lacking sufficient resources to acquire adequate food (Nord, 2013). Low-income, African American, and Latino households (Coleman-Jensen et al., 2013) are more likely to suffer food insecurity than are other population groups, and they are also at the highest risk for obesity and related illnesses such as type 2 diabetes, hypertension, and high cholesterol (Eisenmann et al., 2011; HER, 2010). Research also has shown that food insecurity affects children’s mental health and well-being (Alaimo et al., 2001; Whitaker et al., 2006). Food insecurity can lead to hunger, which is associated with being sick more often and missing more school days and work days (Brown et al., 2007). Brown and colleagues estimated the total cost related to health consequences of hunger and food insecurity to be $67 billion per year in 2005 dollars. The authors considered the estimate to be conservative because indirect costs (i.e., non-medical costs incurred as a result of an illness, such as missed days of work) could not be included for all health outcomes. Thus, the true cost of hunger and food insecurity is likely much greater than reported.
Being food insecure may lead to weight gain because the most accessible food options for low-income households are typically not nutrient-rich but rather energy-dense foods (HER, 2010; Shier et al., 2012), and because food insecurity may increase an individual’s need to depend on less nutritious foods that contain more calories but less nutritional value (Seligman and Schillinger, 2010). Bouts of both under- and overconsumption may lead to physiologic adaptation of increased body fat in response to episodic food shortages (CDC, 2003).
Residents of neighborhoods with higher concentrations of poverty and disadvantage often face multiple barriers to accessing healthy and affordable food (Lopez, 2007; Ver Ploeg et al., 2009). Moreover, households with limited resources tend to consume fewer healthful foods (e.g., fruits and vegetables) (Ludwig and Pollack, 2009) (see also Chapter 5). Higher socioeconomic status (SES) adults are more likely to come from households with better nutrition, fewer health risk behaviors, safer neighborhoods, and more economic resources (Crimmins et al., 2004). Therefore, consideration of the health effects of the food supply should consider the role of SES on morbidity and mortality (Marmot et al., 1991).
Different Nutritional Requirements for Different Populations: Folate
Folate is a B vitamin that is naturally present in many vegetables, nuts, beans, and fruits (Suitor and Bailey, 2000). Individuals require folate to make DNA and therefore produce and maintain new cells, particularly in tissues and cells that divide rapidly, such as blood cells (Beaudin and Stover, 2009). Folate nutrition is especially important for women of reproductive age. Clinical trials have established that folic acid intake before conception
and throughout the first trimester can prevent up to 70 percent of neural tube defects, a common class of birth defects that include spina bifida and anencephaly (Crider et al., 2011).
Evidence suggests that the actual requirement for folate may vary among individuals by race and genotype. Individuals with a common polymorphism in the methylenetetrahydrofolate reductase gene (MTHFR 677 C→T) metabolize folate differently than those without it. They tend to exhibit lower red blood cell folate concentrations (Bagley and Selhub, 1998), and they are more susceptible to low folate status and deficiency. This genetic variant is nearly absent in individuals of African descent, but it does not protect against folate deficiency when folate dietary intake is insufficient. The gene variant is highly prevalent in Hispanic populations (Esfahani et al., 2003). Studies indicate that the current RDA is inadequate for Mexican American men with the MTHFR 677 TT genotype (Solis et al., 2008). Although uncommon in the general population, other population groups may be at risk for folate deficiency: persons with celiac disease, which decreases nutrient absorption; alcoholics; non-Hispanic blacks; and Mexican American adolescents (IOM, 2000; Kant and Graubard, 2012). Yet, an additional complexity is that although some groups in the population are achieving a benefit from fortification, it has been proposed, but not demonstrated, that others may accrue increased cancer risk (Mason, 2011). Although currently there is no known harm (including increased cancer risk) associated with current folic acid fortification levels, this remains an active area of research.
Interactions with Environmental, Social, or Economic Effects
Increase in Productivity Versus Exposure to Antibiotic Resistance Through Food and Environment
Health effects of the food system are the result of direct exposures to food through consumption; through exposure to other environmental media such as air, water, soil, or livestock; or through a combination of all of them during a lifetime. Attributing risk to a particular cause creates methodological challenges, but it is necessary when attempting to assess the effects of the food system and identifying solutions. Since the early 1930s, the use of antibiotics has intensified in human and veterinarian clinical settings, in agricultural production, and in household products, with many benefits to patients, producers, and consumers (Allen et al., 2013; Stanton, 2013). In animal production, antibiotics are used in disease treatment, disease prevention, and growth promotion (Allen et al., 2013). Although this implies the economic benefits, the widespread use of antibiotics also has led to the emergence of drug-resistant infections, a substantial cost to human
and animal health. Many questions still remain about the causes of antibiotic resistance in agricultural applications and in the clinic, in part due to the lack of appropriate methods to study the complexities of resistance transference. Curtailing the spread of resistance in the absence of clear evidence or guidance from the scientific community can be difficult, while the incidence of antibiotic resistance has been increasing (Interagency Task Force on Antimicrobial Resistance, 2012), threatening human health and impacting animal agriculture. In 2013, the Food and Drug Administration (FDA) began implementing a voluntary plan with industry to phase out the use of certain antibiotics in food production (FDA, 2013). Antibiotic resistance is presented in Chapter 7 as an illustration of the application of the committee’s framework.
Use of Pesticides to Increase Productivity Versus Potential Health Effects
The use of pesticides in agriculture, along with other technological improvements, has led to great achievements in agricultural productivity (Pretty, 2008). In 2010, it was estimated that 6,873,000 lbs of atrazine (the second most frequent herbicide used, after glysophate) was used in conventional corn in Iowa (NASS, 2011). Pesticides are of concern because they may cause both acute and long-term health and environmental effects. The use of pesticides serves as an example of a contentious trade-off because the benefits are easily identified and quantified, but the potential costs are elusive due to lack of methodologies to measure long-term effects of exposure to low levels of chemicals by consumers (however, in the case of exposure by farmers, there are documented effects; see Chapter 5). Our knowledge about the behavior of pesticides, both their life cycle in the environment and in human metabolism after exposure, is still evolving. Emerging questions today concern the extent to which the exposure to chemicals during fetal and childhood development contributes to health problems later in life, such as obesity, or the potential long-term endocrine-disrupting effects of atrazine (Vandenberg et al., 2012).
The use of pesticides in food crops is regulated by the U.S. Environmental Protection Agency (EPA), which uses risk assessment as a tool to help make decisions. Due to ethical considerations, the identification of human health consequences relies mainly on animal testing4 and on human epide-
_____________
4 (1) Animal testing includes acute testing (short-term exposure of a single exposure) for outcomes such as eye irritation, skin irritation, skin sensitization, and neurotoxicity; (2) subchronic testing (intermediate exposure; repeated exposure over a longer period of time) for outcomes such as neurotoxicity; and (3) chronic toxicity testing (long-term exposure; repeated exposure lasting for most of the test animal’s life) for outcomes such as carcinogenicity (cancer). Developmental and reproductive functions,
miologic studies. The limitations of these experimental approaches add scientific uncertainties to the results and controversies related to limits needed to ensure safety of pesticides. The U.S. decision to approve use of atrazine is based on EPA’s position that, based on current data, atrazine is not likely to cause cancer in humans. However, uncertainties in the data are recognized. The U.S. limits of atrazine levels in drinking water and foods are based on the reproductive effects of atrazine (EPA, 2013). Because of new research showing endocrine-disruptive activity at much lower levels of atrazine, the current limits are highly debated (Cragin et al., 2011; Hayes, 2004; Hayes et al., 2002; NRDC, 2010; Rohr and McCoy, 2010; Vandenberg et al., 2012). The monitoring frequency of water also is being challenged as there are times when atrazine concentrations have sometimes increased above the legal limits in some communities (EPA, 2013). The effects of atrazine on human health and the environment were due to be reviewed again in 2013 by EPA as part of the reregistration process. No updates were available at the time of this report’s publication.
METHODOLOGIES TO MEASURE HEALTH OUTCOMES
Despite research gaps, uncertainties, or limitations in measurement and data collection, government policies are based on the best available scientific evidence, although other factors are considered, including feasibility, cost, impact on stakeholders, and legal considerations. Thus, the U.S. government, companies, and other stakeholders collect economic, social, demographic, lifestyle, as well as food, nutrition, and health data based on strategic plans and priorities. The types of data linking food systems to human health include indexes of food exposure (i.e., dietary intake), indicators of nutritional status, physiological functional indicators, and prevalence of disease. The two most common methods to quantify dietary intake of foods include the 24-hour dietary recall and the food frequency questionnaire (Tooze et al., 2012). The use and limitations of these methods, including measurement error, in health policy was recently reviewed (Hébert et al., 2014). Nutritional status indicators are typically direct or surrogate blood measurements that indicate whole-body tissue levels of a particular nutrient and require analytical methodologies for their assessment (Rohner et al., 2014). Physiological functional indicators of food or nutrient intake can include blood biomarkers of metabolic pathways or other functional indicators, including blood pressure, growth, cognitive function, and physical acuity and endurance (Rohner et al., 2014).
_____________
mutagenicity, and hormone disruption also are tested (http://www.epa.gov/pesticides/factsheets/riskassess.htm [accessed January 17, 2015]).
The most relevant health and nutrition survey is NHANES. Conducted annually from 1999 by the National Center for Health Statistics, NHANES covers a nationally representative sample of about 5,000 persons each year. NHANES includes an interview covering demographic, socioeconomic, dietary, and health-related questions and a physical examination that includes measurements of anthropometrics and key biomarkers of nutritional status (CDC/NCHS, 2014b). Among many other purposes, the data are used to assess the nutritional status of the U.S. population and to determine the prevalence of major diseases and their associated risk factors, including nutritional status. These data are available to the research community and are also used by the National Institutes of Health, FDA, and CDC to inform the implementation and evaluation of nutrition policies and initiatives.
Well-established methodologies to investigate foodborne illness have been developed (e.g., International Association for Food Protection, 2011) and are used to better understand the burden of foodborne disease in the United States. Previous publications provide a comprehensive discussion of datasets, metrics, and methodologies used in this area (e.g., IOM and NRC, 2003, 2010). As described earlier in this chapter, important surveillance methods used for foodborne illness are the passive surveillance NORS5 and the active surveillance system FoodNet6 (CDC, 2014a). NORS is used by state and local health departments to investigate foodborne illness on the local level. NORS summaries provide data on the number of illnesses, hospitalizations, and deaths attributed to unknown, suspected, and confirmed etiological agents (including bacteria, viruses, parasites, and chemicals) in food products. They also include information on settings where food was eaten, attribution to specific foods, factors contributing to contamination of the food, and settings where the food was prepared. FoodNet (CDC, 2014a) is an active surveillance system used by CDC to monitor illness, from the most common to the most severe foodborne causes of diarrheal disease and viral disease, respectively. In terms of chemical safety, no routine surveillance is conducted of exposures to chemicals through food or
_____________
5 NORS is the primary source of information on agents involved in foodborne outbreaks. Annual summaries based on NORS data are published periodically, including the latest summarizing information for 2009-2010 (http://www.cdc.gov/foodsafety/fdoss/data/annualsummaries/index.html [accessed January 17, 2015]); http://www.cdc.gov/nors [accessed January 17, 2015]).
6 FoodNet, launched in 1996, is a collaborative effort with 10 state health departments (Connecticut, Georgia, Maryland, Minnesota, New Mexico, Oregon, Tennessee, and certain counties in California, Colorado, and New York), FDA, and USDA’s Food Safety and Inspection Service. The information collected is used to estimate the burden of illness caused by the bacteria Campylobacter, Listeria, Salmonella, Shiga toxin-producing E. coli, Shigella, Vibrio, and Yersinia, and the parasites Cryptosporidium and Cyclospora.
other environmental routes related to food production, although NHANES includes testing for some chemical contaminants that could be associated with food consumption. The Adverse Event Reporting System at FDA monitors post-marketing surveillance adverse events for FDA-regulated foods. FDA’s Total Diet Study monitors levels of various contaminants at the retail level as an estimate of exposures to chemicals in foods. However, the sampling level is low (from about 280 foods).
These surveillance systems also are important because they are being used in health impact assessments (HIAs) of decisions affecting the food system. HIAs use a systematic approach to inform decision makers of the potential positive and negative health effects of policy proposals. Recommendations from HIAs aim to optimize beneficial health effects and minimize negative ones (NRC, 2011). HIAs have been used to identify the broad health effects of proposed changes to the Supplemental Nutrition Assistance Program, state-level legislation for farm-to-school and school garden programs, and USDA’s proposed standards for snack and á la carte foods and beverages sold in schools (HIP, 2014). These HIAs have helped illuminate how each proposal could be modified in advance to better support optimal health.
Tables B-1 through B-4 in Appendix B include examples of data collected on a routine basis that relate to food safety, food and nutrient consumption, and health outcomes. The tables also include health metrics and analytical methodologies that are often used to answer questions regarding the health status of individuals and populations, including outcomes, contributing factors, and confounders, intended to identify potential interventions to address public health problems.
Challenges in Establishing Associations Between the Food System and Health Outcomes
Decision making in nutrition with respect to nutrition interventions (e.g., nutrient intake requirements) increasingly relies on systematic reviews of the available evidence using approaches similar to those used to evaluate medical diagnoses and treatments (Balk et al., 2007; Blumberg et al., 2010). The evidence-based approach is used to evaluate the nature and strength of scientific evidence obtained from human studies relative to a hierarchy of scientific evidence that best supports causality. Data derived from double-blinded, placebo-controlled, randomized controlled trials serve as the gold standard, followed by cohort studies, case-control studies, case series, case reports, and expert opinions. Other types of supporting information can also be considered, including ecological data and data from animal studies and in vitro systems. This approach was most recently applied in establishing the DRIs for vitamin D and calcium (IOM, 2010).
The process of systematic review involves a thorough examination and grading of published data within an analytic framework that permits relevant and answerable questions to be posited. The standards for this process continue to evolve, including those established by the Cochrane Collaboration (2014), the IOM (2011), and USDA’s Nutrition Evidence Library. Central to these processes is a literature review that identifies relevant studies in a manner that is transparent and reproducible, comprehensive and unbiased, and takes into consideration the participants involved in the study, the nature of the intervention, the comparison groups, and the outcomes of interest. The strength of evidence is then evaluated relative to the consistency of findings, scientific quality, and absence of confounding factors. Similarly, limitations are evaluated, including inadequate design and/or controls, measurement error, insufficient or irrelevant data collection, and bias, including inclusion and exclusion criteria.
This general process for systematic reviews has been modified to incorporate the unique characteristics of nutrition research. Because no single standard exists to evaluate nutrition evidence, various groups have developed their own criteria and published reports. These groups include the Agency for Healthcare Research and Quality, the Academy of Nutrition and Dietetics, and the Dietary Guidelines for Americans Committee (DGAC). As an example, Table 3-2 shows the grading chart used by the 2010 DGAC to evaluate the strength of the body of evidence supporting the committee’s conclusion statements. The criteria in the chart are adapted from the American Dietetic Association Evidence Analysis Library (NEL, 2014b). The process can be iterative depending on the available data and the need to refine or reframe the questions posited. The available evidence can be combined (e.g., a meta-analysis) and extrapolated, and uncertainties can be identified and used to inform policy making.
The application of the evidence-based approach to nutrition, especially in the context of food and food systems, presents unique challenges. For example, exposures to food and nutrients are chronic and required for life, thereby limiting the opportunity for true placebo treatments and therefore not practically or ethically amenable to randomized controlled trials (Maki et al., 2014). Other challenges include the long duration between an exposure and a chronic disease onset and the complex and variable composition of foods where multiple nutrient components can often affect the outcome of interest. As a result, many dietary recommendations are supported by the totality of evidence, with the majority of evidence being derived from observational data. Maki et al. (2014) describe limitations often inherent to observational data, including imprecise exposure quantification, collinearity among dietary exposures, displacement/substitution effects, healthy/unhealthy consumer bias, residual confounding, and effect modification.
As discussed above, the problem of rising obesity rates presents its
own challenges due to its complex etiology. In contrast to other diseases that have declined as a result of 20th-century medical advances, the level of obesity in the United States has increased over the past several decades, perhaps due to its relationship with broad lifestyle and social and economic changes that have occurred simultaneously. In a review paper, Hammond (2009) found that obesity is a challenging problem to study due to several attributes: (1) the great breadth in levels of scale involved (e.g., genes, neurobiology, psychology, family structure and influences, social context and social norms, environment, markets, and public policy); (2) the substantial diversity of relevant actors; and (3) the multiplicity of mechanisms implicated. He proposed that these make the obesity problem a “complex adaptive system” and therefore, it can be studied using modeling techniques similar to those used by the field of complexity science (see also Chapter 6).
Challenges in Linking Foodborne Illness with Food
Although as mentioned above, methodologies to investigate foodborne illness are well established, identifying the specific agent responsible for foodborne illness is complicated (e.g., etiological agents also may come from nonfood sources, such as live animals, and the time between consumption of a contaminated food and the expression of symptoms can vary from minutes to weeks). Previous publications have commented extensively on the challenges of current datasets and attribution methods (e.g., IOM and NRC, 2003, 2010). For example, although the passive surveillance NORS is standardized, major limitations are the significant underreporting of foodborne disease, frequent lack of identification of causative agent, and exclusion of sporadic cases of illness (one individual becoming ill). To provide better national estimates of the burden of foodborne illness, CDC uses the active surveillance system FoodNet. Data from FoodNet provide the basic metrics used to monitor foodborne illness trends, to estimate the burden of disease, and to establish public health goals (e.g., in Healthy People 2020). Although data are representative of the population, a disadvantage of this surveillance system is that substantial percentages of illnesses, hospitalizations, and deaths are attributed to unspecified agents and they monitor only a fraction of the potential agents. CaliciNet is a national norovirus outbreak surveillance system used by CDC to link common sources of norovirus outbreaks. Because norovirus is easily transmitted person to person, many illnesses may not be foodborne.
PulseNet uses microbiological subtyping (e.g., DNA fingerprinting) of stool culture isolates in combination with epidemiological investigations and mathematical modeling to link sporadic cases or a cluster of cases to identify multistate outbreaks. A network of public health laboratories in the United States uses standardized methods to track isolates; matching strains
TABLE 3-2 Conclusion Grading Chart Used to Evaluate the Strength of the Body of Evidence Supporting Conclusion Statements by the Dietary Guidelines for Americans Committee
| Elements | Strong | Moderate | Limited | Expert Opinion Only | Grade Not Assignable |
Quality
|
Studies of strong design Free from design flaws, bias, and execution problems |
Studies of strong design with minor methodological concerns OR only studies of weaker study design for question |
Studies of weak design for answering the question OR inconclusive findings due to design flaws, bias, or execution problems |
No studies available Conclusion based on usual practice, expert consensus, clinical experience, opinion, or extrapolation from basic research | No evidence that pertains to question being addressed |
Consistency
|
Findings generally consistent in direction and size of effect or degree of association, and statistical significance with very minor exceptions | Inconsistency among results of studies with strong design, OR consistency with minor exceptions across studies of weaker design | Unexplained inconsistency among results from different studies, OR single study unconfirmed by other studies | Conclusion supported solely by statements of informed nutrition or medical commentators | Not applicable |
Quantity
|
One large study with a diverse population or several good-quality studies Large number of subjects studied Studies with negative results have sufficiently large |
Several studies by independent investigators Doubts about adequacy of sample size to avoid Type I and Type II error |
Limited number of studies Low number of subjects studied and/or inadequate sample size within studies |
Unsubstantiated by published research studies | Relevant studies have not been done |
| sample size for adequate statistical power | |||||
Impact
|
Studied outcome relates directly to the question Size of effect is clinically meaningful Significant (statistical) difference is large | Some doubt about the statistical or clinical significance of the effect | Studied outcome is an intermediate outcome or surrogate for the true outcome of interest OR size of effect is small or lacks statistical and/or clinical significance |
Objective data unavailable | Indicates area for future research |
Generalizability
|
Studied population, intervention, and outcomes are free from serious doubts about generalizability | Minor doubts about generalizability | Serious doubts about generalizability due to narrow or different study population, intervention, or outcomes studied | Generalizability limited to scope of experience | Not applicable |
SOURCE: USDA and HHS, 2010b.
are investigated further in an attempt to identify common sources. This methodology relies on culture isolates to generate the DNA fingerprint. As the health care system transitions to non-culture diagnostic methods, new “fingerprinting” techniques that do not depend on bacterial cultures will need to be developed. Risk assessment, the scientific element of a risk analysis framework, is an important methodology used to identify and attribute risk to foods and to food chemical and microbiological agents. Risk assessment is used by government agencies to guide the management of chemical and microbiological contaminants. Previous National Academy of Sciences reports provide a comprehensive description of the risk analysis framework (e.g., NRC, 2009). Formal risk assessment frameworks have evolved for both chemical and microbiological risks (see Table B-2). In-depth microbial risk assessments consider complexities associated with biological systems, such as variation in individual susceptibility, nonuniformity in the distribution of contamination, the ability of microbes to grow in food, and the potential for person-to-person spread for certain biological agents. Thus, microbial risk assessments can be resource intensive, presenting data gaps and uncertainties that must be articulated.
Chemical risk assessments also are resource intensive and traditionally use animal bioassays with extrapolation to humans. Due to the increasing number of chemicals to be tested, lower detection limits, and an urge to reduce animal testing, the merits of alternative approaches to prioritize and evaluate chemical safety are under discussion. For example, the use of risk assessment methodologies that could partly substitute in vitro testing for animal testing are evolving (e.g., computational and emerging in vitro methods such as in silico and high-throughput screening). This area of research faces numerous challenges, but it may decrease cost in the future (Bialk et al., 2013; Firestone et al., 2010; Kavlock and Dix, 2010; Krewski et al., 2010). In some cases, and when data are incomplete, the Threshold of Toxicological Concern approaches have been recommended when assessing the safety of chemicals in foods. Although less data intensive, applicability is limited to substances that meet specific criteria (Bialk et al., 2013; IFT, 2009).
SUMMARY
The U.S. food system supplies a wide variety of foods and sufficient calories at a low cost to meet the needs of the U.S. population. The major diet-related diseases and conditions of the current era in the United States are not related to nutrient inadequacy but mostly to inappropriate dietary patterns and overconsumption. Diet is a primary risk factor in the etiology of several leading causes of mortality and morbidity. However, despite the presence of this plentiful food supply, some segments of the U.S. population face issues of health, access, and food security.
Measuring those effects and identifying the mechanisms and pathways are challenging tasks presenting complexities at various levels. For example, government agencies have established dietary guidelines for healthy diets, but market forces (e.g., extensive advertising of unhealthy foods along with poor advertising of healthy foods) and consumer preferences do not always support recommended dietary practices. The etiology of many human health outcomes is multifactorial, with dietary practices being one of multiple interacting risk factors. Health outcomes related to the food system may vary among individuals and populations depending on their socioeconomic status or their individual physiology and genetics.
The diversity of the foods in the system provides resilience in maintaining a nutritious food supply without dependency on any single food or commodity. However, an appropriate variety of food is not equally accessible to all individuals in the population, which contributes to heterogeneity in health effects. For some foods and dietary patterns, there are both health benefits and risks associated with their consumption, illustrating the tradeoffs that are inherent in the food system. Also, maximizing positive health effects may come at the expense of environmental, social, and economic effects.
Understanding the health effects of the food system and its trade-offs and interactions with the environment and social and economic domains is key to informing food system policies and interventions. Chapter 7 provides an analytical framework where all of these domains are considered.
REFERENCES
ADA (American Diabetes Association). 2013. Economic costs of diabetes in the U.S. in 2012. Diabetes Care 36(4):1033-1046.
Alaimo, K., C. M. Olson, and E. A. Frongillo, Jr. 2001. Food insufficiency and American school-aged children’s cognitive, academic, and psychosocial development. Pediatrics 108(1):44-53.
Allen, H. K., U. Y. Levine, T. Looft, M. Bandrick, and T. A. Casey. 2013. Treatment, promotion, commotion: Antibiotic alternatives in food-producing animals. Trends in Microbiology 21(3):114-119.
Archer, E., R. P. Shook, D. M. Thomas, T. S. Church, P. T. Katzmarzyk, J. R. Hebert, K. L. McIver, G. A. Hand, C. J. Lavie, and S. N. Blair. 2013. 45-year trends in women’s use of time and household management energy expenditure. PLoS ONE 8(2):e56620.
Assaf, R. R. 2014. Overview of local, state, and national government legislation restricting trans fats. Clinical Therapeutics 36(3):328-332.
Bader, M. D., M. Purciel, P. Yousefzadeh, and K. M. Neckerman. 2010. Disparities in neighborhood food environments: Implications of measurement strategies. Economic Geography 86(4):409-430.
Bagley, P. J., and J. Selhub. 1998. A common mutation in the methylenetetrahydrofolate reductase gene is associated with an accumulation of formylated tetrahydrofolates in red blood cells. Proceedings of the National Academy of Sciences of the United States of America 95(22):13217-13220.
Balk, E. M., T. A. Horsley, S. J. Newberry, A. H. Lichtenstein, E. A. Yetley, H. M. Schachter, D. Moher, C. H. MacLean, and J. Lau. 2007. A collaborative effort to apply the evidence-based review process to the field of nutrition: Challenges, benefits, and lessons learned. American Journal of Clinical Nutrition 85(6):1448-1456.
Beaudin, A. E., and P. J. Stover. 2009. Insights into metabolic mechanisms underlying folate-responsive neural tube defects: A minireview. Birth Defects Research. Part A, Clinical and Molecular Teratology 85(4):274-284.
Bialk, H., C. Llewellyn, A. Kretser, R. Canady, R. Lane, and J. Barach. 2013. Insights and perspectives on emerging inputs to weight of evidence determinations for food safety: Workshop proceedings. International Journal of Toxicology 32(6):405-414.
Blumberg, J., R. P. Heaney, M. Huncharek, T. Scholl, M. Stampfer, R. Vieth, C. M. Weaver, and S. H. Zeisel. 2010. Evidence-based criteria in the nutritional context. Nutrition Reviews 68(8):478-484.
Brown, J. L., D. Shepard, T. Martin, and J. Orwat. 2007. The economic costs of domestic hunger. Gaithersburg, MD: Sodexo Foundation.
CDC (Centers for Disease Control and Prevention). 2003. Self-reported concern about food security associated with obesity—Washington, 1995-1999. Morbidity and Mortality Weekly Report 52(35):840-842.
CDC. 2012. Second national report on biochemical indicators of diet and nutrition in the U.S. population. http://www.cdc.gov/nutritionreport/pdf/Nutrition_Book_complete508_final.pdf (accessed November 24, 2014).
CDC. 2013a. Health disparities and inequalities report—United States, 2013. MMWR Supplement 62(3):1-87.
CDC. 2013b. Leading causes of death. http://www.cdc.gov/nchs/fastats/leading-causes-of-death.htm (accessed November 24, 2014).
CDC. 2013c. Surveillance for foodborne disease outbreaks—United States, 2009-2010. Morbidity and Mortality Weekly Report 62(3):41-47.
CDC. 2014a. CDC estimates of foodborne illness in the United States. http://www.cdc.gov/foodborneburden/trends-in-foodborne-illness.html (accessed November 24, 2014).
CDC. 2014b. Incidence and trends of infection with pathogens transmitted commonly through food–foodborne diseases active surveillance network, 10 U.S. sites, 2006-2013. Morbidity and Mortality Weekly Report 63(15):328-332.
CDC. 2014c. Surveillance for foodborne disease outbreaks, United States 2012, annual report. Atlanta, GA: CDC.
CDC/NCHS (National Center for Health Statistics). 2014a. Health, United States, 2013. With special feature on prescription drugs. Hyattsville, MD: NCHS.
CDC/NCHS. 2014b. National Health and Nutrition Examination Survey. http://www.cdc.gov/nchs/nhanes.htm (accessed November 24, 2014).
Chandon, P., and B. Wansink. 2012. Does food marketing need to make us fat? A review and solutions. Nutrition Reviews 70(10):571-593.
Church, T. S., D. M. Thomas, C. Tudor-Locke, P. T. Katzmarzyk, C. P. Earnest, R. Q. Rodarte, C. K. Martin, S. N. Blair, and C. Bouchard. 2011. Trends over 5 decades in U.S. occupation-related physical activity and their associations with obesity. PLoS ONE 6(5):e19657.
Cochrane Collaboration. 2014. Cochrane reviews. http://www.cochrane.org/cochrane-reviews (accessed November 24, 2014).
Coleman-Jensen, A., M. Nord, and A. Singh. 2013. Household food security in the United States in 2012. Economic Research Report No. (ERR-155). Washington, DC: U.S. Department of Agriculture, Economic Research Service.
Cragin, L. A., J. S. Kesner, A. M. Bachand, D. B. Barr, J. W. Meadows, E. F. Krieg, and J. S. Reif. 2011. Menstrual cycle characteristics and reproductive hormone levels in women exposed to atrazine in drinking water. Environmental Research 111(8):1293-1301.
Crider, K. S., L. B. Bailey, and R. J. Berry. 2011. Folic acid food fortification—its history, effect, concerns, and future directions. Nutrients 3:370-384.
Crimmins, E.M., M. D. Hayward, and T. E. Seeman. 2004. Race/ethnicity, socioeconomic status, and health. In Critical perspectives on racial and ethnic differences in health in late life, edited by N. B. Anderson, R. A. Bulatao, and B. Cohen. Washington, DC: The National Academies Press.
Dagenais, G. R., Q. Yi, J. F. Mann, J. Bosch, J. Pogue, and S. Yusuf. 2005. Prognostic impact of body weight and abdominal obesity in women and men with cardiovascular disease. American Heart Journal 149(1):54-60.
Damms-Machado, A., G. Weser, and S. C. Bischoff. 2012. Micronutrient deficiency in obese subjects undergoing low calorie diet. Nutrition Journal 11:34.
de Ruyter, J. C., M. R. Olthof, J. C. Seidell, and M. B. Katan. 2012. A trial of sugar-free or sugar-sweetened beverages and body weight in children. New England Journal of Medicine 367(15):1397-1406.
den Hoed, M., U. Ekelund, S. Brage, A. Grontved, J. H. Zhao, S. J. Sharp, K. K. Ong, N. J. Wareham, and R. J. Loos. 2010. Genetic susceptibility to obesity and related traits in childhood and adolescence: Influence of loci identified by genome-wide association studies. Diabetes 59(11):2980-2988.
Dina, C., D. Meyre, C. Samson, J. Tichet, M. Marre, B. Jouret, M. A. Charles, B. Balkau, and P. Froguel. 2007. Comment on “a common genetic variant is associated with adult and childhood obesity.” Science 315(5809):187.
Donham, K. J., S. Wing, D. Osterberg, J. L. Flora, C. Hodne, K. M. Thu, and P. S. Thorne. 2007. Community health and socioeconomic issues surrounding concentrated animal feeding operations. Environmental Health Perspectives 115(2):317-320.
Ebbeling, C. B., H. A. Feldman, V. R. Chomitz, T. A. Antonelli, S. L. Gortmaker, S. K. Osganian, and D. S. Ludwig. 2012. A randomized trial of sugar-sweetened beverages and adolescent body weight. New England Journal of Medicine 367(15):1407-1416.
Eckel, R. H., J. M. Jakicic, J. D. Ard, J. M. de Jesus, N. Houston Miller, V. S. Hubbard, I. M. Lee, A. H. Lichtenstein, C. M. Loria, B. E. Millen, C. A. Nonas, F. M. Sacks, S. C. Smith, Jr., L. P. Svetkey, T. A. Wadden, and S. Z. Yanovski. 2014. 2013 AHA/ACC guideline on lifestyle management to reduce cardiovascular risk: A report of the American College of Cardiology/American Heart Association task force on practice guidelines. Journal of the American College of Cardiology 63(25 Pt B):2960-2984.
Eisenmann, J. C., C. Gundersen, B. J. Lohman, S. Garasky, and S. D. Stewart. 2011. Is food insecurity related to overweight and obesity in children and adolescents? A summary of studies, 1995-2009. Obesity Reviews 12(5):e73-e83.
EPA (U.S. Environmental Protection Agency). 2013. Atrazine updates. http://www.epa.gov/oppsrrd1/reregistration/atrazine/atrazine_update.htm (accessed November 24, 2014).
Esfahani, S. T., E. A. Cogger, and M. A. Caudill. 2003. Heterogeneity in the prevalence of methylenetetrahydrofolate reductase gene polymorphisms in women of different ethnic groups. Journal of the American Dietetic Association 103(2):200-207.
FDA (U.S. Food and Drug Administration). 2013. Phasing out certain antibiotic use in farm animals. http://www.fda.gov/forconsumers/consumerupdates/ucm378100.htm (accessed November 24, 2014).
Finkelstein, E. A., J. G. Trogdon, J. W. Cohen, and W. Dietz. 2009. Annual medical spending attributable to obesity: Payer- and service-specific estimates. Health Affairs (Millwood) 28(5):w822-w831.
Firestone, M., R. Kavlock, H. Zenick, and M. Kramer. 2010. The U.S. Environmental Protection Agency strategic plan for evaluating the toxicity of chemicals. Journal of Toxicology and Environmental Health. Part B Critical Reviews 13(2-4):139-162.
Flegal, K. M., M. D. Carroll, B. K. Kit, and C. L. Ogden. 2012. Prevalence of obesity and trends in the distribution of body mass index among US adults, 1999-2010. Journal of the American Medical Association 307(5):491-497.
Frayling, T. M., N. J. Timpson, M. N. Weedon, E. Zeggini, et al. 2007. A common variant in the FTO gene is associated with body mass index and predisposes to childhood and adult obesity. Science 316(5826):889-894.
Frederick, C. B., K. Snellman, and R. D. Putnam. 2014. Increasing socioeconomic disparities in adolescent obesity. Proceedings of the National Academy of Sciences of the United States of America 111(4):1338-1342.
Fryar, C. D., M. D. Carroll, and C. L. Ogden. 2012. NCHS Health E-Stat: Prevalence of obesity among children and adolescents: United States, trends 1963-1965 through 2009-2010. http://www.cdc.gov/nchs/data/hestat/obesity_child_09_10/obesity_child_09_10.htm (accessed November 24, 2014).
Fryar, C. D., M. D. Carroll, and C. L. Ogden. 2014. NCHS E-Stat: Prevalence of overweight, obesity, and extreme obesity among adults: United States, 1960-1962 through 2011-2012. http://www.cdc.gov/nchs/data/hestat/obesity_adult_11_12/obesity_adult_11_12.htm (accessed November 24, 2014).
Go, A. S., D. Mozaffarian, V. L. Roger, E. J. Benjamin, J. D. Berry, et al. 2014. Heart disease and stroke statistics—2014 update: A report from the American Heart Association. Circulation 129(3):E28-E292.
Hammond, R. A. 2009. Complex systems modeling for obesity research. Preventing Chronic Disease 6(3):A97.
Hawkes, C. 2009. Sales promotions and food consumption. Nutrition Reviews 67(6):333-342.
Hayes, T. B. 2004. There is no denying this: Defusing the confusion about atrazine. BioScience 54(12):1138-1149.
Hayes, T. B., A. Collins, M. Lee, M. Mendoza, N. Noriega, A. A. Stuart, and A. Vonk. 2002. Hermaphroditic, demasculinized frogs after exposure to the herbicide atrazine at low ecologically relevant doses. Proceedings of the National Academy of Sciences of the United States of America 99(8):5476-5480.
Hébert, J. R., T. G. Hurley, S. E. Steck, D. R. Miller, F. K. Tabung, K. E. Peterson, L. H. Kushi, and E. A. Frongillo. 2014. Considering the value of dietary assessment data in informing nutrition-related health policy. Advances in Nutrition 5(4):447-455.
HER (Healthy Eating Research). 2010. Food insecurity and risk for obesity among children and families: Is there a relationship? http://www.rwjf.org/content/dam/farm/reports/reports/2010/rwjf58903 (accessed November 24, 2014).
HIP (Health Impact Project). 2014. The Health Impact Project. http://www.healthimpactproject.org (accessed November 24, 2014).
Hoffmann, S., M. B. Batz, and J. G. Morris, Jr. 2012. Annual cost of illness and quality-adjusted life year losses in the United States due to 14 foodborne pathogens. Journal of Food Protection 75(7):1292-1302.
IFT (Institute of Food Technologists). 2009. Making decisions about the risks of chemicals in foods with limited scientific information. An IFT Expert Report funded by the IFT Foundation. Comprehensive Reviews in Food Science and Food Safety 8:269-303.
IHME (Institute for Health Metrics and Evaluation). 2013. GBD 2010 heat map. http://vizhub.healthdata.org/irank/heat.php (accessed June 14, 2014).
IHME. 2014. Overweight and obesity patterns (BMI≥25) for both sexes adults (20+). http://vizhub.healthdata.org/obesity (accessed June 16, 2014).
Interagency Task Force on Antimicrobial Resistance. 2012. A public health action plan to combat antibiotic resistance. http://www.cdc.gov/drugresistance/actionplan/aractionplan.pdf (accessed November 24, 2014).
International Association for Food Protection. 2011. Procedures to investigate foodborne illness, 6th ed. New York: Springer.
IOM (Institute of Medicine). 2000. Dietary reference intakes for thiamin, riboflavin, niacin, vitamin B6, folate, vitamin B12, pantothenic acid, biotin, and choline. Washington, DC: National Academy Press.
IOM. 2005. Preventing childhood obesity. Health in the balance. Washington, DC: The National Academies Press.
IOM. 2006a. Food marketing to children and youth: Threat or opportunity? Washington, DC: The National Academies Press.
IOM. 2006b. Seafood choices: Balancing benefits and risks. Washington, DC: The National Academies Press.
IOM. 2010. Dietary reference intakes for calcium and vitamin D. Washington, DC: The National Academies Press.
IOM. 2011. Finding what works in health care: Standards for systematic reviews. Washington, DC: The National Academies Press.
IOM. 2012. Accelerating progress in obesity prevention: Solving the weight of the nation. Washington, DC: The National Academies Press.
IOM. 2014. Dietary reference intakes tables and application. http://www.iom.edu/Activities/Nutrition/SummaryDRIs/DRI-Tables.aspx (accessed November 24, 2014).
IOM and NRC (National Research Council). 2003. Scientific criteria to ensure safe food. Washington, DC: The National Academies Press.
IOM and NRC. 2010. Enhancing food safety. The role of the Food and Drug Administration. Washington, DC: The National Academies Press.
ISU/UI Study Group (Environmental Health Sciences Research Center CAFO Air Quality Study Iowa State University/University of Iowa Study Group). 2002. Iowa Concentrated Animal Feeding Operations Air Quality Study. http://www.public-health.uiowa.edu/ehsrc/pubs/cafo-aqs.html (accessed November 24, 2014).
Jensen, M. D., D. H. Ryan, C. M. Apovian, J. D. Ard, A. G. Comuzzie, K. A. Donato, F. B. Hu, V. S. Hubbard, J. M. Jakicic, R. F. Kushner, C. M. Loria, B. E. Millen, C. A. Nonas, F. X. Pi-Sunyer, J. Stevens, V. J. Stevens, T. A. Wadden, B. M. Wolfe, and S. Z. Yanovski. 2014. 2013 AHA/ACC/TOS guideline for the management of overweight and obesity in adults: A report of the American College of Cardiology/American Heart Association Task Force on Practice Guidelines and The Obesity Society. Circulation 129(25 Suppl 2):S102-S138.
Kant, A. K., and B. I. Graubard. 2012. Race–ethnic, family income, and education differentials in nutritional and lipid biomarkers in US children and adolescents: NHANES 2003-2006. American Journal of Clinical Nutrition 96(3):601-612.
Kavlock, R., and D. Dix. 2010. Computational toxicology as implemented by the US EPA: Providing high throughput decision support tools for screening and assessing chemical exposure, hazard and risk. Journal of Toxicology and Environmental Health. Part B, Critical Reviews 13(2-4):197-217.
Kennedy, E., and L. Meyers. 2005. Dietary reference intakes: Development and uses for assessment of micronutrient status of women—a global perspective. American Journal of Clinical Nutrition 81(5):1194S-1197S.
Krebs-Smith, S. M., and P. Kris-Etherton. 2007. How does MyPyramid compare to other population-based recommendations for controlling chronic disease? Journal of the American Dietetic Association 107(5):830-837.
Krewski, D., D. Acosta, Jr., M. Andersen, H. Anderson, J. C. Bailar III, K. Boekelheide, R. Brent, G. Charnley, V. G. Cheung, S. Green, Jr., K. T. Kelsey, N. I. Kerkvliet, A. A. Li, L. McCray, O. Meyer, R. D. Patterson, W. Pennie, R. A. Scala, G. M. Solomon, M. Stephens, J. Yager, and L. Zeise. 2010. Toxicity testing in the 21st century: A vision and a strategy. Journal of Toxicology and Environmental Health, Part B, Critical Reviews 13(2-4):51-138.
Langer, A. J., T. Ayers, J. Grass, M. Lynch, F. J. Angulo, and B. E. Mahon. 2012. Nonpasteurized dairy products, disease outbreaks, and state laws—United States, 1993-2006. Emerging Infectious Diseases 18(3):385-391.
Leibel, R. L. 2008. Energy in, energy out, and the effects of obesity-related genes. New England Journal of Medicine 359(24):2603-2604.
Lopez, R. P. 2007. Neighborhood risk factors for obesity. Obesity (Silver Spring) 15(8):2111-2119.
Ludwig, D. S., and H. A. Pollack. 2009. Obesity and the economy: From crisis to opportunity. Journal of the American Medical Association 301(5):533-535.
Macdiarmid, J. I., J. Kyle, G. W. Horgan, J. Loe, C. Fyfe, A. Johnstone, and G. McNeill. 2012. Sustainable diets for the future: Can we contribute to reducing greenhouse gas emissions by eating a healthy diet? American Journal of Clinical Nutrition 96(3):632-639.
Maki, K. C., J. L. Slavin, T. M. Rains, and P. M. Kris-Etherton. 2014. Limitations of observational evidence: Implications for evidence-based dietary recommendations. Advances in Nutrition 5(1):7-15.
Malik, V. S., A. Pan, W. C. Willett, and F. B. Hu. 2013. Sugar-sweetened beverages and weight gain in children and adults: A systematic review and meta-analysis. American Journal of Clinical Nutrition 98(4):1084-1102.
Malnick, S. D., and H. Knobler. 2006. The medical complications of obesity. QJM 99(9):565-579.
Mariner, W. K., and G. J. Annas. 2013. Limiting “sugary drinks” to reduce obesity—who decides? New England Journal of Medicine 368(19):1763-1765.
Marmot, M. G., G. D. Smith, S. Stansfeld, C. Patel, F. North, J. Head, I. White, E. Brunner, and A. Feeney. 1991. Health inequalities among British civil-servants—the Whitehall II study. Lancet 337(8754):1387-1393.
Mason, J. B. 2011. Unraveling the complex relationship between folate and cancer risk. Bio-factors 37(4):253-260.
Moshfegh, A., J. Goldman, and L. Cleveland. 2005. What we eat in America, NHANES 2001-2002: Usual nutrient intakes from food compared to dietary reference intakes. http://www.ars.usda.gov/main/site_main.htm?modecode=80-40-05-30 (accessed November 24, 2014).
Moshfegh, A., J. Goldman, J. Ahuja, D. Rhodes, and R. LaComb. 2009. What we eat in America, NHANES 2005-2006: Usual nutrient intakes from food and water compared to 1997 dietary reference intakes for vitamin D, calcium, phosphorus, and magnesium. http://www.ars.usda.gov/main/site_main.htm?modecode=80-40-05-30 (accessed November 24, 2014).
NASS (National Agricultural Statistics Service). 2011. 2011 Iowa agricultural statistics: USDA National Agricultural Statistics Service, Iowa Field Office and Iowa Farm Bureau. http://www.nass.usda.gov/Statistics_by_State/Iowa/Publications/Annual_Statistical_Bulletin/index.asp (accessed November 21, 2014).
NEL (Nutrition Evidence Library). 2014a. Nutrition evidence library. http://www.nel.gov (accessed November 24, 2014).
NEL. 2014b. Conclusion grading chart (2010 DGAC). http://www.nel.gov/topic.cfm?cat=3210 (accessed November 24, 2014).
Nestle, M., and M. Nesheim. 2012. Why calories count: From science to politics. Berkeley, CA: University of California Press.
Newton, A., M. Kendall, D. J. Vugia, O. L. Henao, and B. E. Mahon. 2012. Increasing rates of vibriosis in the United States, 1996-2010: Review of surveillance data from 2 systems. Clinical Infectious Diseases 54(Suppl 5):S391-S395.
Ng, M., T. Fleming, M. Robinson, B. Thomson, N. Graetz, C. Margono, E. C. Mullany, S. Biryukov, C. Abbafati, S. F. Abera, J. P. Abraham, N. M. Abu-Rmeileh, et al. 2014. Global, regional, and national prevalence of overweight and obesity in children and adults during 1980-2013: A systematic analysis for the Global Burden of Disease Study 2013. Lancet 384(9945):766-781.
Nord, M. 2013. Food insecurity in U.S. households rarely persists over many years. Amber Waves. Washington, DC: U.S. Department of Agriculture, Economic Research Service.
NRC (National Research Council). 2009. Science and decisions: Advancing risk assessment. Washington, DC: The National Academies Press.
NRC. 2011. Improving health in the United States: The role of health impact assessment. Washington, DC: The National Academies Press.
NRDC (Natural Resources Defense Council). 2010. Still poisoning the well. Atrazine continues to contaminate surface water and drinking water in the United States. http://www.nrdc.org/health/atrazine/files/atrazine10.pdf (accessed November 24, 2014).
Nwankwo, T., S. S. Yoon, V. Burt, and Q. Gu. 2013. Hypertension among adults in the United States: National Health and Nutrition Examination Survey, 2011-2012. NCHS Data Brief (133):1-8.
O’Connor, A. M., B. Auvermann, D. Bickett-Weddle, S. Kirkhorn, J. M. Sargeant, A. Ramirez, and S. G. Von Essen. 2010. The association between proximity to animal feeding operations and community health: A systematic review. PLoS ONE 5(3):e9530.
Ohlhorst, S. D., R. Russell, D. Bier, D. M. Klurfeld, Z. Li, J. R. Mein, J. Milner, A. C. Ross, P. Stover, and E. Konopka. 2013. Nutrition research to affect food and a healthy life span. American Journal of Clinical Nutrition 98(2):620-625.
Paulot, F., and D. J. Jacob. 2014. Hidden cost of U.S. agricultural exports: Particulate matter from ammonia emissions. Environmental Science & Technology 48(2):903-908.
Perez-Morales, E., M. Bacardi-Gascon, and A. Jimenez-Cruz. 2013. Sugar-sweetened beverage intake before 6 years of age and weight or BMI status among older children; systematic review of prospective studies. Nutrición hospitalaria 28(1):47-51.
Pingali, P. L. 2012. Green revolution: Impacts, limits, and the path ahead. Proceedings of the National Academy of Sciences of the United States of America 109(31):12302-12308.
Pope, C. A., M. Ezzati, and D. W. Dockery. 2009. Fine-particulate air pollution and life expectancy in the United States. New England Journal of Medicine 360(4):376-386.
Popkin, B. M. 2011. Agricultural policies, food and public health. EMBO Reports 12(1):11-18.
Pretty, J. 2008. Agricultural sustainability: Concepts, principles and evidence. Philosophical Transactions of the Royal Society of London, Series B, Biological Sciences 363(1491):447-465.
Price, J. H., J. Khubchandani, M. McKinney, and R. Braun. 2013. Racial/ethnic disparities in chronic diseases of youths and access to health care in the United States. BioMed Research International 2013:1-12.
Rohner, F., M. Zimmermann, P. Jooste, C. Pandav, K. Caldwell, R. Raghavan, and D. J. Raiten. 2014. Biomarkers of nutrition for development—iodine review. Journal of Nutrition 144(8):1322S-1342S.
Rohr, J. R., and K. A. McCoy. 2010. A qualitative meta-analysis reveals consistent effects of atrazine on freshwater fish and amphibians. Environmental Health Perspectives 118(1):20-32.
Rolls, B. J., E. L. Morris, and L. S. Roe. 2002. Portion size of food affects energy intake in normal-weight and overweight men and women. American Journal of Clinical Nutrition 76(6):1207-1213.
Rutkow, L., J. S. Vernick, J. G. Hodge, Jr., and S. P. Teret. 2008. Preemption and the obesity epidemic: State and local menu labeling laws and the Nutrition Labeling and Education Act. Journal of Law, Medicine and Ethics 36(4):772-789.
Scallan, E., R. M. Hoekstra, F. J. Angulo, R. V. Tauxe, M. A. Widdowson, S. L. Roy, J. L. Jones, and P. M. Griffin. 2011a. Foodborne illness acquired in the United States—major pathogens. Emerging Infectious Diseases 17(1):7-15.
Scallan, E., P. M. Griffin, F. J. Angulo, R. V. Tauxe, and R. M. Hoekstra. 2011b. Foodborne illness acquired in the United States—unspecified agents. Emerging Infectious Diseases 17(1):16-22.
Seligman, H. K., and D. Schillinger. 2010. Hunger and socioeconomic disparities in chronic disease. New England Journal of Medicine 363(1):6-9.
Shier, V., R. An, and R. Sturm. 2012. Is there a robust relationship between neighbourhood food environment and childhood obesity in the USA? Public Health 126(9):723-730.
Solis, C., K. Veenema, A. A. Ivanov, S. Tran, R. Li, W. Wang, D. J. Moriarty, C. V. Maletz, and M. A. Caudill. 2008. Folate intake at RDA levels is inadequate for Mexican American men with the methylenetetrahydrofolate reductase 677tt genotype. Journal of Nutrition 138(1):67-72.
Stanton, T. B. 2013. A call for antibiotic alternatives research. Trends in Microbiology 21(3):111-113.
Stover, P. J. 2006. Influence of human genetic variation on nutritional requirements. American Journal of Clinical Nutrition 83(2):436S-442S.
Stuckler, D., and M. Nestle. 2012. Big food, food systems, and global health. PLoS Medicine 9(6):e1001242.
Suitor, C. W., and L. B. Bailey. 2000. Dietary folate equivalents: Interpretation and application. Journal of the American Dietetic Association 100(1):88-94.
Todd, J. E., L. Mancino, and B.-H. Lin. 2010. The impact of food away from home on adult diet quality. Washington, DC: U.S. Department of Agriculture, Economic Research Service.
Tooze, J. A., S. M. Krebs-Smith, R. P. Troiano, and A. F. Subar. 2012. The accuracy of the Goldberg method for classifying misreporters of energy intake on a food frequency questionnaire and 24-h recalls: Comparison with doubly labeled water. European Journal of Clinical Nutrition 66(5):569-576.
Trumbo, P. R. 2008. Challenges with using chronic disease endpoints in setting dietary reference intakes. Nutrition Reviews 66(8):459-464.
Trumbo, P. R., S. I. Barr, S. P. Murphy, and A. A. Yates. 2013. Dietary reference intakes: Cases of appropriate and inappropriate uses. Nutrition Reviews 71(10):657-664.
USDA (U.S. Department of Agriculture). 2014. A series of systematic reviews on the relationship between dietary patterns and health outcomes. Alexandria, VA: USDA/Center for Nutrition Policy and Promotion. http://www.nel.gov/vault/2440/web/files/Nutrition%20Education%20Systematic%20Review%20Report%20-%20CHAP%201-5_FINAL.pdf (accessed November 24, 2014).
USDA and HHS (U.S. Department of Health and Human Services). 2010a. Nutrition and your health: Dietary guidelines for Americans, 2010, 7th ed. Washington, DC: USDA.
USDA and HHS. 2010b. Report of the Dietary Guidelines Advisory Committee on the Dietary Guidelines for Americans, 2010, to the Secretary of Agriculture and the Secretary of Health and Human Services. Washington, DC: USDA.
Vandenberg, L. N., T. Colborn, T. B. Hayes, J. J. Heindel, D. R. Jacobs, Jr., D. H. Lee, T. Shioda, A. M. Soto, F. S. vom Saal, W. V. Welshons, R. T. Zoeller, and J. P. Myers. 2012. Hormones and endocrine-disrupting chemicals: Low-dose effects and nonmonotonic dose responses. Endocrine Reviews 33(3):378-455.
Venegas-Caleron, M., O. Sayanova, and J. A. Napier. 2010. An alternative to fish oils: Metabolic engineering of oil-seed crops to produce omega-3 long chain polyunsaturated fatty acids. Progress in Lipid Research 49(2):108-119.
Ver Ploeg, M., V. Breneman, T. Farrigan, K. Hamrick, D. Hopkins, P. Kaufman, B-H. Lin, M. Nord, T.A. Smith, R. Williams, K. Kinnison, C. Olander, A. Singh, and E. Tuckermanty. 2009. Access to affordable and nutritious food measuring and understanding food deserts and their consequences: Report to Congress. Washington, DC: U.S. Department of Agriculture, Economic Research Service.
Wansink, B., and S. B. Park. 2001. At the movies: How external cues and perceived taste impact consumption volume. Food Quality and Preference 12(1):69-74.
Wansink, B., J. E. Painter, and J. North. 2005. Bottomless bowls: Why visual cues of portion size may influence intake. Obesity Research 13(1):93-100.
WCRF/AICR (World Cancer Research Fund/American Institute for Cancer Research). 2007. Food, nutrition, physical activity, and the prevention of cancer: A global perspective. Washington, DC: AICR.
Westerterp, K. R., and J. R. Speakman. 2008. Physical activity energy expenditure has not declined since the 1980s and matches energy expenditures of wild mammals. International Journal of Obesity 32(8):1256-1263.
Whitaker, R. C., S. M. Phillips, and S. M. Orzol. 2006. Food insecurity and the risks of depression and anxiety in mothers and behavior problems in their preschool-aged children. Pediatrics 118(3):e859-e868.
WHO (World Health Organization). 2013. State of the science of endocrine disrupting chemicals—2012: An assessment of the state of the science of endocrine disruptors prepared by a group of experts for the United Nations Environment Programme (UNEP) and WHO. Edited by A. Bergman, J. J. Heindel, S. Jobling, K. A. Kidd, and R. Thomas Zoeller. Geneva, Switzerland: WHO/United Nations Environment Programme.
Wilde, P., J. Llobrera, and N. Valpiani. 2012. Household food expenditures and obesity risk. Current Obesity Reports 1(3):123-133.
Young, L. R., and M. Nestle. 2007. Portion sizes and obesity: Responses of fast-food companies. Journal of Public Health Policy 28(2):238-248.
This page intentionally left blank.


