
Toxicological Priority Index (ToxPi)
The Toxicological Priority Index (ToxPi) was discussed in Chapters 7, 8, 9 and 12 as a tool for transparent integration and visualization of data across disparate information domains. While the committee’s charge did not call for making specific recommendations about computational approaches, a tool that clarifies and documents the judgment and trade-offs entering into an assessment is a big step toward transparency. ToxPi is a tool familiar to committee members and was implemented with an EPA grant to the Carolina Center for Computational Toxicology. A graphic user interface is at http://comptox.unc.edu/toxpi.php.
At some point in an assessment, decisions that prioritize/rank chemicals against each other will need to be made, as explained in Chapter 9. To this effect, ToxPi software (Reif et al. 2013) is an example of a prioritization support tool for integrating evidence across end points and visualizing the relative prioritized ranks of the compounds under consideration. ToxPi was proposed by Reif and colleagues in 2010 as a dimensionless index score that enables multiple sources of evidence on exposure and safety to be integrated and transformed into visual rankings that are transparent and facilitate decision making. Different data are translated into ToxPi scores for all compounds, as explained below, in the publications describing the approach (Reif et al. 2010), and the associated software package (Reif et al. 2013). ToxPi takes the entire realm of information that goes into a decision and reduces it to one number, which can be used to prioritize or rank. While reducing the various types of information into one number could obfuscate the underlying information that goes into producing the number, ToxPi provides a transparent visualization of both the rankings and the individual compound’s ToxPi score components.
CALCULATION OF TOXPI SCORES: CONGLOMERATION OF INFORMATION
ToxPi software calculates a unitless number that may be used for rank ordering chemicals being compared. First, the user needs to assemble the data that are intended to be integrated and analyzed by ToxPi into one data matrix, where columns are individual information types (e.g., numerical values of a chemical’s potency in a particular assay) and rows are the compounds to be compared. All data need to be in a numeric format, and qualitative scores must be converted to numerical values. For example, a summary description of a panel of bacterial mutagenicity assays that may be characterized with qualitative descriptors, “clearly mutagenic,” “ambiguous results” and “likely non-mutagenic” may be converted to the numerical values of 1, 0.5, and 0, respectively. Missing values (or alphanumeric entries) may remain in the matrix, and ToxPi visualization will report the percentage of the compounds with missing values for each data type integrated into one ToxPi “slice.”
Second, the user needs to define how the information will be integrated. In other words what “data domains” or categories best describe the available database in the context of the decision to be made? Figure C-1 shows the quantitative information types available for alternatives analysis. They may consist of several broad categories, such as chemical properties, in vitro assay data, exposure data, in vivo study results, and/or biological pathways perturbation. Within one or more of these broad categories, additional sub-categories may be defined, such as different types of nuclear receptors probed with several assays. In Figure C-2, the example shows how the estrogen receptor (ER) slice within a broad category, “in vitro assay data,” integrates data from six independent assay types.
Third, the data selected to be integrated into one slice are transformed into a slice score for each compound (Figure C-2).The values for each compound across all data columns to be integrated into one slice are summed up. The summed values are normalized to the interval [0,1] by dividing each compound’s result by the slice maximum. If the data being integrated into one slice represent relative potency (e.g., in vitro or other assays assays), values closer to the unit score (equal to 1) translate to higher potency. Conversely, values closer to the origin (equal to 0) translate to lower potency within
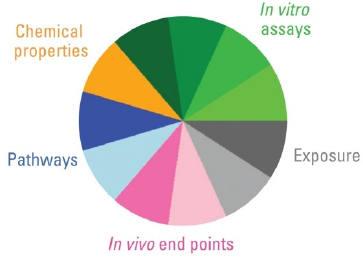
FIGURE C-1 Information types available for alternatives assessment. Reproduced with permission from Environmental Health Perspectives (Reif et al. 2010).
the corresponding data domain. Slices that do not extend at all from the origin represent “inactive/no activity.”
The ToxPi analysis also allows, but doesn’t require, data integration into a single slice. In the example shown in Figure C-2, the concentration-response curves for each of the six assays being integrated into one ER slice are shown for three example chemicals. On each concentration-response curve showed in Step 1, the red asterisk represents the AC50 (active concentration or “potency”) for each chemical’s activity in these assays, and flat blue lines indicate assays in which that chemical exhibited no activity. For the slices where information other than quantitative “potency” is to be integrated, the same procedure may be followed, with particular chemical property values, pathway scores, or other categorical values used to provide a notion of the “activity” of each compound relative to other compounds in this particular analysis. In addition, each data type may serve as its own slice; in that case, the normalization is performed on the actual values in the data column, rather than a sum of values across multiple columns.
Once each slice has been assembled and slice scores calculated, the scores for each slice are summed up to derive a final ToxPi score for each compound. These scores are then used to plot the relative rank of the compounds being compared (Figure C-3). The X-axis is the ToxPi score and the Y-axis is the relative rank. It is important to note that each ToxPi analysis is a relative comparison that yields ToxPi scores meaningful only when used in the context of both the compendium of the compounds included and the data with which they were analyzed.
In addition, the ToxPi charts for individual compounds (Figure C-3 left panel, insets overlaid onto the dot plot) can be easily visualized and downloaded either individually, or as a matrix (Figure C-3, bottom right panel). In Figure C-2, it is evident that HPTE is more potent in ER assays than is 2,4-D; this is shown visually by the HPTE slice that is extending farther from the origin than the slice for 2,4-D. The rankings can be used to compare chemical toxicity or assess the similarity of predicted compound activity. The value of ToxPi is that it provides explicit documentation of judgments and decisions made during the data integration step, thus providing the necessary documentation and clarity that is needed for transparency while still reducing the information to the point where it can be used for decision making. In essence, the explicit capturing and documentation at the stage of data integration enables scientific debate about either the science or the value judgments.
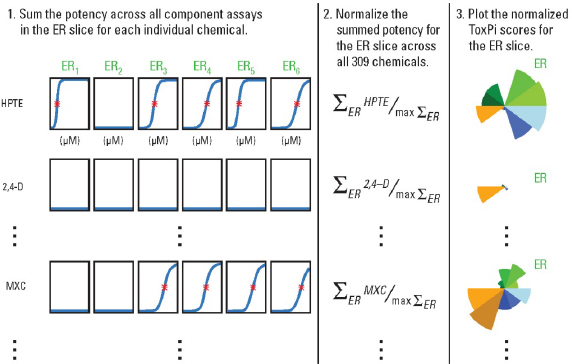
FIGURE C-2 Reproduced with permission from Environmental Health Perspectives (Reif et al. 2010).
USE OF TOXPI TO PERFORM AND TRANSPARENTLY COMMUNICATE DIFFERENTIAL WEIGHTING OF THE INFORMATION
Weighting, which is ultimately a value judgment, as discussed in Chapter 9 and elsewhere in this report, is frequently favored by the stakeholders performing or evaluating the alternatives assessments.
Examples of weighting factors frequently applied are:
- Weighting of end points within a domain (e.g., carcinogenicity weighted heavier than respiratory effects within the human health domain);
- Weighting between domains (e.g., human health effects weighted heavier than aquatic toxicity or human health effects weighted higher than resource use); and
- Weighting of different types of data (e.g., providing greater weight to the data from human studies, as compared to animal toxicity studies or in vitro assays).
The easiest way to analyze and visualize data with ToxPi is to not weight individual slices (e.g., data domains) differently. For example, in Figure C-3, each slice is of equal weight, which is evident from equal division of the ToxPi into slices that have the same width (in radians), indicating no preferential weighting of any slice in the overall ToxPi calculation. In the implementation presented in Figures C-2 and C-3, each of the 10 slices is weighted equally, so each is 36 degrees in width.
Alternative weighting schemes that differentially emphasize the information represented by the individual ToxPi slice(s) may also be performed. ToxPi software (v 1.3 or higher) allows for applying weight factors to each slice, which introduces an additional coefficient to the calculation of the overall ToxPi score for each compound. This information is easy to convey through ToxPi graphs, which will display different widths (in radians) of the slices. Two examples of the effect that value judgment-based differential weighting of the information may have on the outcome of data integration are illustrated in Chapter 12 (see Figures 12-9 and 12-10).
USE OF TOXPI TO CAPTURE UNCERTAINTIES IN THE RELATIVE RANKINGS OF COMPOUNDS
Two types of confidence limits are calculated by ToxPi software: (i) the uncertainty in the relative size (from 0 to 1) of each individual slice if multiple data types were integrated into one slice; and 2) the
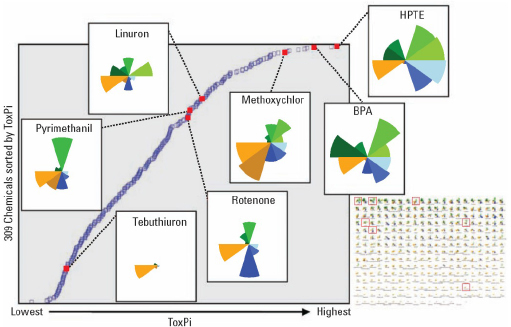
FIGURE C-3 ToxPi scores are used to plot relative rank of compounds (Y axis) and ToxPi score (X axis). Reproduced with permission from Environmental Health Perspectives (Reif et al. 2010).
confidence intervals on the overall ToxPi score and the relative rank of each compound in a given comparison. The former are displayed on the ToxPi chart for the individual agents (Figure C-4A) and the latter are displayed on the dot plot of the ranked compounds (Figure C-4B).
ToxPi software addresses the uncertainty around the data by calculating confidence intervals and scaling by bootstrap sampling57 of the component values (source data) within each slice. If multiple data columns were integrated into a slice, the numerical values within each slice are sampled with replacement, and these resampled values are used to calculate a bootstrap ToxPi statistic. The bootstrap ToxPi statistic is calculated exactly as the original statistic, but on the resampled data. This process is repeated 1,000 times, and these 1,000 or more bootstrap statistics are used to assess the stability of the estimated ToxPi score for the chemical. In particular, a 95% confidence interval for the ToxPi score is generated in the standard way: the lower bound is given by the 2.5 percentile in the bootstrap statistics and the upper bound is given by the 97.5 percentile of the bootstrap statistics. These bounds are visualized as dashed lines within each slice where bootstrapping was possible (Figure C-4A). Intuitively, the width of the confidence interval for a chemical depends on the amount of variability within each slice. The ToxPi score will have a narrow confidence interval if the assay values within a slice are very similar and a wide confidence interval if the assay values within a slice are very different. The bootstrapping approach does not make any assumptions regarding the distribution of the data values, and should give appropriate confidence intervals in most contexts. However, there is a possibility that confidence intervals generated using the approach described here may be unreliable in the following situations: if the measurements within each slice are on dramatically different scales (while different scales can be combined within ToxPi, individual slices are best used to represent similar/related data); if there are just a small number of assays within each slice; and if there are extreme values (outliers) in the data.
The uncertainty of the ToxPi score and relative rank are calculated in a way identical to that for the confidence interval for each slice. The confidence intervals are visualized (Figure C-4B) as horizontal and vertical bars. Along the X-axis, the bootstrapped confidence intervals in an overall ToxPi score for a particular chemical are displayed. Along the Y-axis, the bootstrapped confidence intervals in the relative rank of a specific chemical are displayed.
_____________
57 Bootstrapping is a statistical approach for assigning measures of accuracy to sample estimates, using resampling methods.
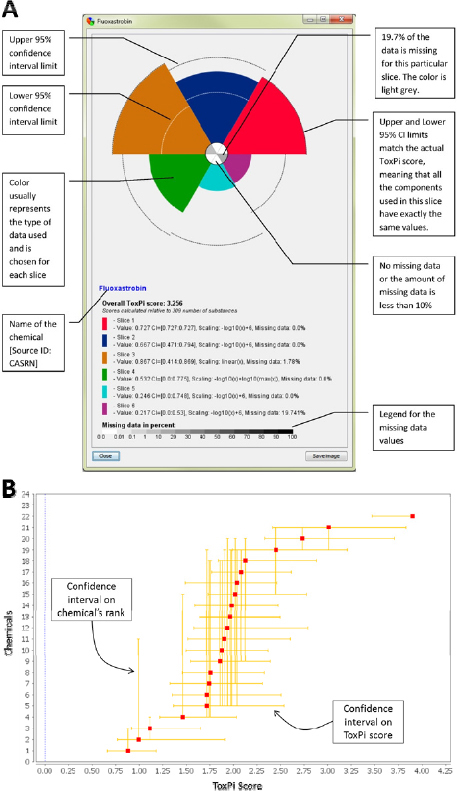
FIGURE C-4 ToxPi confidence intervals. A: Uncertainty in size of each slice. B: Confidence intervals in overall ToxPi score and relative rank of each compound.
REFERENCES
Reif, D.M., M.T. Martin, S.W. Tan, K.A. Houck, R.S. Judson, A.M. Richard, T.B. Knudsen, D.J. Dix, and R.J. Kavlock. 2010. Endocrine profiling and prioritization of environmental chemicals using ToxCast data. Environ. Health Perspect. 118(12):1714-1720.
Reif, D.M., M. Sypa, E.F. Lock, F.A. Wright, A. Wilson, T. Cathey, R.R. Judson, and I. Rusyn. 2013. ToxPi GUI: An interactive visualization tool for transparent integration of data from diverse sources of evidence. Bioinformatics 29(3):402-403.


