
What has happened is history. What might have happened is science and technology. So what you are really interested in is what might have happened if you could do it all over again.
John W. Tukey, 18 November 1992, in a
discussion of assessing the uncertainty in cancer
mortality rates at the National Cancer Institute
Both the Receiver Operating Characteristic (ROC) and the confidence–accuracy relationship involve data (usually, as the proportions of participants in a given study that meet some criterion) and hence are subject to various sources of uncertainty, including measurement error, random variations from external conditions, and biases (such as the tendency to respond “conservatively” or “liberally”; see examples of these biases in Chapter 5). Appendix C focuses on quantification of uncertainty in some of the errors caused by measurement and other random sources. Because the confidence-based ROC curve is justified by an implicit assumption that confidence and accuracy are related, the first section of this appendix discusses the incorporation of uncertainty when assessing the strength of the confidence–accuracy relationship, and the second section does the same for the ROC curve. In what follows, HR denotes the hit rate (or “sensitivity” of a procedure on which the confidence–accuracy relationship or ROC is
being constructed), and FAR (or, 1 – specificity; see Chapter 5) denotes the false alarm rate.1
CONFIDENCE–ACCURACY RELATIONSHIP
When authors talk about the confidence–accuracy relationship, they usually are referring to a correlation coefficient or to a slope of the line fitted to the points (C, A), where a measure of the eyewitness’ expressed confidence level C is on the x-axis, and a measure of the witnesses’s accuracy A is on the y-axis. However one measures the significance of the confidence–accuracy relationship (e.g., in either a correlation coefficient or a slope of the line fitted to the [C, A] points), it is important to note that both expressed confidence level (C) and reported accuracy (A) are based on data and thus are subject to uncertainty, both from random and systematic sources of variation and from biases (see, e.g., Chapter 5 for examples of biases and other variables, such as the type of lineup procedure). In this appendix, we consider the effects of uncertainty in only “A” and “C” in assessing the strength of the confidence–accuracy relationship. Ideally, one would repeat the incident multiple times and assess the error in the repetitions. Unfortunately, such repetition is usually not possible, and one must rely on approximate measures of uncertainty with regard to the (C, A) points. Approaches for characterizing the uncertainty in the confidence–accuracy relationship, using data in the published literature, follow.
Consider the following data:2
1) n1 = 44 participants who expressed “Low” confidence (confidence ratings 1,2,3); their overall accuracy was stated as 61%. Taking the median of these three confidence ratings, C1 = 2 and A1 = 0.61. The estimated standard error of this proportion is (0.61 · 0.39/44)1/2 = 0.0735.
_______________
1The data cited here are used for convenience, as the source publications provided sufficient details about the illustrations.
2These data are cited in H. L. Roediger III, J. T. Wixted, and K. A. DeSoto. “The Curious Complexity Between Confidence and Accuracy in Reports from Memory” in Memory and Law, ed. L. Nadel and W. P. Sinnott-Armstrong (Oxford: Oxford University Press, 2012), p. 109, who in turn cite Odinot, Wolters, and van Koppen [G. Odinot, G.Wolters, and P. J. van Koppen, “Eyewitness Memory of a Supermarket Robbery: A Case Study of Accuracy And Confidence after 3 Months,” Law and Human Behavior 33: 506–514 (2009)] as the source of these data, from nine “central witnesses” (five other witnesses were not interviewed by the police). The sample sizes (44, 203, 326) apparently arise from having “averaged across different categories (person descriptions, object descriptions, and action details) for the nine central witnesses interviewed in that study”; see J. T. Wixted et al., “Confidence Judgments Are Useful in Eyewitness Identifications: A New Perspective,” submitted to Applied Psychology 2014, p. 17.
2) n2 = 203 participants who expressed “Medium” confidence (confidence ratings 4,5,6); their overall accuracy was stated as 71%. Taking the median of these three confidence ratings, C2 = 5 and A2 = 0.71. The estimated standard error of this proportion is (0.71 · 0.29/203)1/2 = 0.0318.
3) n3 = 326 participants who expressed “High” confidence (confidence rating 7); their overall accuracy was stated as 85%. Thus, C3 = 7 and A3 = 0.85. The estimated standard error of this proportion is (0.85 · 0.15/326)1/2 = 0.0198.
A plot of these three data points might suggest a highly convincing relationship between accuracy and confidence. However, the relationship is not “statistically significant” when assessed via a weighted linear regression (where weights are inversely proportional to either the standard errors or the variances), nor via an unweighted Pearson correlation coefficient or a Spearman’s rank correlation coefficient (which depends less on the assignment of “Low,” “Medium,” and “High” as 2, 5, 7, respectively, than do the other two methods). Separate tests comparing the proportions 0.85 (“High”) versus either 0.71 (“Medium”) or 0.61 (“Low”) are “statistically significant,” but not the test for comparing the proportions 0.71 (“Medium”) and 0.61 (“Low”). Statistical significance is difficult to achieve with only three data points. Moreover, none of these tests takes into account the potential for error in the self-reported “C” values (2,5,7), which, as discussed in the previous paragraph, is likely to exist.
Consider a second set of data, reported in Juslin, Olsson, and Winman.3 In this article, the authors considered two lineup conditions, denoted as “suspect-similarity” and “culprit-description.” The authors correctly note that the identification rates at each expressed confidence level for these two conditions are very similar; hence, as the condition had no effect on identification accuracy, one might as well pool “successes/trials” across the two conditions to reduce the uncertainty in each of the accuracy rates and thus gain greater power.
Even after combining the two conditions, however, the numbers of trials in the 10 ECL categories (0.1 = “10% confident,” 0.2 = “20% confident” … 1.0 = “100% confident”) are not very high (the 10 numbers range from 7 for ECL = 20% to 45 for ECL = 90%). To increase the chances of seeing a meaningful relationship between confidence and accuracy, the authors pool 0.1 with 0.2, 0.3 with 0.4, 0.5 with 0.6, 0.7 with 0.8, and 0.9 with
_______________
3P. Juslin, N. Olsson, and A. Winman, “Calibration and Diagnosticity of Confidence in Eyewitness Identification: Comments on What Can Be Inferred from the Low Confidence-Accuracy Correlation,” Journal of Experimental Psychology: Learning, Memory, and Cognition 22(5): 1304–1316 (September 1996).
1.0. Although Table 2 in Juslin, Olsson, and Winman provides the counts (numbers of trials), it does not tabulate the accuracies (numbers of correct responses). One can estimate these accuracies by weighted averages of the displayed percentages shown in the plots in their Figure 24 for the “suspect-similarity condition” (“A” = 0.27, 0.38, 0.51, 0.55, 0.87; n = 15, 21, 25, 29, 51) and for the “culprit-description condition” (“A” = 0.18, 0.66, 0.63, 0.90, 0.91; n = 10, 18, 28, 41, 37). In the confidence level categories (15%, 35%, 55%, 75%, 95%), the accuracies (with their standard errors and the total sample sizes on which they are based following them in parentheses) are, respectively, 23.4% (8.5%, n = 25), 50.9% (8.0%, n = 39), 52.6% (6.9%, n = 53), 75.5% (5.1%, n = 70), and 88.7% (3.4%, n = 88). For these data, both the unweighted correlation coefficient, 0.9766 (t-statistic = 7.865, p-value 0.004), and the slope of the weighted linear regression (points weighted inversely proportional to their standard errors), 0.773 (standard error 0.085, p-value 0.003), are statistically significant, in that such convincing data of a relationship between correlation and accuracy would be unlikely to arise if, in fact, no association existed.
Another method for assessing the significance of the unweighted correlation is through the simulation of a large number of trials on the basis of the data that were observed. For each trial, one can first simulate five confidence values, uniformly distributed between the endpoints that were observed: c1 is uniformly distributed between (0.05, 0.25) (mean is the observed 0.15); c2 is uniformly distributed between (0.25, 0.45) (mean is the observed 0.35); … c5 is uniformly distributed between (0.85, 1.00). Next, one simulates five proportions using the observed conditions: a1 is a binomial variate (n = 25, p = 0.234) divided by n = 25; a2 is a binomial variate (n = 39, p = 0.509) divided by n = 39; … a5 is a binomial variate (n = 88, p = 0.887) divided by n = 88. For each trial with five simulated c values and their five corresponding a values, one calculates a Pearson correlation coefficient. Figure C-1 shows a plot of the five data points, with limits of one standard error on the estimated accuracies (left panel) and the histogram of the 1,000 simulated Pearson correlation coefficients (right panel). The median is 0.9534 (close to the observed 0.9766), the upper and lower quartiles are 0.916 and 0.977, and the central 90% of the 1,000 values lie between 0.8650 and 0.993. Thus, an approximate 90% confidence interval for the true correlation coefficient (0.865, 0.993) definitely does not include zero, a further indication of the significance of the Pearson correlation coefficient.
The example above illustrates the importance of incorporating known uncertainty in the estimated accuracy for the confidence level category. The relationship between confidence and accuracy should take into account (1)
_______________
4See pages 1310–1311 of Juslin, Olsson, and Winman for the data in their Table 2 and Figure 2, respectively.
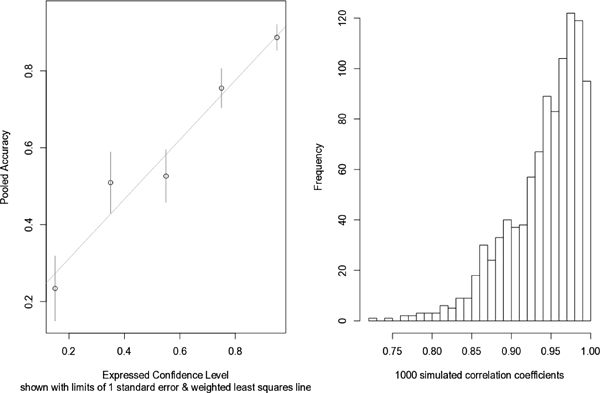
FIGURE C-1 Data Inferred from Juslin, Olsson, and Winman.
NOTE: Adapted from Juslin, Olsson, and Winman, “Calibration and Diagnosticity of Confidence in Eyewitness Identification.” The left panel plots confidence-accuracy data from p. 1311. Data are pooled into five categories; accuracies are inferred from p. 1313. Data are shown with limits of one standard error and weighted least squares regression line. The right panel is a histogram of 1000 simulated Pearson correlation coefficients, using data from 5 categories shown in right panel. The central 90% of the simulated values lie between 0.853 and 0.993, indicating that the true unweighted Pearson correlation coefficient is significantly different from zero. Courtesy of Karen Kafadar.
the repeated responses of a limited number of “eyewitnesses” in the study and (2) the uncertainty in an eyewitness’ “expressed confidence level.” The 2009 National Research Council report, Strengthening Forensic Science in the United States: A Path Forward, cited studies in which fingerprint examiners reached different conclusions when presented with exactly the same evidence at a later time.5 Quite possibly, in many of these laboratory studies on which these confidence–accuracy relationships are based, participants
_______________
5National Research Council, Strengthening Forensic Science in the United States: A Path Forward (Washington, DC: The National Academies Press, 2009), p. 139.
may express different levels of confidence if presented with exactly the same set of circumstances and procedures 6 months later.
The existing literature varies in its assessment of the significance of the confidence–accuracy relationship, with some articles suggesting a very strong relationship and many others suggesting that the relationship is weak or nonexistent. The lack of significance in the confidence–accuracy relationship may result from other factors not taken into account. For example, Smalarz and Wells suggest that restricting the plot to only those data corresponding to “choosers” may strengthen the relationship.6 Other factors that might affect the relationship include the presence or absence of weapon, the level of stress during the incident, and the length of exposure to the perpetrator. Roediger and colleagues state that
the simple assumption usually made that confidence and accuracy are always tightly linked is wrong…the relation between confidence and accuracy depends on the method of analysis, on the target material being remembered, on who is doing the remembering, and (in situations where memory is tested by recognition) on the nature of the lures and distractors. In addition, there is more than one way to measure the relationship between confidence and accuracy, and not every way is equally relevant to what courts of law would like to know about the issue.7
Studies that incorporate numerous variables, as well as soliciting a confidence statement at various times (e.g., immediately, or 10 minutes after the incident, or 1 hour after the incident), would be valuable.
RECEIVER OPERATING CHARACTERISTIC ANALYSIS
A receiver operator characteristic (ROC) is a reliable, time-honored assessment of test performance. ROC has been used for decades in the medical test diagnostic literature. Conventionally, as noted in Chapter 5, two procedures were compared using a single diagnosticity ratio: DR = HR/FAR = hit rate/false alarm rate, or sensitivity / (1 – specificity). Wixted and colleagues observed that the diagnosticity ratio, DR, can vary depending
_______________
6L. Smalarz and G. L. Wells, “Eyewitness Certainty as a System Variable,” in Reform of Eyewitness Identification Procedures, ed. B. L. Cutler (Washington, DC: American Psychological Association, 2013), 161–177.
7Roediger, Wixted, and DeSoto, “The Curious Complexity Between Confidence and Accuracy in Reports from Memory.
on an eyewitness’ ECL and hence proposed the use of an ECL-based ROC curve to compare two lineup procedures (simultaneous versus sequential).8
The ECL-based ROC curve for a given procedure (e.g., simultaneous) is constructed as follows:
1) Collect participants in a study and subject them to the experimental conditions.
2) For each participant, record whether she or he accurately selected the correct suspect or accurately passed over the filler and the expressed confidence level in the decision.
3) Collect all the responses for participants who answered “100% confident” (say, n1 of them) and record the combined FAR (false alarm rate, or 1 – specificity) and HR (hit rate, or sensitivity) across n1 participants (FAR1, HR1).
4) Repeat step 3 for all participants who answered “90% confident” (or higher; say, n0.9 of them), resulting in the data pair (FAR0.9, HR0.9).
5) Repeat step 3 for all participants who answered “80% confident” (or higher; say, n0.8), resulting in the data pair (FAR0.8, HR0.8).
6) Continue to repeat step 3 for the groups of participants who answered “70% confident” … “10% confident” (or higher; say, n0.7… n0.1 of them).
7) Plot the 10 data pairs, (FAR1, HR1), …, (FAR0.1, HR0.1).
This plot results in the ROC curve, whose points (HR, FAR) correspond to different ECLs.
The plotted points usually are connected by straight lines, and the slope of the ROC curve at each of those plotted points represents the DR corresponding to that confidence category. The ROC curve illustrates the separate DRs rather than calculating a single DR collapsed across all confidence categories. As with the confidence–accuracy relationship, it is important to recognize the uncertainty in the estimated (FAR, HR) data points. How does the uncertainty in FAR and HR, and hence in the diagnosticity ratio (DR = HR/FAR), translate into uncertainty into the ROC curve?
The effect of uncertainty in estimates of HR, FAR, DR (= HR/FAR) on the ROC curve can be seen by simulating new HR and FAR rates,
_______________
8L. Mickes, H. D. Flowe, and J. T. Wixted, “Receiver Operating Characteristic Analysis of Eyewitness Memory: Comparing the Diagnostic Accuracy of Simultaneous and Sequential Lineups,” Journal of Experimental Psychology: Applied 18: 361–376 (2012). See especially pp. 362–365 for a description of ROC analysis in the medical literature and applied to the eyewitness identifications.
assuming that the observed HR and FAR rates are true “means” from the simulated distributions. As a first example, consider the set of data from Brewer and Wells9 which is cited by Mickes, Flowe, and Wixtedin their Table 1.10 The data are: HR = (.090,.237,.320,.355,.370); FAR = (.002,.015,.030,.038,.041), leading to five diagnosticity ratios (rounded) DR = (45,16,11,9,9). The article states that the experiment involved 1,200 participants.
As above, one can simulate each of the five hit rates and the five false alarm rates, with 4,000 independent trials and 1,200 participants, in such a way that the means of the five distributions of hit rates (HRs) and the means of the five distributions of false alarm rates (FARs) equal the values observed in the experiment [e.g., 0.090, 0.237, 0.320, 0.355, 0.370 for HR and (0.002, 0.015, 0.030, 0.038, 0.041) for FAR], leading to five distributions of 4,000 diagnosticity ratios (HR/FAR). For example, consider simulating 1,200 individuals whose HR is 0.090 = 9.0%. One expects that, on average, about (9%) × 1,200 = 108 of the simulated 1,200 participants will have “hits.” When repeating this trial of 1,200 individuals, the number might be 110, or 95, or some other number around, but usually not exactly, 108. Repeating the trial 4,000 times, one can average the 4,000 numbers (e.g., 108, 110, 95…) and divide by 1,200, yielding a mean simulated HR. The advantage is that one can also use the 4,000 numbers to calculate a standard deviation.11 One repeats exactly the same exercise for the five FAR rates, yielding a mean FAR and a standard deviation, SDFAR. As noted in Chapter 5, in real life, HR and FAR will be estimated on the same set of 1,200 participants, so the two numbers, HR and FAR, in the five (HR, FAR) pairs, will be correlated. In the simulation, HR and FAR are independent, so the estimated uncertainties are likely to be optimistic; the real uncertainties could well be larger. One can then plot three sets of points (each set contains five points): (1) (mean HR, mean FAR) (this plot should look qualitatively similar to the one in Figure 6(A) in Mickes, Flowe and Wixted;12 (2) (mean HR − SDHR, mean FAR − SDFAR) [these points should lie somewhat below the points plotted in (1)[; and (3) (mean HR + SDHR, mean FAR + SDFAR) [these points should lie somewhat above the points plotted in (1)].
_______________
9N. Brewer and G. L. Wells, “The Confidence-Accuracy Relationship in Eyewitness Identification: Effects of Lineup Instructions, Foil Similarity, and Target-Absent Base Rates,” Journal of Experimental Psychology: Applied 12(1): 11–30 (2012) (as cited by Mickes et al., Table 1, p. 367).
10Mickes, Flowe, and Wixted, p. 367.
11Or Standard Deviation Hit Rate (SDHR), which also can be obtained from standard formulas for the standard deviation of the binomial distribution. See G. Snedecor and W. Cochran, Statistical Methods, Sixth Ed. (Ames, Iowa: Iowa State University Press, 1967).
12Mickes, Flowe, and Wixted, p. 371.
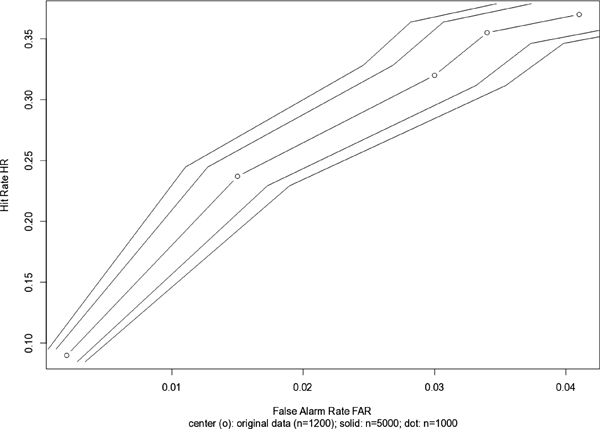
FIGURE C-2 Data from Brewer and Wells.
NOTE: Adapted from Brewer and Wells, “The confidence-accuracy relationship in eyewitness identification.” The data are cited by Mickes, Flowe, and Wixted, “Receiver Operating Characteristic Analysis of Eyewitness Memory.” Courtesy of Karen Kafadar.
Figure C-2 shows bands of one standard error in both HR and FAR, illustrating one source of uncertainty in the ROC curve due to estimating HR and FAR. The same approach to calculating uncertainties was used for the two sets of (HR, FAR) values given by the “simultaneous” and “sequential” data in Mickes, Flowe, and Wixted, Table 3.13 The text indicates that Experiment 1A used n = 598 participants, so the simulation assumed n = 600. In Figure C-3, “M” refers to “siMultaneous,” and “Q” refers to “seQuential.” Note that the “M” and “Q” points fall roughly in the same pattern as in Mickes, Flowe, and Wixted’s Figure 6A.14 Note the substantial overlap in the bands of “one standard deviation” surrounding each of the data points, indicating no “statistically significant” differences between the “M” (simultaneous) and “Q” (sequential) points.15 If one were to take
_______________
13Ibid, p. 372.
14Ibid, p. 371.
15The bands of two standard deviations would overlap even more.
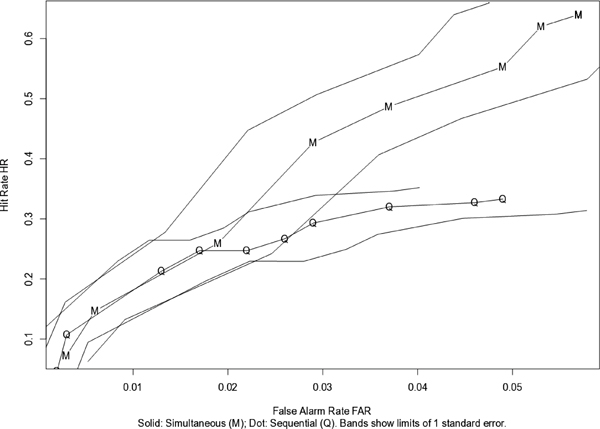
FIGURE C-3 Data from Experiment 1A in Mickes, Flowe, and Wixted.
NOTE: Adapted from Mickes, Flowe, and Wixted, “Receiver Operating Characteristic Analysis of Eyewitness Memory.” Courtesy of Karen Kafadar.
into account the effects of using the same eyewitness in the same study with different responses to different tasks, the variability would be even larger.
When the same exercise is repeated for the data in Experiment 2 (n=631), similarly ambiguous results (see Figure C-4) are obtained. As Mickes and colleagues suggest, the differences between simultaneous and sequential are even less impressive, and especially so once bands of one standard errors around the points are shown.
These further analyses on these published data sets suggest the following conclusions.
1) The strength of the confidence-accuracy relationship involves uncertainty in the measures of both A (accuracy) and C (confidence), as well as other factors that can influence the relationship.
2) A ROC curve incorporates more information than a single DR (diagnosticity ratio = HR/FAR) using a third variable [different test thresholds in the medical literature; in the present context, different expressed confidence levels (ECLs); i.e., HR and FAR at
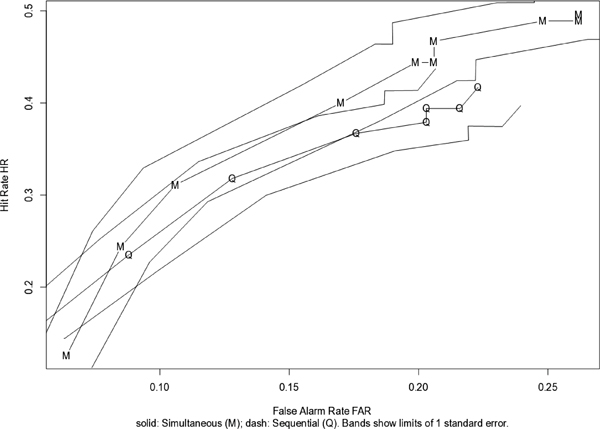
FIGURE C-4 Data from Experiment 2 in Mickes, Flowe, and Wixted.
NOTE: Adapted from Mickes, Flowe, and Wixted, “Receiver Operating Characteristic Analysis of Eyewitness Memory.” Courtesy of Karen Kafadar.
different expressed confidence levels]. As is true with any data, the data from which a ROC is constructed (FARs, HRs, expressed confidence levels) have uncertainty, and that uncertainty is passed on to the ROC. A comparison of two ROCs without recognizing that uncertainty can be misleading. As with any tool, one must be careful in how one draws inferences when comparing ROC curves.
3) Other methods for comparing two procedures (in which the outcome is a binary classification such as “identification” / “no identification” of an individual) exist in other literature.16
These analyses considered only the most obvious form of random measurement error. The ROC may be influenced by other sources of bias; these sources are not considered or displayed in the plots shown here (see Chapter 5). Also, the ROC curve takes into consideration only the prob-
_______________
16See, e.g., T. Hastie, R. Tibshirani, and J.H. Friedman, The Elements of Statistical Learning: Data Mining, Inference, and Prediction (New York: Springer, 2009) for a discussion on classification and evaluation methods of statistical machine learning research.
ability that an eyewitness who makes a positive identification of a suspect has correctly identified the true culprit (positive predictive value); it does not take into consideration the rule-out probability that an eyewitness who fails to make an identification of a suspect has correctly recognized that the suspect is not the true culprit (negative predictive value) (see Chapter 5).
ALTERNATIVE ANALYSIS TO CONFIDENCE-BASED ROC FOR COMPARING PROCEDURES
As noted in Chapter 5, the diagnosticity ratio [hit rate/false alarm rate = HR/FAR = sensitivity/(1 – specificity)] can depend not only on an eyewitness’ tendency toward “conservative” or “liberal” identification (as measured by expressed confidence level), but also on numerous other factors, including: (1) lineup procedure (e.g., two levels: simultaneous versus sequential); (2) presence or absence of a weapon (two levels; more levels could be considered, such as gun, knife, towel, none); (3) stress (e.g., three levels: high, medium, low); (4) elapsed time between incident and exam (e.g., three levels: 30 min, 2 hours, 1 day); (5) race difference (e.g., two levels: same or different race or four levels: eyewitness/culprit = white/white; white/non-white; non-white/white; non-white/non-white; non-white/white); (6) participant (e.g., N levels, corresponding to N participants).
If a study is sufficiently large, one could develop a performance metric for each participant in the study corresponding to each of these conditions. For example, one could construct a ROC curve and calculate as the performance metric the logarithm of the area under the curve, or log(AUC), for each person and each condition in the study. One could also use as a performance metric the logarithm of the odds (log odds) of a correct decision; e.g., log(HR/(1-HR)) or log((1-FAR)/FAR).
Consider the following approach:
Let yijklmnr denote the log(AUC) or a log odds (or another performance metric) for the rth trial using participant n (n = 1, …,N) for procedure i, weapon level j, stress level k, time condition l, and cross-race effect m.17 One could write:
yijklmnr = μ + αi + βj + γk + δl + φm + (αβ)ij + …(interactions)… + εijklmnr
_______________
17When the performance metric is a log odds, this model is known as logistic regression; see, e.g., F. Harrell, Regression Modeling Strategies (New York: Springer-Verlag, 2001). A model where the performance metric is log(AUC) was studied by F. Wang and C. Gatsonis. See F. Wang and C. Gatsonis, “Hierarchical Models for ROC Curve Summary Measures: Design and Analysis of Multi-Reader, Multi-Modality Studies of Medical Tests,” Statistics in Medicine 27: 243-256 (2008).
where μ represents the overall average log(AUC) or log odds across all conditions, the next six terms reflect the main effects of A (lineup procedure: i = 1 for sequential and i = 2 for simultaneous); B (weapon: j = 1 for presence and j = 2 for absence of weapon); C (stress level: k = 1 for low, k = 2 for medium, k = 3 for high); D (elapsed time between incident and report: ℓ= 1 for 30 minutes, ℓ = 2 for 2 hours, ℓ = 3 for 1 day); E (cross-race effect: m = 1 for same race and m = 2 for different races); F (participant effect: n = 1, 2, …,N participants); “(interactions)” reflects the joint effect of two or more factors together; and the last term, εijklmnr represents any random error in the rth trial that is not specified from the previous terms (e.g., measurement, ”ECL,” multiple trials). This approach would allow one to separate the effects of the different factors, to assess which factors have the greatest influence on the outcome (here, logarithm of the area under the ROC curve: bigger is better), and to evaluate the importance of these factors relative to variation among “eyewitnesses.” It may be that eyewitnesses are the greatest source of variability, dominating the effects of all other factors. Or it may be that, in spite of person-to-person variability, one or more factors still stand out as having strong influence on the outcome. Note that (1) other covariates could be included, such as age and gender of participant; and (2) the ROC curve need not be defined in terms of expressed confidence level thresholds if a more sensitive measure of response bias (tendency toward “liberal” versus “conservative” identifications) can be developed.
For example, C. A. Carlson and M. A. Carlson18 use partial area under the curve, or pAUC, as a summary measure of the information in an ROC curve (bigger is better), for each of twelve different conditions defined by three factors: (1) Procedure, three levels: simultaneous (SIM: suspect in position 4), sequential (SEQ2: suspect in position 2), sequential (SEQ5: suspect in position 5); (2) Weapon focus, two levels: present versus absent; (3) Distinctive feature, two levels: present versus absent. The data are provided in their Table 3, along with 95% confidence intervals.19 Because the length of a confidence interval is proportional to the standard error, pAUC values with shorter confidence intervals correspond to smaller standard errors and hence should have higher weights. The logarithms of the reported pAUC values and weights (reciprocals of the lengths of the reported confidence intervals) are given below in Table C-1.
For the Carlson study, the data on all N = 2,675 participants (720 undergraduates and 1,955 SurveyMonkey respondents) were combined, and
______________
18C. A. Carlson and M. A. Carlson, “An Evaluation of Lineup Presentation, Weapon Presence, and a Distinctive Feature Using ROC Analysis,” Journal of Applied Research in Memory and Cognition 3(2): 45–53 (2014).
19Ibid., p. 49.
TABLE C-1 Conditions and Logarithms of Reported pAUC Valuesa
| Condition | Procedure | Weapon | Feature | 5 + log(pAUC) | Weight |
| 1 | SIM | Yes | Yes | 1.31112 | 47.6 |
| 2 | SIM | Yes | No | 1.72983 | 33.3 |
| 3 | SIM | No | Yes | 0.92546 | 55.6 |
| 4 | SIM | No | No | 1.87643 | 45.5 |
| 5 | SEQ2 | Yes | Yes | 1.49344 | 47.6 |
| 6 | SEQ2 | Yes | No | 1.22774 | 47.6 |
| 7 | SEQ2 | No | Yes | 1.08798 | 52.6 |
| 8 | SEQ2 | No | No | 1.58875 | 41.7 |
| 9 | SEQ5 | Yes | Yes | 1.70316 | 38.5 |
| 10 | SEQ5 | Yes | No | 0.98262 | 58.8 |
| 11 | SEQ5 | No | Yes | 0.65719 | 66.7 |
| 12 | SEQ5 | No | No | 1.49344 | 55.6 |
aAdapted from data on pAUC from Table 3 in C. A. Carlson and M. A. Carlson. “An Evaluation of Lineup Presentation, Weapon Presence, and a Distinctive Feature Using ROC Analysis,” Journal of Applied Research in Memory and Cognition 3(2): 45–53 (2014). The addition of “5” to log(pAUC) is simply to avoid negative numbers; the inferences from the analysis remain unchanged. Courtesy of Karen Kafadar.
expressed confidence levels were solicited on a 7-point scale. Variations in the twelve log(pAUC) values can be decomposed into three main effects (one each for procedure, weapon, and feature), and their two-way interactions. (The raw data may permit a more detailed analysis.) The data can be analyzed using a less complex model than that stated above (because the model has fewer terms):
yijk = μ + αi + βj + γk + (αβ)ij + (αγ)ik + (βγ)jk + εijk
where yijk denotes (5 + log(pAUC)) for procedure i (i = 1, 2, 3), weapon condition j (j = 1, 2), and feature k (k = 1, 2); μ represents the overall average log(pAUC) across all conditions; αi represents the effect of procedure i; βj represents the effect of weapon condition j; γk represents the effect of feature condition k; and the next three terms reflect the three two-factor interactions between the main factors. The analysis of variance, where log(pAUC) values are weighted according to the values in the last column of Table C-1, is given in Table C-2 below. None of the factors is significant.20 It must be stressed that the complete set of raw data may yield a more powerful analysis with different results, as might a different summary measure of the ROC curve, such as AUC, or area under the ROC curve.21
_______________
20We can decompose the two degrees of freedom in the sum of squares for Procedure (three levels), 8.04, into two single degree of freedom contrasts, SEQ2 versus SEQ5 (4.14), and sim versus the average of SEQ2 and SEQ5 (3.90), and consider all pairwise interaction terms among the four “main effects.” All single degree-of-freedom effects remain non-significant, in either this weighted analysis or in an unweighted analysis.
21For a discussion of the advantages and disadvantages of using AUC versus pAUC as a summary measure, see S. D. Walter, “The Partial Area Under the Summary ROC Curve,” Statistics in Medicine 24(13): 2025–2040 (July 2005).
TABLE C-2 Analysis of Variance Table for log(pAUC)a
| Source of Variation | Degrees of Freedom | Sum of Squares | Mean Square | F-statistic | p-value |
| Procedure | 2 | 8.04 | 4.02 | 1.129 | 0.470 |
| Weapon | 1 | 2.94 | 2.94 | 0.826 | 0.460 |
| Feature | 1 | 14.72 | 14.72 | 4.138 | 0.179 |
| Procedure×Weapon | 2 | 0.59 | 0.30 | 0.083 | 0.923 |
| Procedure×Feature | 2 | 10.41 | 5.21 | 1.463 | 0.406 |
| Weapon×Feature | 1 | 34.80 | 34.80 | 9.780 | 0.089 |
| Residuals | 2 | 7.12 | 3.56 | ||
aAdapted from data on pAUC from Table 3 in C. A. Carlson and M. A. Carlson. “An Evaluation of Lineup Presentation, Weapon Presence, and a Distinctive Feature Using ROC Analysis,” Journal of Applied Research in Memory and Cognition 3(2): 45–53 (2014). Courtesy of Karen Kafadar.


