
NSF was created as an independent federal agency by Congress in 1950, and assigned the mission of supporting research and education for all fields of fundamental science and engineering, except medical sciences, for the purpose of advancing the progress of science while benefitting the nation. Rather than employ its own researchers, NSF supports researchers and educators in their home institutions—colleges, universities, K-12 school systems, businesses, and research and science organizations—throughout the United States through grants and cooperative agreements.
NSF provides funding after receiving proposals requesting specific amounts of support for well-defined, meritorious projects, usually submitted by applicants in response to various NSF funding opportunities announced on the NSF website. A merit review process is used to select proposals for funding from the more than 42,000 proposals currently received yearly by NSF in all its programs. With an annual budget slightly more than $7 billion in FY 2015, NSF funds on the order of 200,000 scientists, engineers, educators and students, and laboratories and field sites yearly.1
NSF is organized into seven directorates: Biological Sciences; Computer and Information Science and Engineering; Education and Human Resources; Engineering; Geosciences; Mathematical and Physical Sciences; and Social, Behavioral and Economic Sciences. Within the NSF Directorate for Engineering are five Divisions, one of which is the Division of Industrial Innovation & Partnerships (IIP), which is home to a portfolio of partnership programs—including the SBIR and the STTR
___________________
1National Science Foundation website, <http://www.nsf.gov/>. Website was accessed on April 27, 2015.
programs—which aim at advancing technological innovation across all disciplines for high impact through commercial development, including the SBIR and the STTR programs. The IIP focuses on fostering partnerships across all disciplines to advance technological innovations that have the potential for high impacts through commercial development. In addition to the SBIR and STTR programs, IIP manages several other partnership programs, as well as the Industry/University Cooperative Research Centers (I/UCRC) program, and the Innovation Corps Program (I-Corps). The I-Corps Program helps to equip scientists with the entrepreneurial tools needed to realize commercial potential of innovative technologies, and is considered particularly relevant to the STTR program. (See Box 2-3 and related discussion.) A focus of the set of programs comprising NSF’s IIP portfolio is to help startups and other small companies survive what has come to be called “The Valley of Death”: the period of difficulty and high failure rates between research on a promising concept and bringing that concept to success as a business.
The Division of Industrial Innovation & Partnerships (IIP) sets the objectives for the NSF SBIR program and works to balance the congressional objectives of the program with mission of the NSF. The NSF SBIR program operates independently from the academic divisions of NSF, but works closely to collaborate with them where possible. NSF program officers that are responsible for managing SBIR are required to remain current on initiatives in their fields across the
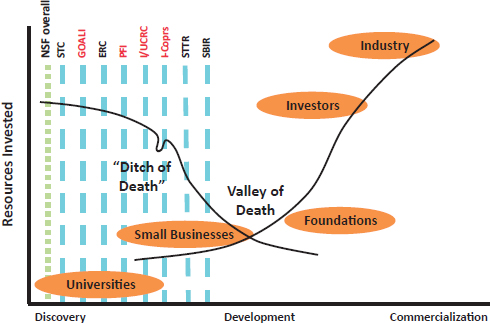
FIGURE 2-1 Portfolio of NSF programs to address the “Valley of Death.”
SOURCE: Presentation by Barry Johnson, May 1, 2015 at the Academies workshop on the STTR program, Washington, DC.
foundation, and NSF staff from outside the division can act as reviewers for the SBIR program.
SBIR topics change only incrementally at NSF from solicitation to solicitation and are defined quite broadly. Suggestions for topics from non-SBIR staff at NSF are welcome, but there is no formal approval structure for topics that involves NSF staff from outside the program. Phase I applicants are in addition encouraged to describe how their proposed work links back to academic work funded by NSF.
With this brief overview of the NSF and location of the SBIR program within NSF’s Engineering Directorate’s IIP Division, this chapter reviews aspects of program management of the SBIR at NSF. A focus is on what can be called the “NSF Model” of SBIR program management. In addition, the chapter discusses important features of the program, feedback about the impact of program directors, and the involvement of women and minorities in the program. Additional support via Phase IIB awards, a distinguishing feature of the program, is discussed separately in Chapter 5.
Sources for this chapter include interviews with staff members, information from the survey and case studies, and documentation from NSF, notably the NSF and SBIR websites and reports of the SBIR Advisory Committee. To our knowledge, there are no formal internal assessments by the National Science Foundation or the National Science Board of the SBIR program at NSF.2
FUNDING DECISIONS
The decision to fund some projects and not others is at the heart of competitive awards such as the NSF SBIR program. These decisions are not easy to make—they reflect the interplay among different objectives, the selection process, the backgrounds of key decision makers, and the institutional framework that influences what kinds of projects should be funded.
Topic Selection
The issue of topic selection appears to have evolved at NSF in recent years. One program director (PD) observed that it is “unlikely that a good project would not find a topic.” Several case study interviews with companies nonetheless suggested a perception that NSF topics are designed to be quite narrow as a means to pare down the number of applications. However, interviews with NSF staff revealed that topics are primarily used to identify areas of particular interest and are not seen, internally at least, as a means of screening out proposals or of reducing the number of applications to manageable levels.
PDs confirmed in interviews that NSF runs an “open” competition: proposals
___________________
2Discussion with a senior advisor to the NSF SBIR program on July 7, 2015.
that do not align with a published topic are accepted (unlike at the Department of Defense [DoD] or the Department of Energy [DoE]). As a result, any innovative project has the potential to be funded through the NSF SBIR program, which is especially important given the very wide technical area covered by NSF. Limiting the topics under which companies can apply for SBIR funding would inevitably screen out potentially important innovations and would in effect substitute the market insights of NSF staff for those of company personnel.
Attention goes into the selection of topics Dr. Jesus Soriano (a PD at NSF) observed that in health and medical technologies considerable efforts are made to align SBIR technologies with the academic priorities funded by other NSF programs: “the SBIR program can be seen as one endpoint of the NSF funding pipeline.”3
Generally, new topics are published every six months. Discussion within the agency begins several months earlier, seeking to identify emerging areas of technology. According to Dr. Prakash Balan, the process provides a catalyst for staff to submit areas on which they will be working. However, he confirmed that topics should be viewed as seeds to spur innovative ideas rather than as a means of restricting applications.4
The development process has changed somewhat in recent years. Until 2012, it was organized around topic clusters, under the coordination of cluster leaders. Current practice has abolished the position of cluster leader and has replaced clusters with nine broad topic areas:5
- Educational Technologies and Applications (EA)
- Information and Communication Technologies (IC)
- Semiconductors (S) and Photonic (PH) Devices and Materials
- Electronic Hardware, Robotics and Wireless Technologies (EW)
- Advanced Manufacturing and Nanotechnology (MN)
- Advanced Materials and Instrumentation (MI)
- Chemical and Environmental Technologies (CT)
- Biological Technologies (BT)
- Smart Health (SH) and Biomedical (BM) Technologies
Each of these topic areas has further subtopics. The following subtopics for Educational Technologies and Applications were included in the most recent solicitation. The breadth of these topics indicates that NSF is making a concerted effort to provide a very broad platform for the development of new technologies:
- EA1. General Education Applications
- EA2. Global, Distance, and Cyber-learning Education Applications
___________________
3Dr. Jesus Soriano, program director, interview, May 2, 2014.
4Dr. Prakash Balan, program director, interview, May 2, 2014.
5See NSF topics webpage, accessed May 19, 2014, <http://www.nsf.gov/eng/iip/sbir/topicshome.jsp>.
- EA3. Simulations and Gaming Technology Applications
- EA4. Entrepreneurship Education Applications
- EA5. Tools for Learning and Assessment
- EA6. Information Management and Technology for Education
This broad platform is further expanded by the text of the solicitation itself (see Box 2-1). The wording “The topics can include . . .” (emphasis added) indicates that even the wide range of topics published in the solicitation is not meant to be limiting. Though intended to be broad and inclusive, NSF needs to ensure from time to time that this organization and processes are sufficient to keep up with evolving opportunities, and that they are sufficiently timely.
What is not entirely clear is whether the broad pool of applicants and potential applicants understand that the door is open to projects not explicitly covered in the solicitation. Although the language on the topics webpage indicates that NSF is open to such projects, it is probably fair to say that the language is not welcoming: “Certain innovative technologies with high commercial potential may not appear to fit under the nine current solicitation topics or corresponding subtopics. In this case, you may seek advice from the relevant Program Director
BOX 2-1
Details of One NSF Subcomponent
EA4. Entrepreneurship Education Applications
Topics can include
- entrepreneurship education and training integrating “diverse topics, such as strategic planning, business model development, opportunity recognition, product entry, intellectual property, project management, legal requirements, and business constraints” in innovative ways for success in the contemporary global economy;a
- personal learning environments that allow students to control and experiment with entrepreneurial situations in relation to their personal learning style to acquire knowledge; and
- innovative tools that enable entrepreneurs and educators to learn or judge the effectiveness and validity of external resources for research, product launch, and effective operations of technological and education related products and services.
aNational Science Foundation, <http://www.nsf.gov/eng/iip/sbir/topics/EA.jsp>. Accessed May 29, 2015.
SOURCE: NSF SBIR/STTR Solicitation, Spring 2014.
(as indicated below) or you may submit the proposal under the topic and subtopic that is the closest match.”6
Pre-Application Feedback
In recent years, NSF has encouraged potential applicants to submit by email a short executive summary of the project to a relevant program director. The objective is to help the applicant gauge whether a project is likely to meet NSF’s selection criteria and hence whether it is a good candidate for funding.
The NSF webpage says that the executive summary should discuss “the following aspects of the project: (1) the company and team, (2) the market opportunity, value proposition, and customers, (3) the technology/innovation, and (4) the competition.”
Although not required, potential applicants are encouraged to seek pre-application feedback, because it offers them the opportunity to avoid the cost of application for projects that have little chance of funding. Responses from PDs vary. One PD explained that he has developed an FAQ that covers most topics for most applicants, to which he adds paragraphs specific to the subject solicitation. He stated that applicants appear to like this approach because it provides a good mix of specific and general information.
It was not entirely clear from interviews whether the pre-application process helps companies decide whether or not to apply. Furthermore, NSF does not collect data related to the pre-application process. Still, given the dominant role of PDs in making final selections for funding from recommendations made by a peer review process, companies should seek to take advantage of this feedback mechanism to create links to the PDs.
Selection
NSF takes the peer-review process seriously and includes both technical and commercial reviewers in the peer-review panel: “Groups of technical and commercial experts from around the country participate in confidentially evaluating proposals according to the review criteria below. SBIR/STTR Program Directors use this input to help decide which projects to fund.”7 The merit criteria are provided on the NSF website and in the solicitation instructions (see Box 2-2).
Reviewers are selected for technical and commercial expertise. All are required to sign conflict of interest forms. Commercial reviewers are expected to consider the basic selection criteria as well as additional prompts provided by NSF in the form of a set of questions, which fall into the following four areas
___________________
6NSF SBIR/STTR solicitation topics, accessed May 19, 2014, <http://www.nsf.gov/eng/iip/sbir/ topicshome.jsp>.
7NSF SBIR Information for Applicants, accessed May 1, 2014, <http://www.nsf.gov/eng/iip/sbir/ phase_I.jsp>.
BOX 2-2
Merit Criteria for NSF SBIR/STTR Awards
“Criterion 1: What is the intellectual merit of the proposed activity?
This criterion addresses the overall quality of the proposed activity to advance science and engineering through research and education.
- Is the proposed plan a sound approach for establishing technical and commercial feasibility?
- To what extent does the proposal suggest and explore unique or ingenious concepts or applications?
- How well qualified is the team (the Principal Investigator, other key staff, consultants, and sub-awardees) to conduct the proposed activity?
- Is there sufficient access to resources (materials and supplies, analytical services, equipment, facilities, etc.)?
- Does the proposal reflect state-of-the-art in the major research activities proposed? (Are advancements in state-of-the-art likely?)
- For Phase II proposals only: As a result of Phase I, did the firm succeed in providing a solid foundation for the proposed Phase II activity?
Criterion 2: What are the broader impacts of the proposed activity?
This criterion addresses the overall impact of the proposed activity.
- What may be the commercial and societal benefits of the proposed activity?
- Does the proposal lead to enabling technologies (instrumentation, software, etc.) for further discoveries?
- Does the outcome of the proposed activity lead to a marketable product or process?
- Evaluate the competitive advantage of this technology vs. alternate technologies that can meet the same market needs.
- How well is the proposed activity positioned to attract further funding from non-SBIR sources once the SBIR project ends?
- Can the product or process developed in the project advance NSF´s goals in research and education?
- Does the proposed activity broaden the participation of underrepresented groups (e.g., gender, ethnicity, disability, geography, etc.)?
- Has the proposing firm successfully commercialized SBIR/STTR-supported technology where prior awards have been made? Or has the firm been successful at commercializing technology that has not received SBIR/STTR support?”
SOURCE: National Science Foundation, accessed <http://www.nsf.gov/eng/iip/sbir/peer_review.jsp>. Accessed May 19, 2014.
and reflect a considerable understanding of commercialization requirements for innovative products:8
- Market opportunity
- Company and team
- Product/technology and competition
- Revenue and finance plan
OTHER ASPECTS OF THE NSF SBIR PROGRAM
Innovative Partnerships
NSF’s efforts to support commercialization include funding for a range of supplementary activities beyond the basic Phase II award and related activities. The Phase IIB program is the best known of these and is discussed separately in this report.
NSF also supports other commercial partnerships. It provides up to 20 percent of the Phase II award ($150,000 maximum) for “additional research that goes beyond the Phase II project’s objectives to meet the technical specifications or additional proof-of-concept requirements. Additional research is anticipated to enhance the commercial potential and lead to partnerships with industrial partners and venture and angel investors.”9
NSF also provides funding for direct commercialization assistance, up to $10,000 per Phase II award. In line with the recent reauthorization, this funding is now available for the company to spend on its own selected advisors.
Beyond commercialization, NSF uses supplementary funding to support other program objectives. It funds institutional partnerships between Phase II awardees and the following various other institutions that may offer opportunities to encourage participation by woman and minority students:
- Minority-serving institutions that have a funded Center for Research Excellence in Science and Technology (CREST) or Historically African-American Colleges and University (HBCU) Research Infrastructure for Science and Engineering (RISE) awards ($100,000 per award maximum)
- Community college researchers and students ($40,000 per year maximum)
- Engineering Research Center (ERC) faculty, researchers, and graduate students ($200,000 per year maximum).
___________________
8NSF SBIR/STTR Phase I Commercial Review Form (revised May 2008), n.d.
9NSF “Phase II Supplemental Award Opportunities,” accessed May 23, 2014, <http://www.nsf.gov/eng/iip/sbir/Supplement/index.jsp>.
NSF also funds what it sees as ways of using SBIR to expand educational opportunities. It provides funding for education including the following mechanisms:
- High School Participants (RAHSS), which supports active research participation in SBIR/Small Business Technology Transfer (STTR) projects by high school students interested in science, technology, and mathematics ($6,000 maximum)
- Undergraduate Participants (REU) are funded to participate in SBIR/ STTR research ($8,000 per student annually maximum).
NSF has also reached out to the U.S. Patents and Trademark Office (USPTO) to develop a partnership to support companies seeking to protect their intellectual property. This is especially significant because the cost of patenting has traditionally not been covered by SBIR awards. USPTO representatives were available at the recent Phase I awardees boot camp, which is discussed below.10
Although Phase I does not provide the opportunities for developing relationships that are apparent in Phase II and beyond, NSF provides some additional channels through which companies can seek support. One PD noted that he makes an effort to contact the Phase I PI by phone 20-30 days before the award starts for a 45- to 60-minute call. He underscores that this is a good opportunity to tell the world that the company received NSF funding both through a press release by the NSF media office listing awards made and by company press releases.
NSF is clearly committed to working during Phase I to ensure that commercial outcomes are maximized. During the most recent award cycle, NSF built on its existing Phase I awardees conference to include a boot camp organized around the principles of the relatively new iCorps program highlighted in Box 2-3. The focus was on ensuring that awardees made the effort necessary to fully connect with potential customers, and to ensure that the eventual product would meet real needs in the marketplace.11
The NSF SBIR/STTR Advisory Committee reviewed the I-Corps approach and concluded that “I-Corps has the potential to accelerate the development curve for STTR grantees, because it promises to shorten the time delay (a.k.a. Valley of Death) between research and customer validation/revenue. Another benefit is to capture and capitalize on the value of prior NSF research.”12
___________________
10Dr. Prakash Balan, interview, May 2, 2014.
11Dr. Joseph Hennessy, NSF, interview, March 27, 2014. More information on the NSF Innovation Corps (“iCorps”) program is available from NSF at <http://www.nsf.gov/news/special_reports/ i-corps/>.
12NSF SBIR/STTR Advisory Committee, minutes of May 2012 meeting, May 9-12, 2012, p. 8.
BOX 2-3
The NSF I-Corps
Although I-Corps is not designed explicitly for SBIR awardees and is not part of the NSF SBIR program, it is closely aligned and if successful could become an integral part of the program. According to NSF,
“The NSF Innovation Corps (I-Corps) is a set of activities and programs that prepares scientists and engineers to extend their focus beyond the laboratory and broadens the impact of select, NSF-funded, basic-research projects.”
“While knowledge gained from NSF-supported basic research frequently advances a particular field of science or engineering, some results also show immediate potential for broader applicability and impact in the commercial world. Such results may be translated through I-Corps into technologies with near-term benefits for the economy and society.”
“Combining experience and guidance from established entrepreneurs with a targeted curriculum, I-Corps is a public-private partnership program that teaches grantees to identify valuable product opportunities that can emerge from academic research, and offers entrepreneurship training to student participants.”
“I-Corps Teams—composed of academic researchers, student entrepreneurs and business mentors—participate in the I-Corps curriculum administered via online instruction and on-site activities through one of several I-Corps Nodes.”
SOURCE: National Science Foundation, <http://www.nsf.gov/news/special_reports/i-corps/>.
Funding Gaps
In some cases, the flow of funding from the agency to the awardee can be interrupted between award phases. In some cases, these funding gaps can cause or contribute to added costs, disruption, and even project abandonment. This section addresses the scale and impacts of funding gaps that can develop between Phase I and Phase II of an SBIR award. This problem is especially challenging for small firms, which are less likely to have other funding sources that can be used to keep projects alive until Phase II funding arrives. This section does not address opportunities that were lost to funding gaps, or changes that could be made to reduce them.
NSF has introduced a number of initiatives in recent years to address the problems of gaps in funding between award phases. However, as Table 2-1 shows, about three-quarters of Phase II respondents indicated that their company experienced a gap between the end of Phase I and the start of Phase II for the surveyed award, and the funding gap had a range of consequences for the company. Table 2-2 indicates the types of impact on companies that experienced a funding gap.
TABLE 2-1 Funding Gap Between Phase I and Phase II
| Experienced a Gap in Funding Between Phase I and Phase II | Phase II (Percent) | |
| Yes | 74 | |
| No | 74 | |
| Total | 100 | |
| N = | 408 | |
SOURCE: 2011 Survey, Question 22.
TABLE 2-2 Effects of Funding Gaps Between Phase I and Phase II
| Effects Experienced | Phase II (Percent) | |
| Stopped work on this project during funding gap | 29.6 | |
| Continued work at reduced pace during funding gap | 50.5 | |
| Continued work at pace equal to or greater than Phase I pace during funding gap | 12.6 | |
| Received bridge funding between Phase I and II | 5.0 | |
| Company ceased all operations during funding gap | 0.7 | |
| Other | 1.7 | |
| Total | 100 | |
| N (Respondents reporting a PI-PII gap) = | 301 | |
SOURCE: 2011 Survey, Question 23.
Almost 30 percent of respondents reported that their company stopped work on the project during this period, and more than 50 percent reported a reduced level of effort. However, 12 percent reported that company efforts did not diminish. Only 5 percent reported receipt of bridge funding. Less than 1 percent reported that the company ceased all operations.
Aside from the obvious direct impact of delayed projects, funding gaps can have long-term consequences especially for smaller companies; where in some cases there is insufficient work to retain key project staff during the gap period.
Amount of Funding
Although there are obvious limitations to the utility of asking recipients whether the amount of money provided was sufficient for the project at hand, there is at least some value in determining the extent of affirmative responses.
In this case, about 55 percent of Phase II respondents indicated that the funding was sufficient; about 45 percent indicated that more funding was required. None reported that the funding was more than necessary (see Table 2-3).
Size of Awards
Although awardees often suggest in other contexts (e.g., case study interviews) that the size of awards should be increased (a view especially prevalent before the changes made during the 2011 program reauthorization), the survey asked about the possible trade-off between the size of awards and the number of awards: unless NSF funding for the SBIR program increases, larger awards imply fewer awards. A plurality was in favor of not making that trade-off: 44 percent opposed it while 29 percent were in favor (Table 2-4).
Size of Program
The survey also asked about the possible expansion of the SBIR program itself. About two-thirds of respondents supported an increase in the size of the.
TABLE 2-3 Adequacy of Phase II Funding
| Amount of Funding Provided for Phase II Award Was | Phase II (Percent) | |
| More than enough | 0.0 | |
| About the right amount | 55.3 | |
| Not enough | 44.7 | |
| Total | 100.0 | |
| N = | 179 | |
SOURCE: 2011 Survey, Question 42.
TABLE 2-4 Tradeoff of Larger Awards for Fewer Awards
| Would Prefer More Funding Per Award Even If Fewer Awards | Phase II (Percent) | |
| Yes | 28.5 | |
| No | 43.6 | |
| Not sure | 27.9 | |
| Total | 100.0 | |
| N = | 179 | |
SOURCE: 2011 Survey, Question 43.
TABLE 2-5 Increasing the Size of the SBIR Program
| Would recommend that the Program be | Phase I (Percent) | Phase II (Percent) |
| Expanded (with equivalent funding taken from other federal research programs that you benefit from and value) | 66.2 | 70.4 |
| Kept at about the current level | 31.4 | 29.1 |
| Reduced (with equivalent funding applied to other federal research programs you benefit from and value) | 0.5 | 0.6 |
| Eliminated (with equivalent funding applied to other federal research programs you benefit from and value) | 2.0 | 0.0 |
| Total | 100.0 | 100.0 |
| N = | 204 | 179 |
SOURCE: 2011 Survey, Question 44.
program even if funding were taken from other federal programs that they value. There were no statistically significant differences between Phase I and Phase II responses (see Table 2-5)
WOMEN AND MINORITIES
One of the four congressional objectives for the SBIR/STTR program is “to foster and encourage participation by minority and disadvantaged persons in technological innovation.”13 Within the SBIR program, the relevant metric is understood to be company ownership,14 and SBA defines “minority and disadvantaged persons” in the context of the SBIR program as “socially and economically disadvantaged” (SED), including women, designated as “Woman-owned Small Businesses” (WOSB), and people from certain racial/ethnic groups, designated “Minority-owned Small Business (MOSM).15 MOSBs include the following racial/ethnic groups:16
___________________
13Public Law 97–219, § 2, July 22, 1982, 96 Stat. 217.
14Small Business Administration, SBIR/STTR Policy Directive, February 24, 2014, p. 3.
15See the SBA description of the SBIR program, <https://www.sbir.gov/about/about-sbir> (accessed March 31, 2014) and the SBA definition of Socially and Economically Disadvantaged Individuals (SEDs) <http://www.sba.com/sba_8%28a%29.htm>, (accessed on March 31, 2014). Data from NSF rely on self-identification of demographic characteristics by companies during the application process. Self-identification is voluntary, and there is anecdotal evidence that incentives may encourage applicants to over-report or under-report.
16See Small Business Administration, “Definition of Socially and Economically Disadvantaged Individuals” at <http://www.sba.com/sba_8%28a%29.htm>.
- African-Americans;
- Hispanic Americans (persons with origins from Latin America, South America, Portugal, and Spain);
- Native Americans (American Indians, Eskimos, Aleuts, and Native Hawaiians);
- Asian Pacific Americans (persons with origins from Japan, China, the Philippines, Vietnam, Korea, Samoa, Guam, U.S. Trust Territory of the Pacific Islands [Republic of Palau], Commonwealth of the Northern Mariana Islands, Laos, Cambodia [Kampuchea], Taiwan, Burma, Thailand, Malaysia, Indonesia, Singapore, Brunei, Republic of the Marshall Islands, Federated States of Micronesia, Macao, Hong Kong, Fiji, Tonga, Kiribati, Tuvalu, or Nauru);
- Subcontinent Asian Americans (persons with origins from India, Pakistan, Bangladesh, Sri Lanka, Bhutan, the Maldives Islands, or Nepal).
For ease of reading, the term “minority” or abbreviation “MOSB” will be used to denote membership in at least one of these groups.
Although the WOSB and MOSB formulation has been traditional among SBIR stakeholders, it has several unfortunate consequences:
- It focuses attention entirely on company ownership rather than on “participation” as stated in the statute. There are many different ways to participate in the program, only one of which is ownership.
- It replaces “minority and disadvantaged persons” with “socially and economically disadvantaged small businesses,” which aligns the program with SBA definitions of socially and economically disadvantaged rather than with the minority needs at the forefront of the congressional objective.
As a result, agencies disregard all participation other than ownership; for example, no agency maintains data about woman and minority principal investigators. Furthermore, SBA definitions of “socially and economically disadvantaged” have the effect of largely obscuring agency performance in support of the congressional objective.
Analyzing Participation by Minorities and Women
The participation of woman- and minority-owned companies in NSF’s SBIR program is informed by data provided by NSF directly, by data obtained by Academies17 survey, and by an Academies workshop on diversity. In analyzing the data, the following metrics are of particular interest: MOSB and WOSB ap-
___________________
17Effective July 1, 2015, the institution is called the National Academies of Sciences, Engineering, and Medicine. References in this report to the National Research Council, or NRC, are used in a historic context identifying programs prior to July 1.
plications and awards as percentages of overall applications and awards, and the share of MOSBs and WOSBs in the program. Broad conclusions based on the data and workshop evidence are presented here. Supporting tables of the underlying NSF data are provided in detail in Chapter 3. Data tables from the Academies survey are provided in this chapter. Key findings of the Academies workshop on diversity are captured here, but details are in a separate report.18
Evidence Provided by NSF Data
NSF data for Phase I provide strong evidence that access to the program by MOSBs is low and not improving; in fact, on almost all relevant metrics, it appears as though access is declining:
- Applications from MOSBs have been flat or have declined slightly since the early 2000s (depending on base year).
- For every year from 2003 to 2012, Phase I success rates (defined as awards as a percentage of applications) were lower for MOSBs than for non-MOSBs—with an average difference of about 6 percentage points.
- The MOSB share of SBIR awards fell steadily from 2003 to 2012, a function of declining numbers of applications and relatively low success rates.
Overall MOSBs have received few awards from NSF.
Although WOSBs have had somewhat more success than MOSBs in Phase I, they have been somewhat less successful than all other applicants:
- Applications from WOSBs in Phase I have broadly mirrored patterns for applications as a whole. However, there was a slight increase in the percentage of applications received from WOSBs during the past 4 years of the study period.
- With one exception, success rates were consistently lower for WOSBs than for non-WOSBs in Phase I. However, the average gap was considerably smaller than that for MOSBs, and in one year (2011) WOSB applications succeeded slightly more often than did non-WOSB applications.
- Yearly Phase I awards to WOSB fluctuated in number, ranging from approximately 19 to 47. Awards to WOSB ranged between approximately 10 and 18 percent, but mostly stayed below 14 percent of total yearly NSF
___________________
18See National Academies of Sciences, Engineering, and Medicine, Innovation, Diversity, and the SBIR/STTR Programs (Washington, DC: The National Academies Press, 2015), the summary report from workshop on “Innovation, Diversity, and Success in the SBIR/STTR Programs,” Washington, DC, February 7, 2013. It should also be noted that there are additional sources of information about women and minorities, such as various conferences and books on women, including minority women and men, in STEM.
Phase I awards. NSF data for Phase II show addition evidence of poor performance for MOSBs and WOSBs:
- In 6 of the 10 years of Phase II applications studied, MOSBs had lower success rates than non-MOSBs; and overall had lower average success rates—32 percent for MOSB compared with 44 percent for non-MOSB.
- Over the study period, the MOSB share of Phase II awards declined, and averaged less than 10 percent.
- The numbers of applications from WOSBs increased during the study period, but the reported numbers fluctuated from year-to-year.
- Success rates for WOSBs—though slightly better than those for MOSB—in 6 of 10 years had a lower success rate than did non-WOSBs, and overall had a lower average success rate. Overall, the WOSB share of awards fluctuated from year-to-year, but appears to have trended upward, ranging from near 6 percent at the beginning of the study period, to about 13 percent at the end of the period.
These data would seem to suggest that outreach to woman- and minority-owned companies has not been effective in increasing applications. Furthermore, success rates suggest that neither of these groups has been as successful as other companies in the selection process for awards. At a minimum, NSF should seek an explanation for the observed differences, including gauging the impact of NSF initiatives in this regard.
The data collected and provided by NSF, like those from other agencies, conceal as much as they reveal. The data do not capture other types of participation in the program—notably by PIs. Furthermore, the data are not disaggregated by type of minority, which has the effect of concealing the lack of participation of African-American- and Hispanic-owned companies. These issues are addressed via data drawn from the 2011 Survey, which are the subject of the next section.
Evidence Provided by Academies Survey Data
The 2011 Survey data are especially valuable in understanding the role of women and minorities because they extend beyond company ownership to include an important part of the talent pipeline leading to eventual SBIR awards: the principal investigators (PIs), who in some cases are company founders and in other cases move on to found companies themselves at a later date.
As with the previous Academies survey conducted for the earlier SBIR study, the 2011 survey asked if the PI for the surveyed project belongs to a socially and economically disadvantaged group (SED).19 About 17 percent of Phase I and 15
___________________
19The Academies survey used SED terminology to focus participation on more than company ownership.
TABLE 2-6 Composition of SED PI Grouping, by Race/Ethnicity, as Percent of SED PIs
| Race/Ethnicity of SED PIs | Phase I (Percent) | Phase II (Percent) |
| Asian-Pacific | 45.7 | 45.2 |
| Asian-Indian | 22.9 | 48.4 |
| Hispanic | 22.9 | 6.5 |
| African-American | 8.6 | 0.0 |
| Native American | 0.0 | 0.0 |
| Other | 2.9 | 3.2 |
| N = | 35 | 31 |
NOTE: Responses do not add to 100 percent, because respondents were permitted to check more than one category.
SOURCE: 2011 Survey, Question 14C.
percent of Phase II respondents reported that this was the case for their project.20 The survey then asked respondents to provide details about the PI’s racial/ethnic background, using the detailed categories drawn from SBA definitions, with the addition of an “other” category to ensure that all respondents who wished to claim SED status could do so. (Results for women are presented after the results for racial/ethnic groups.)
Responses revealed that more than 90 percent of Phase II projects with an SED PI were Asian-Pacific or Asian-Indian. No PIs were African-American. None were Native American. Moreover, the share of Hispanic PIs declined sharply from 22.9 percent for Phase I to 6.5 percent of Phase II. It must be understood, however, that these percentages are calculated from low absolute numbers—only 35 Phase I and 31 Phase II reported that their PI was SED. Still, the total absence of African-American and Native American PIs in Phase II and the sharp decline in Hispanic PIs across Phases are causes for concern (see Table 2-6).
These data can be placed in the context of the survey population as a whole. Overall, of the 386 respondents to this question, 2.6 percent said that the PI on their project was Hispanic (total: 10) and less than 1 percent said that the PI was African-American (total: 3); none reported that the PI was Native American (see Table 2-7).
Turning from the ethnicity of the PIs to the ethnicity of the owners of surveyed companies, approximately 16 percent of Phase I respondents and 12 percent of Phase II respondents indicated that the company was majority owned by members of SED groups at the time of the award (see Table 2-8).
___________________
202011 Survey, Question 14B.
TABLE 2-7 SED PIs, by Race/Ethnicity, as Percent of All Respondents
| Race/Ethnicity of SED PIs | Phase I (Percent) | Phase II (Percent) |
| Asian-Pacific | 7.8 | 7.7 |
| Asian-Indian | 3.9 | 8.3 |
| Hispanic | 3.9 | 1.1 |
| African-American | 1.5 | 0.0 |
| Native American | 0.0 | 0.0 |
| Other | 0.5 | 0.6 |
| N = | 205 | 181 |
SOURCE: 2011 Survey, Question 14C.
TABLE 2-8 SED Ownership, Percentage of Respondents
| Company Ownership Was Majority SED at the Time of Award | Phase I (Percent) | Phase II (Percent) |
| Yes | 16.1 | 12.3 |
| No | 83.9 | 87.7 |
| Total | 100 | 100 |
| N = | 205 | 408 |
SOURCE: 2011 Survey, Question 19B.
However, probing more deeply into the ethnic distribution of SED company ownership allows for further identification of issues. Overall, this distribution is quite similar to that for SED PIs, in that more than 70 percent of both Phase I and Phase II respondents reported majority owners of Asian-Indian and Asian-Pacific ethnicity. Both Hispanic and African American owners garnered a higher share of Phase I than Phase II responses (see Table 2-9). Again, the numbers involved are very small: respondents reported three Phase I and one Phase II African-American-owned companies and seven Phase I and three Phase II awards for Hispanic-owned companies, out of 386 awards surveyed. However, this disaggregation of the SED category reveals very low percentages of African-American-owned companies winning SBIR awards and this requires closer examination.
The discrepancy between Phase I and Phase II responses for both African-American- and Hispanic-owned companies is an additional area for further analysis. We might expect to see approximately the same percentage for both Phases, but differences in percentages are also seen across phases for other groups, such as the Asia-Pacific group.
TABLE 2-9 SED Company Ownership, by Race/Ethnicity and Award Phase
| Race/Ethnicity of Company Ownership at Time of Award | Phase I (Percent) | Phase II (Percent) |
| Asian-Indian | 33.3 | 54.2 |
| Asian-Pacific | 39.4 | 20.8 |
| Hispanic | 21.2 | 12.5 |
| African-American | 9.1 | 4.2 |
| Native American | 0.0 | 0.0 |
| Other | 3.0 | 8.3 |
| N = | 33 | 24 |
NOTE: Responses do not add to 100 percent because respondents were permitted to check more than one category.
SOURCE: 2011 Survey, Question 19C.
The 2011 Survey also sought information about the gender of PIs. Respondents reported that about 13 percent of PIs were women, for both Phase I and Phase II awards.21
The survey also addressed the extent to which SBIR awards are made to woman-owned businesses. These data are provided in Table 2-10.
The difference in percentage woman-owned company between Phase I and Phase II awards may be sufficient to warrant additional research and analysis by the agency.
The Challenge of Improving Diversity22
Recognizing that small businesses often introduce the radical ideas that can transform industries and markets, and the need to mobilize all skilled individuals, regardless of race/ethnicity or gender, strengthens the economy and the nation, the committee convened a workshop to draw attention on participation of women, minorities, and both older and younger scientists, engineers, and entrepreneurs in the SBIR program and to identify mechanisms for improving their participation rates.23 The workshop also drew attention to the fact that improving the participation of women and minorities in the SBIR program is a part of a broader national challenge. See Box 2-4.
___________________
212011 Survey, Question 14A.
22National Research Council, Workshop on “Innovation, Diversity, and Success in the SBIR/STTR Programs,” Washington, DC, February 7, 2013.
23Ibid, p. 5.
TABLE 2-10 Woman-Owned Businesses
| Company Was Majority Woman-Owned at the Time of Award | Phase I (Percent) | Phase II (Percent) |
| Yes | 17.1 | 11.3 |
| No | 82.9 | 88.7 |
| Total | 100.0 | 100.0 |
| N = | 205 | 408 |
SOURCE: 2011 Survey, Question 19A.
BOX 2-4
Expanding Participation of Women and Minorities in STEM
The 2011 publication by the National Research Council, Expanding Underrepresented Minority Participation: America’s Science and Technology Talent at a Crossroads, notes that underrepresented minorities, defined here as Hispanics, African Americans, Native Americans/Alaska Natives, comprise a small percentage at each step of the science, technology, engineering, and mathematics (STEM) education process. The percentage of African Americans and Hispanics interested in STEM undergraduate majors is similar to those of white and Asian Americans, but their completion rates are much lower. At the graduate school level for science and engineering, underrepresented minorities receive only 14.6 master’s degrees and 5.4 percent of doctoral degrees. Data from the National Science Board indicates that women earn roughly half of S&E degrees at the bachelor’s, master’s, and Ph.D. levels, but they earn “fewer than one-third of the doctorates awarded in physical sciences, mathematics and computer sciences, and engineering” and less than a quarter of engineering master’s degrees.
Participants at the workshop examined broad demographic trends in the science and engineering workforce and statistical measures from the SBIR program for women and minorities, and searched for pragmatic solutions to boost SBIR awards to women and minorities. The workshop highlighted the fact that women comprise 51 percent of the U.S. population and 27 per cent of STEM graduates, but woman-owned companies have received only about 6 percent of SBIR awards. Hispanics, African Americans, Asian Americans, and Native Americans together comprise 36 percent of the U.S. population and 26 percent of STEM graduates, but less than 10 percent of all SBIR awards. Beyond NSF’s SBIR program, the current participation of women and minorities was found to be low and decreasing, and participation of African Americans and Hispanics is particularly low.
Further, participants at this workshop identified steps needed to stimulate participation by underrepresented populations, with a focus on expanding the applicant pool, eliminating barriers in grant applications and selection, and providing greater education and support for entrepreneurship training and commercialization efforts. Examples of specific ways to broaden participation cited included taking advantage of NSF initiatives to encourage SBIR Phase II grantees to hire high school and college students, graduate students, post-docs, and teachers from underrepresented groups; to provide more outreach to graduate students to make them aware of the program; to make it easier for people to apply; and to increase women and minorities on review panels.24 (See Box 2-5.) Participants also saw the need to align and leverage resources and programs at the state level that aim at providing access and support to woman and minority owned businesses; and to team with other federal and state/local programs which are addressing this issue.
These efforts at NSF notwithstanding, participation rates for women and minorities remain low. In many ways, efforts by NSF staff to address this issue are limited by regulations that are aimed at protecting the identity, race, and sex of grantees and proposers. These rules are also designed to prevent special treatment for those classes of people based on race or sexual orientation.
NSF’s SBIR Advisory Committee has recognized this issue some AdCom members have been working to expand the number of women and minorities participating in NSF SBIR program on their own time. Nonetheless, the data revealed by the committee’s assessment requires a careful review and a more broad-based response to address this challenge.
Conclusions: Woman and Minority Participation in the NSF SBIR Program
Evidence from the NSF SBIR program and the Academies survey shows minority participation to be at very low levels in NSF SBIR and getting worse. It shows participation rates a little better for women, with some upward trending, but still below the non-woman group. Both are still well below potential. The previous lack of data about African-American, Native American, and Hispanic inclusion in the program concealed what is, by any account, a very disappointing outcome that does not meet congressional objectives of the SBIR program.
NSF acknowledges its limited efforts to address this issue in the past. A lack of sufficient administrative funding has made additional support difficult to fund, and perhaps as a result this objective simply has not been addressed head on. The most current minutes from the NSF SBIR Advisory Board reflect this concern: “We recommend that IIP [the NSF Division for Industrial Innovation and Partnerships] focus on increasing the number of Phase I proposals submitted from
___________________
24Ibid, pp. 53-54.
BOX 2-5
NSF Initiatives to Encourage Diversity in the SBIR Program
In her workshop remarks, Grace Wang, then director of the NSF’s Industrial Innovation and Partnerships Division, highlighted her division’s mission to drive U.S. innovation by investing in technology and its commercialization, an objective that cannot be accomplished without human talent. ”The base of innovation capacity is people--that’s the innovators and entrepreneurs,” said Dr. Wang. That recognition drives the NSF’s interest in broadening participation in science and engineering through the SBIR program. To channel more people into STEM careers, “first, we need to expand the talent pool, and second, retain the talent.” said Ms. Wang. “We need to increase the pipeline and stop leakage of the pipeline,” she said.
Dr. Wang indicated that according to Census Bureau data, 65 percent of the total U.S. population in 2008 was composed of the underrepresented in science and technology, defined as women, African Americans, Hispanics, Native Americans, and people with disabilities. Yet, these groups constituted only 33 percent of science and engineering occupations in 2006, according to NSF data.
To broaden participation, Dr. Wang noted that the NSF runs several initiatives to encourage SBIR Phase II grantees to hire high school and college students, post-docs, and K-12 and community college teachers:
- Research Assistantships for High School Students, where Phase II grantees hire high school students for up to $6,000 per student.
- Research Experience for Teachers, where Phase II grantees hire K-12 teachers for up to $10,000 per teacher to bring the culture of innovation and entrepreneurship back to the classroom.
- Community College Research Teams, where Phase II grantees receive up to $40,000 and spend at least 75 percent of this award to subcontract to a community college, working with at least one faculty member and one student as a team.
- Research Experience for Undergraduates, the most popular program among Phase II grantees, where companies hire college interns for up to $8,000 per student. About 40 percent of Phase II grantees have hired at least one such student.
- The Phase IIA program gives Phase II grantees $100,000 with the requirement to subcontract 70 percent of the grant to minority-serving institutions to conduct research together.
- The Small Business Post-Doc Research Diversity Fellowship enables post-docs to work for Phase II companies for up to $75,000 each.
- The new Veteran’s Research Supplement enables Phase II companies to hire veteran high school and college students, teachers, and community college faculty for up to $10,000 per veteran.
- In addition, the NSF attempts to support existing principal investigators by providing networking and mentoring opportunities specifically for them at the annual grantees’ conference.
underrepresented groups (emphasis in the original). We request that IIP collect and present the number of Phase I proposals submitted from underrepresented groups in each AdCom meeting.”25
THE NSF MODEL: DEDICATED RESOURCES FOCUSED ON COMMERCIALIZATION
Most SBIR programs at other agencies are highly decentralized. At agencies funding a large number of awards, for example the National Institutes of Health and DoD, it is fair to say that individual components run their own SBIR programs with direction but not control from the agency SBIR office. Funding and selection decisions in particular are in the hands of components, not the central office. Even at DoE and NASA, individual program offices have considerable say in selection decisions and in program operations.
The NSF model has a number of innovative features and components. These include the following:
- Investment in a number of high-quality program directors (PDs), so that each PD is responsible for approximately 30 awards at any given point in time
- Close and ongoing connection between PDs and companies, especially for Phase II and beyond
- Selection for innovation and commercialization, with a particular emphasis on the latter
- Additional bridge funding through the Phase IIB program
- Additional commercialization assistance via third-party providers LARTA and Foresight
- Tracking of outcomes at specified points post-award, via the telephone surveys managed by a long-time consultant, George Vermont
- A range of partnership activities to leverage resources and capabilities
Individual PDs are effectively in charge of the entire grant stream from initial draft topic to the conclusion of Phase IIB, which is as far downstream as NSF SBIR funding can reach. The PDs make funding recommendations, based on results from the independent peer review and input from other program staff. Senior program executives and other PDs provide cross-checks and a critical scrutiny of recommendations. The “NSF Model” revolves around the role of the PD.
___________________
25Report of the Advisory Committee for Small Business Innovation Research (SBIR) and Small Business Technology Transfer (STTR) Programs, May 9-10, 2012, Box 1-1.
Role and Effectiveness of Program Directors
The survey responses provide considerable insight into the effectiveness of PDs. Given the unique role of the PD at NSF, it is understandable that respondents offered a range of views, although overall they were highly positive about the role and impact of PDs.
Respondents reported how often they engaged with their PD. A majority (58 percent) of Phase II respondents reported quarterly contact, while 15 percent reported monthly contact and 23 percent reported annual contact (see Table 2-11).
The survey also sought to determine how easy it was for companies to reach the PD with questions or concerns. Ninety percent of Phase II recipients found it easy or very easy to reach their PD (see Table 2-12).
Interviews and open-ended comments (see below) revealed that some PDs had very positive effects on their awardee companies, while others were of little help.
TABLE 2-11 Frequency of Contact with PDs
| PD Contact Cycle | Phase II (Percent) |
| Weekly | 3.9 |
| Monthly | 15.0 |
| Quarterly | 57.8 |
| Annually | 23.3 |
| Total | 100.0 |
| N = | 206 |
SOURCE: 2011 Survey, Question 47.
TABLE 2-12 Ease with Which PI Could Contact PD
| Phase II (Percent) | ||
| Very easy | 28.8 | |
| Easy | 61.0 | |
| Hard | 9.6 | |
| Very hard | 0.6 | |
| Total | 100.0 | |
| N = | 177 | |
SOURCE: 2011 Survey, Question 52.
The survey attempted to gauge the distribution of utility by asking respondents how helpful the PD had been to their project (see Table 2-13). Overall, more than 40 percent of Phase II respondents scored PD usefulness at 4 or 5 on a 5-point scale. Conversely, about 30 percent scored usefulness at 1 or 2 on the scale.
One important role of the PD is to provide technical advice to the awardee about the operations of the SBIR program. The program is complex, so a technically knowledgeable PD can be of great use especially to companies that are new to the program.
Given their other priorities, it is possible that PDs may not have enough time to devote to the projects they are supposed to be managing. However, 77 percent of respondents indicated that the PD’s available time was sufficient or more than sufficient (see Table 2-14). However, in the open-ended questions, several respondents shared their concern that the PDs were carrying a heavy workload of companies (30 ongoing Phase II awards at any one time, in addition to Phase I, outreach, and selection responsibilities).
TABLE 2-13 Usefulness of the PD
| Value of PD | Phase II (Percent) |
| Invaluable (5) | 18.4 |
| 4 | 23.3 |
| 3 | 28.6 |
| 2 | 18.0 |
| No help (1) | 11.7 |
| Total | 100.0 |
| N = | 206 |
SOURCE: 2011 Survey, Question 48.
TABLE 2-14 PD Time Availability for Surveyed Project
| Phase II (Percent) | ||
| More than sufficient | 6.4 | |
| Sufficient | 70.3 | |
| Insufficient | 23.3 | |
| Total | 100.0 | |
| N = | 202 | |
SOURCE: 2011 Survey, Question 54.
Because a core responsibility for PDs is to explain program operations and to support companies through the paperwork, the survey asked about the technical capacity of the PD with regard to the SBIR program. Overall, respondents appeared satisfied; 75 percent indicated that the PD was extremely or quite knowledgeable about the SBIR program, and only 3 percent indicated that the PD was not at all knowledgeable (see Table 2-15). Evidence from open-ended responses suggests that newcomers to the program were more likely to find PDs helpful in dealing with programmatic issues.
PDs can also provide valuable support in a number of areas. They are hired in part because they are technically knowledgeable about specific science and engineering disciplines and therefore can provide valuable technical insights. However, only about 11 percent of respondents indicated that they received a substantial amount of technical help from the PD (scores of 4 or 5 on a 5-point scale); almost 50 percent reported minimal help (Table 2-16).
TABLE 2-15 PD Knowledge About the SBIR Program
| Phase II (Percent) | |
| Extremely knowledgeable | 34.8 |
| Quite knowledgeable | 39.2 |
| Somewhat knowledgeable | 23.0 |
| Not at all knowledgeable | 2.9 |
| Total | 100.0 |
| N = | 204 |
SOURCE: 2011 Survey, Question 49.
TABLE 2-16 PD Technical Support for Project During Phase II
| Technical Help During Phase II | Phase II (Percent) |
| Most help (5) | 2.9 |
| 4 | 8.2 |
| 3 | 19.3 |
| 2 | 22.2 |
| Least help (1) | 47.4 |
| Total | 100.0 |
| N = | 171 |
SOURCE: 2011 Survey, Question 50.2
PDs can also support awardees by introducing them to technical staff at universities. However, only about 15 percent of respondents reported receipt of this type of support (scores of 4 or 5 on a 5-point scale), while 53 percent reported no help in this area (see Table 2-17).
PDs are sometimes well positioned to provide useful connections to other companies—either other SBIR awardees or other companies with complementary interests or capabilities. Nineteen percent of surveyed companies indicated substantial support (scores of 4 or 5 on a 5-point scale) and 37 percent reported minimal help in this area (see Table 2-18).
TABLE 2-17 PD Support for University Connections
| Introduction to University Staff During Phase II | Phase II (Percent) |
| Most help (5) | 4.6 |
| 4 | 10.3 |
| 3 | 13.7 |
| 2 | 18.9 |
| Least help (1) | 52.6 |
| Total | 100.0 |
| N = | 175 |
SOURCE: 2011 Survey, Question 50.3.
TABLE 2-18 PD Connections to Other Private Firms
| Introduction to Staff at Other Companies During Phase II | Phase II (Percent) |
| Most help (5) | 3.4 |
| 4 | 15.5 |
| 3 | 17.8 |
| 2 | 26.4 |
| Least help (1) | 36.8 |
| Total | 100.0 |
| N = | 174 |
SOURCE: 2011 Survey, Question 50.4.
BOX 2-6
Positive Comments About NSF SBIR/STTR Program Directors
“My initial Program Officer was an invaluable source of information and direction. He guided us through the application process and throughout the funding period. He was very friendly, courteous, and respectful and a pleasure to work with.”
“Dr. ___ is an extraordinary asset to NSF. The breadth of his industrial and governmental expertise was very helpful.”
“All the program officers at NSF I have worked with have been extremely helpful and knowledgeable. One even introduced us to another company that had potential collaborative value.”
“[Our PD] was very effective at encouraging [our] company to make the right company decisions and made himself available to answer questions even prior to submission of application.”
“Having worked on SBIR funded projects from four different agencies, our experience with the Project Manager at NSF was the most comprehensive.”
“He was just the greatest Program Officer we could have hoped for.”
“Through Phase I and Phase II meetings I was also able to get coaching from NSF program managers. The NSF program managers have significant business experience that can be extremely valuable in advising companies.”
SOURCE: 2011 Survey.
Open-Ended Responses Related to PD Activities
Survey respondents were offered the opportunity to provide open-ended comments related to their PD.26 Although each response is different, it is possible to sort them into positive, negative, and neutral comments. About one-third of the comments were negative, one-half were positive, and one-quarter were highly positive.
Positive comments highlighted the connection between specific PDs and their companies, which was evidence for many respondents that the mentoring model (see NSF model section below) has had a positive impact. A sample of positive comments is provided in Box 2-6.
Many of the more negative comments were written by Phase I respondents. As the data indicate, about one-third of Phase II respondents had negative views of their interactions. Key criticisms included the following:
- Insufficient time. Many respondents (even those with positive comments) mentioned the heavy workload. A number indicated that they did not
___________________
262011 Survey, Question 56.
-
have sufficient time with their PD and therefore did not receive the right guidance.
- Flawed Selection Process. A number of Phase I respondents complained that they received an unsatisfactory debrief or that the debrief indicated a flawed selection process. These complaints are likely normal for any grant program, but one respondent specifically noted a weak appeals process.
- Focus on Commercialization. Several interviewees and a number of survey commentators indicated that the current laser focus on commercialization might be counterproductive, excluding technically demanding projects. In interviews, PDs indicated an awareness of this problem and claimed to be addressing it.
- Lack of program guidance. Several respondents (mostly Phase I) complained that they received unsatisfactory and/or insufficient advice about their proposals and technical issues such as budgets. However, NSF provides substantial documentation on its website, and a more proactive approach from at least some of these companies likely would have addressed these issues.
A sample of negative comments is provided in Box 2-7.
Qualifications of PDs
PDs are not like SBIR staff at other agencies. They are specifically hired to manage a portfolio of SBIR projects. So the best comparison is not with staff at other agencies, but with staff at small venture or hedge funds. PDs are carefully selected, have strong backgrounds in business and technology commercialization, often in startups or other highly innovative firms, and are also high-level subject matter experts in specific science and engineering disciplines (see Box 2-8).
Topic Selection
As mentioned earlier in this report, NSF claims to offer a broad set of topics. One PD observed that it was “unlikely that a good project would not find a topic.” Some case study interviews suggested that this is not entirely the case and that NSF topics are actually quite narrow, as a means of reducing the number of applications. However, this criticism may apply more to past solicitations than to current ones. This Committee’s initial review of the May 2014 solicitation (which addressed areas related to educational applications) concluded that the topics were broad enough to attract a wide range of proposals. Moreover, each subtopic is phrased so that applications “can include” specific areas (see Box 2-9).
The PD is responsible not only for developing topics but also selecting proposals to be recommended for funding. The PD serves as an important mentor during the entire award cycle, providing in-person support that complements
BOX 2-7
Negative Comments about NSF SBIR Program Directors
“Most of the time I feel they are too busy to guide you through the hoops and loops of this whole process.”
“Project Managers are always very busy. They seem to not be able to focus any great effort on the details of what we were developing.”
“I didn’t expect to be engaged too much with the Program Officer in the Phase I. However, I was disappointed by the fact that he seemed to have too heavy of a load and [was] clearly unable to provide adequate attention to any individual program. The initial kick-off meeting at the workshop was much too short and rushed and had little value.”
“I would say that my PO’s interest in my company and its product pretty much ended when the award was made. I met with him once at the mandatory SBIR PI conference but received no help or guidance from him.”
“NSF Program officers focus too much on commercialization, too little on technical guidance. Despite this they have very few useful business contacts.”
“Also, the IP-based business model is pushed too hard. In software it is obsolete and should be focused on a services model. The business people at NSF are confused about alternative business models like open source models.”
“Our second project manager did not seem to have enough time or understanding of our products.”
“Our technology was broad based, but NSF wanted us to find commercialization too fast without improving technology.”
“The NSF SBIR Program Manager tried to help us through the administrative process effectively. However, in terms of help in our specific technology/science/ commercialization I do not feel the Program Manager was adequately qualified. I do not think there was a clear understanding of entrepreneurship. I do not think there was any entrepreneur on the review panels.”
SOURCE: 2011 Survey.
more general commercialization support provided through third parties. Evidence from interviews and the survey indicated that NSF PDs and funded companies develop closer relationship than those found at other agencies. Of course, this close relationship carries certain risks: one PD explained that he makes a point to not provide multiple Phase II awards to a single company in his domain.27
The NSF has invested a substantial amount in the administration of the SBIR/ STTR program. The cost of the PDs is estimated at $2 million annually, which is provided from NSF’s administrative budget, not the SBIR awards budget. This amount does not appear to be excessive for a program of this size.
___________________
27Steve Konsek, NSF PD, interview, March 14, 2014.
BOX 2-8
Background and Qualifications of
NSF SBIR/STTR Program Directors
At the time of this writing, nine SBIR/STTR PDs are employed at NSF. They have deep knowledge of specific fields—for example, biomedical applications or energy. They are very highly qualified individuals. Academically, seven of the nine PDs have PhDs (three in physics, two in chemical engineering, and one each in genetics and cell biology, and medical sciences). They have published numerous scientific peer-reviewed papers, and several hold patents themselves or directed companies that developed patentable technologies. Two hold MBA degrees, one also holds an MD degree, one is a certified Microsoft systems engineer, and one has published well-received books on computer graphics now translated into five languages.
- All have strong backgrounds in the commercialization of technology. Individually, they have managed the development and commercialization of a number of optical fiber and optoelectronic component technologies for British Telecom, and were instrumental in establishing a commercialization center for specialized optical fibers at the University of Sydney;
- co-founded two successful companies, first an environmental engineering technology company and thereafter a biofuels company, which commercialized the PD’s patents for industrial multiphase reactors applicable to chemical and biochemical production, as well as energy-efficient patented oxygenation technologies for biological wastewater treatment;
- served as chief technology officer at Illumitex, a venture-backed company developing light emitting diode chips, packages and fixtures for general illumination, after a period as chief of technical staff at Glo, recognized as one of Europe’s top LED startups;
- worked in a range of sectors: developed subdivisions, new home construction, manufacturing computers, and custom programming for specific industry applications;
- founded as CEO a Bluetooth wireless product company, “raising equity capital for worldwide operations in the United States, China, and India. He designed, planned, and implemented the product development cycle and managed the marketing strategy, strategic alliances, and business development processes”;
- worked as senior research technologist at Kodak for 26 years covering a broad range of materials science technologies where he received several Kodak achievement awards for scientific merit and commercial impact;
- led research and development at Micro Magnetics, focused on a development effort to commercialize a new family of high-performance magnetic micro-sensor products;
- founded, as “president and CEO, a successful venture-backed life science company (Gentra Systems, Inc.), that developed, manufactured, and sold products for genetic testing and research to clinical and research laboratories worldwide.”
SOURCE: Summary and quotations drawn from discussions with six NSF program directors. NSF also provided biographical summaries of all the PDs for review.
BOX 2-9
Example NSF 2014 SBIR Topic Area
EA5. Tools for Learning and Assessment
Topics can include
- tools and kits that empower students to become scientists, engineers, and educators; tools that allow them to design and build things and increase participation or demonstration in hands-on learning related to science, technology, engineering, math, and entrepreneurship of technical products and services;
- adaptive learning environments combined with assessments that provide alternative paths of instruction;
- gesture-based computing applications, semantic analysis, and tools that enable collaborative work with multiple students interacting on content simultaneously;
- education tools that benefit from objects having their own IP address or location based services for new types of communications, assistive technologies, and new applications of benefit primarily to education;
- devices that enable expanded dimensional learning such as 3D modeling, computer aided design (CAD), as well as new materials, technologies, and processes for learning and 3D printing suitable for educational settings;
- Augmented Reality (AR) and tools that layer information over 2D and 3D spaces to provide new environments for learning;
- wearable information centers, power sources, flexible displays, jewelry, glasses, output devices, and input tools that allow students to interface with computers and other devices in creative new ways that help overcome natural or physical barriers to learning;
- sensors and systems that detect student engagement, frustration, or boredom while providing real-time feedback to both students and teachers.
SOURCE: National Science Foundation, 2014 SBIR Solicitation.
Overall, the NSF model is intelligently designed and executed by dedicated and highly credentialed staff that appears to be capable of making the judgments demanded by the system.
Also apparent is that the outcomes reflect the focus on commercialization. NSF reports via its own research that about 70 percent of Phase II awardees reach the market; that figure is largely confirmed by Academies survey data. Yet at the same time few projects are generating large returns, while most are not—as is often the case with high-tech funding or projects with higher than average risks. (See Chapter 4). However, the tight focus on commercialization means that other congressional objectives take on a lower priority, which seems to have detracted attention from the objective of encouraging the participation of women and minorities in the program. It is therefore not yet possible to conclude that the current strategy and focus is generating the results that NSF itself is seeking.


