
3
SBIR Awards at the National Science Foundation
This chapter describes and analyzes Small Business Innovation Research (SBIR) awards made by the National Science Foundation (NSF) during the period 2003 through 2012. This 10-year interval provides sufficient data to analyze trends and the evolution of the program. Selected tables are included in an annex to this chapter. A review of study data sources, methodological approaches, and potential biases can be found in Appendix A of this report.
This chapter undertakes an evaluation of Phase I and Phase II SBIR awards1 in turn, and considers awards from a range of perspectives, including yearly trends, distribution by state, the impact of multiple awards to individual companies, applications and success rates, and awards to businesses owned by women and members of socially and economically disadvantaged groups, as defined by the Small Business Administration (SBA). The previous chapter (Chapter 2) drew on the latter data, together with other sources, to access the status of women and minorities in NSF’s SBIR program.
PHASE I
Phase I SBIR Awards
Following advice from NSF staff, Committee staff2 used awards data reported via SBA. In most years, NSF awarded between 200 and 300 Phase I
___________________
1SBA provided a complete dataset of awards 2003-2012 in response to a FOIA request from the Academies. All references to SBA data in this chapter reference that privately provided data set.
2Effective July 1, 2015, the institution is called the National Academies of Sciences, Engineering, and Medicine. References in this report to the National Research Council, or NRC, are used in a historic context identifying programs prior to July 1.
awards, averaging 260 a year, with a range of fewer than 200 to slightly more than in 500. Figure 3-1 shows the number of Phase I SBIR awards made by NSF from 2003 through 2012.
The number of Phase I awards largely drives the amount of funding committed to Phase I, because Phase I SBIR awards at NSF are typically made close to a set amount—$100,000 through 2008 and $150,000 from 2009 onward. Figure 3-2 shows total funding for Phase I SBIR awards at NSF over the same period. It illustrates the close linkage between the number of Phase I awards and total Phase I funding.
Regarding overall award distributions, NSF must keep a pipeline to new ideas open in the form of Phase I awards, while reserving enough funds to make Phase II awards and then Phase IIB awards. Figure 3-3 shows the percentage of total SBIR funding expended on Phase I by year. On average, NSF provided about 40 percent of total funding to Phase I awards, except for the unusually high percentages for Phase I in 2003 and 2010, and the low percentages for 2004-2005.
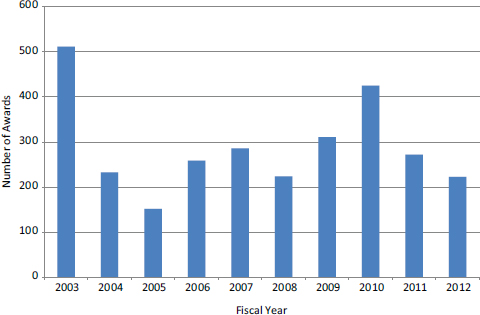
FIGURE 3-1 Number of NSF Phase I SBIR awards, 2003-2012.
SOURCE: Small Business Administration.
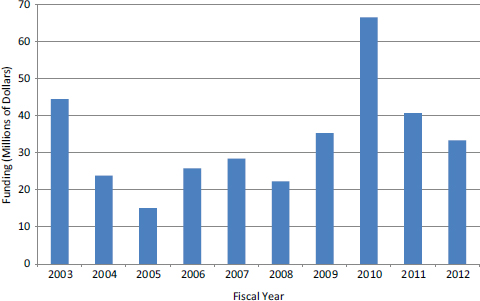
FIGURE 3-2 Funding for NSF Phase I SBIR awards, 2003-2012.
SOURCE: Small Business Administration.
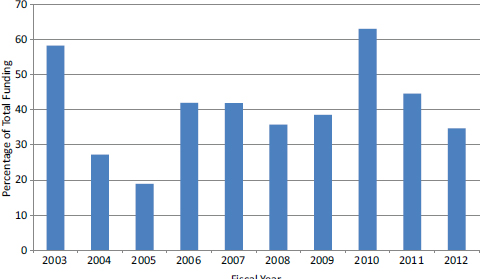
FIGURE 3-3 NSF Phase I SBIR funding as a percentage of total NSF SBIR funding, 2003-2012.
SOURCE: Small Business Administration.
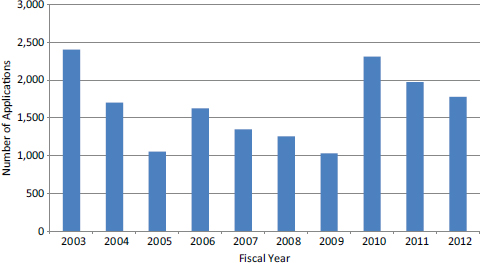
FIGURE 3-4 Number of NSF Phase I SBIR applications, 2003-2012.
SOURCE: National Science Foundation.
Phase I Applications
Figure 3-4 shows the yearly number of applications over this period.3 Fluctuations in the number of applications do not appear to be correlated with external economic activity: 2003 marks the end of the stock market bottom after the dot.com bust, while 2009 marks the aftermath of the 2008 market crash, which continued well into 2010.
Success Rates of Applicants in Phase I
A fluctuating number of Phase I applications, resulted in a fluctuating success rate, that is, in the percentage of applications that are awarded funding. Figure 3-5 shows the percentage of successful applications during the study period.
In general, success rates ranged from 14 to 21 percent, with the exception of 2009, when a low number of applications was received and the success rate spiked. Overall, 17.3 percent of applications resulted in Phase I SBIR awards at NSF.
___________________
3All data referenced as NSF data in this section were provided by NSF directly to the study researchers.
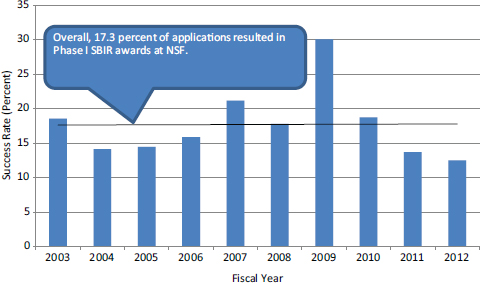
FIGURE 3-5 Success rates for NSF Phase I SBIR applications, 2003-2012.
SOURCE: National Science Foundation.
Phase I Awards and Applications by State
An issue that emerged from the recent reauthorization of the SBIR/STTR programs centers on a concentration of awards in well-known research hubs, and comparatively few awards in less research-intensive regions—a pattern well known in competitively awarded R&D grant programs.
This section reviews awards as well as patterns of applications by state, patterns of ongoing funding via Phase II awards, and contextual information including levels of state gross domestic product (GDP), the amount of research funding deployed in each state, and the distribution of scientists and engineers by state. All of these factors may play a role in the funding distribution. The supporting data tables are presented in the annex of this chapter.
Annex Table 3-1 highlights the wide dispersion in award numbers among the states. States leading in Phase I SBIR awards are California, Massachusetts, New York, Colorado, Pennsylvania, Texas, and Ohio.
The highest average success rate belongs to companies in Wyoming (28.3 percent), which had a low number of applications. Among the states with the highest number of awards, California was near the median with respect to an average success rate of 18.4 percent, as was Massachusetts with an average success rate of 19.2 percent).
The Government Accountability Office (GAO) has noted that the distribution of SBIR awards tends to follow the general distribution of government science
and engineering awards.4 Thus, high-quality projects will not be randomly distributed across the United States.
To examine relationships between some potentially important independent variables and the number of awards, the Committee examined three variables that might explain the differences that remain after accounting for population: research and development (R&D) intensity (percentage of state GDP represented by R&D), the number of scientists and engineers employed per 1000 people, and the population itself. The Committee found modest positive correlations between both R&D variables and the number of awards, as well as the anticipated strong correlation between population size and raw award numbers (see Annex Table 3-5).
Annex Table 3-5 shows that both R&D intensity in the economy and the employment of scientists and engineers are positively correlated with the number of awards—employment of scientists and engineers strongly so. Results were similar when the Pearson r test was applied to rankings of states rather than raw scores for the three variables. Additionally, three high award states with substantially more awards than would be expected given population size (Massachusetts, Maryland, and Colorado) report high levels of scientists and engineering PhDs in their employed workforces.5
The Committee therefore concludes that states with higher rates of R&D spending per dollar of GDP and higher rates of employed scientists and engineers per thousand population are more likely to receive higher numbers of NSF Phase I SBIR awards.
From the findings discussed in the next section, the Committee also discounts another possible explanation—the presence of firms with prior awards—as being of limited explanatory power at NSF where a large majority of awards go to first-time applicants.
From a policy perspective, the Committee concludes that the most important variable to explain the distribution of awards by state is simply population, although increasing R&D spending as a share of GDP and increasing the percentage of employed scientists and engineers are both, ceteris paribus, likely to positively affect Phase I award numbers.
___________________
4Government Accountability Office, Federal Research: Evaluation of Small Business Innovation Research Can Be Strengthened, GAO/RCED-99-114 (Washington, DC: Government Accountability Office, June 1999), p. 17.
5National Science Board, Science and Engineering Indicators 2014, (Arlington, VA: National Science Foundation, 2014), Chapter 3.
Phase I Awards by Company6
Discussions of the SBIR program often reflect a long-held view that the program is held captive to “SBIR mills” that receive multiple awards and generate little in the way of commercial results. Previous reports reveal this view to be unfounded.7
Twenty-two companies received at least six NSF Phase I SBIR awards during the study period (see Annex Table 3-6). The most prolific received fewer than 10 awards. In total, these 22 companies received 157 awards, accounting for 5.4 percent of the 2,896 Phase I awards made by NSF during this period. Overall, 2,009 different companies received at least 1 Phase I award; of these 2,009 companies, 1,504 received only 1 award.
These data indicate that NSF widely distributes Phase I SBIR awards and that, in general, the program does not support companies relying on multiple SBIR awards for survival.
New Companies in the SBIR Program
A positive feature of the SBIR program is that it provides a bridge into the commercial world for new companies as well as early seed funding for companies with few other funding sources. However, these benefits are limited if awards are consistently given to companies that have already benefited from program funding.
At NSF, this is not the case. Figure 3-6 shows the share of Phase I SBIR awards to companies that did not receive a Phase I award during the previous 5 years (the analysis starts at 2008, because the data for the years prior to 2008 are unreliable).8 About 70 percent of awards went to companies that did not receive an award during the previous 5 years, while 30 percent went to companies that did. This finding underscores the extent to which NSF Phase I funding is widely distributed among different companies.9
___________________
6Several difficulties are involved in determining awards by company. SBA data do not include employer identification numbers (EIN) numbers, so companies are identified by name only. Substantial efforts were made to normalize names to account for divergent spelling and punctuation; however, companies also change names, acquire other companies, and spin off subsidiaries among other related activities. These activities cannot be captured using company name alone.
7The issue of SBIR mills is discussed in National Research Council, An Assessment of the SBIR Program (Washington, DC: The National Academies Press, 2008), p. 88, and the conclusion is that mills do not comprise a serious problem.
8“New” companies were identified by taking all company names with awards in a specified area and searching for matches among awards during the previous 5 years. This approach was adopted because NSF does not maintain data on “new” entrants into the program, and simply searching all prior awards (just the previous 5 years) would have introduced bias, because the data set of previous winners continues to increase, which reduces the likelihood that more recent winners would be “new.”
9This is not to say that having a company receive more than a single Phase I or Phase II SBIR award is necessarily a negative outcome. Some companies are highly inventive and pursue promising opportunities. The more appropriate question is whether the mix between single and multiple award companies is appropriate, and, even more importantly, whether it results from a fair process or whether the process exhibits favoritism or if some companies are exhibiting “troll” behavior.
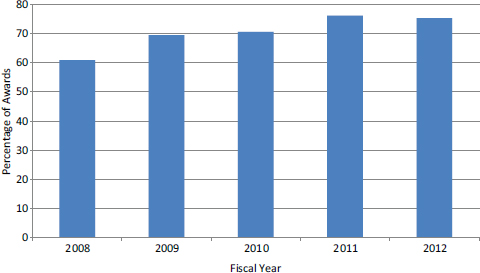
FIGURE 3-6 Percentage of NSF Phase I SBIR awards to non-winners from previous 5 years, 2008-2012.
SOURCE: Small Business Administration.
Interviews with NSF program managers further supported the view that NSF makes a concerted effort to distribute funds widely. For example, one program manager noted that he makes an effort to limit the number of awards to an individual company because success is difficult to predict and therefore developing a portfolio of supported companies is an appropriate approach.
Demographics of Phase I Winning Companies
This section reviews data provided by NSF on awards to and applications from the demographic groups, “Minority-owned Small Business (MOSM) and “Woman-owned Small Businesses” (WOSB).10 The implications of the data are discussed in Chapter 2.
It should be noted that the NSF/SBA data provides no breakout of the various groups that make up the minority groups. The category contains Asian-Americans, many of whom are prominent—not disadvantaged—in technology
___________________
10Small Business Administration, Definition of Socially and Economically Disadvantaged Individuals, accessed on March 31, 2014, <http://www.sdba.com/sba_8%28a%29.htm>. Data from NSF rely on self-identification of demographic characteristics by companies during the application process. Self-identification is voluntary, and anecdotal evidence indicates incentives both to overreport and underreport.
fields. Their inclusion has tended to obscure the extremely poor performance of the African-American, Native-American, and Hispanic groups. The average performance would likely be lower without the inclusion of the Asian-American groups. This point was revealed by the Academies survey that was able to obtain a breakdown by category.
Minority-owned Small Businesses (MOSBs)
In the context of applications and awards, three data sets are considered: MOSB applications and MOSB awards as a percentage of overall applications and awards, and the share of minority companies in the program.11
MOSB Phase I Applications
Figure 3-7 shows the number of applications from self-identified MOSBs during the study period. There is a spike in the number of MOSB in applications most recently in 2010, but this is followed by decreases in the following two years.
MOSB Phase I Success Rates
Figure 3-8 shows the comparative success rates of MOSB and non-MOSB applicants, over the study period. The question is whether MOSBs are less or more successful than non-MOSBs in getting awards.
The success rates of MOSB applicants are strikingly lower than those of non-MOSB applicants in every year. For some agencies, one might consider that winning firms tend to have a stronger track record and that minority firms are less well established. At NSF, however, few companies are “established” in that sense and most awards go to new entrants.
MOSB Phase I Awards
As depicted in Figure 3-9, MOSBs received fewer Phase I SBIR awards from NSF than did non-MOSBs during the entire study period. As shown in Figure 3-10, MOSBs accounted on average for about 10.4 percent of all Phase I awards, and overall this share has declined steadily (see Figure 3-10).
These data show that MOSB participation in Phase I of the NSF SBIR program has declined rather steadily over the study period. The decline has been not only in terms of applications from MOSBs, but in terms of awards to MOSBs.
___________________
11For a definition of Socially and Economically Disadvantaged Individuals, see Small Business Administration, see <https://www.sba.gov/content/social-disadvantage-eligibility>. Accessed on May 29, 2015.
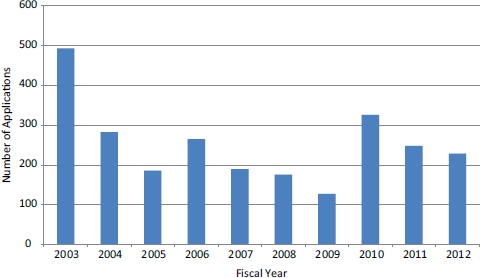
FIGURE 3-7 NSF Phase I SBIR applications from MOSBs, 2003-2012.
SOURCE: National Science Foundation.
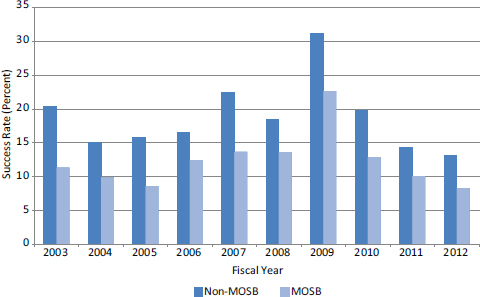
FIGURE 3-8 A Comparison of NSF Phase I SBIR application success rates for MOSB and non-MOSB applicants, 2003-2012.
SOURCE: National Science Foundation.
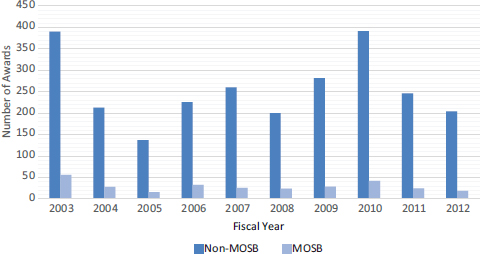
FIGURE 3-9 NSF Phase I SBIR awards for MOSBs and non-MOSBs, 2003-2012.
SOURCE: National Science Foundation.
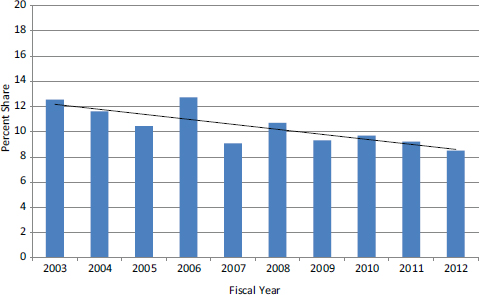
FIGURE 3-10 MOSB share of NSF Phase I SBIR awards, 2003-2012.
SOURCE: National Science Foundation.
Woman-owned Small Businesses (WOSBs)
The congressional mandate to foster participation from socially and economically disadvantaged groups in the SBIR program has historically been interpreted to include WOSBs.
WOSB Phase I Applications
Figure 3-11 appears to show a similar pattern for WOSB Phase 1 applications as was seen for total applications and for MOSB applications (i.e., a repetitive pattern of spiking every three-to-four years followed by declines in the interim). WOSB applications numbered 359 in 2010, compared with 326 MOSB applications in 2010.
Figure 3-12 shows a slight upward trend in the WOSB share of total applications over the study period. During the first 6 years of the study period, the WOSBs averaged 15 percent of total applications, and during the last 4 years of the study period, averaged 17.7 percent.
WOSB Phase I Success Rates
Figure 3-13 shows that WOSBs nearly consistently experienced lower success rates for Phase I compared to other companies. However, the differences were not as dramatic for WOSBs as for MOSBs, and in one year, 2011, the success rates were essentially identical.
WOSB Phase I Awards
The numbers of awards displayed in Figure 3-14 require context. Overall, WOSBs accounted for about 12.9 percent of total Phase I SBIR awards during the study period. The averages for each year are provided in Figure 3-15. The WOSB number of Phase I awards has been increasing slowly, largely reflecting the modest increase in WOSB applications described above.
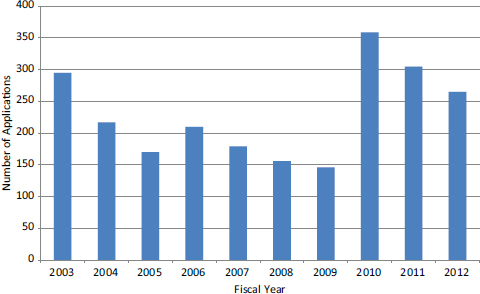
FIGURE 3-11 NSF Phase I SBIR applications from WOSBs, 2003-2012.
SOURCE: National Science Foundation.
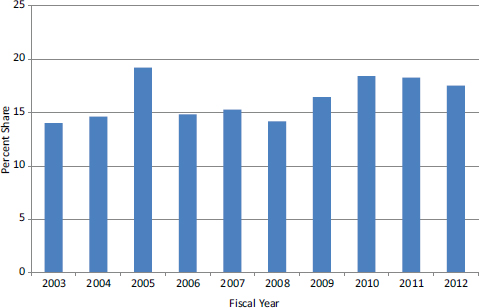
FIGURE 3-12 WOSB share of NSF Phase I SBIR applications, 2003-2012.
SOURCE: National Science Foundation.
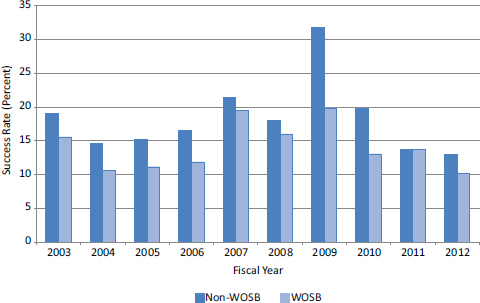
FIGURE 3-13 Comparison of NSF Phase I SBIR success rates for WOSB and non-WOSB applicants, 2003-2012.
SOURCE: National Science Foundation.
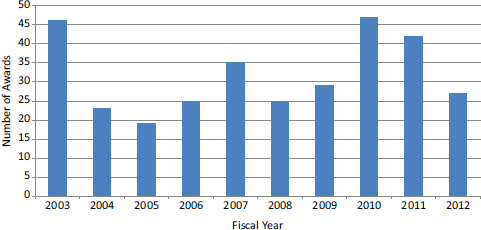
FIGURE 3-14 NSF Phase I SBIR awards to WOSBs, 2003-2012.
SOURCE: Small Business Administration.
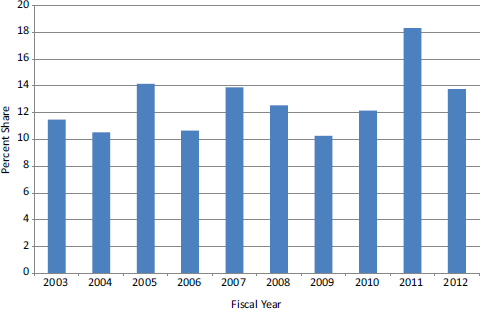
FIGURE 3-15 WOSB share of NSF Phase I SBIR awards, 2003-2012.
SOURCE: National Science Foundation.
PHASE II
Phase II Awards
Figure 3-16 shows the number of Phase II SBIR awards made by NSF during the study period. Following spikes in the number of awards in 2004-2005, the number dropped, but has since increased.
Phase II Applications and Success Rates
Phase II applications, and, in the end awards, have largely been driven by Phase I, because Phase II funding was contingent on completion of a Phase I award until 2011. The number of Phase II applications varied considerably by year, ranging from 133 in 2006 to more than 300 in 2004 and 2011 (see Figure 3-17). This variation is largely explained by the number of Phase I awards made during the previous year (see Figure 3-18).
Analysis using Pearson’s r test indicates that the distribution of Phase II awards is strongly correlated with the distribution of Phase I awards, lagged by 1 year (r = 0.73).
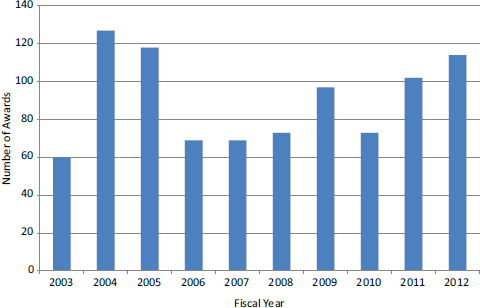
FIGURE 3-16 NSF Phase II SBIR awards, 2003-2012.
SOURCE: National Science Foundation.
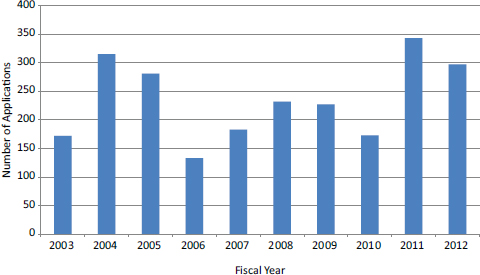
FIGURE 3-17 NSF Phase II SBIR applications, 2003-2012.
SOURCE: National Science Foundation.
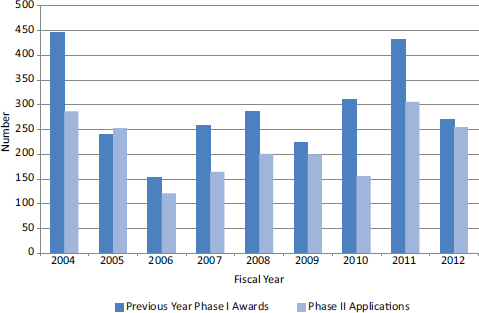
FIGURE 3-18 NSF Phase I SBIR awards made the previous year and Phase II applications, 2003-2012.
SOURCE: National Science Foundation.
As expected, success rates for Phase II were considerably higher than for Phase I (see Figure 3-19). The success rate for Phase II averaged 44 percent. Combining Phase I and Phase II success rates reveals that over the study period, on average, a company applying for a Phase I award had an 8.6 percent chance of receiving both a Phase I and a Phase II award at NSF.
Phase II Awards and Applications by State
The data presented in Annex Table 3-3 show Phase II SBIR applications, awards, and success rates by state, aggregated for the period 2003-2012. As with Phase I (see above), Phase II shows a wide dispersion in award numbers across states.
Not including California where companies experienced an average success rate of 49.8 percent, the average success rate was 41.1 percent. No analysis was conducted to identify specific factors that might account for the higher Phase II success rate in California. As discussed below, however, additional attention by NSF may be warranted to assess why there are differences.
The above section on Phase I awards by state discusses several factors that are related to participation in the SBIR program. This section discusses the extent to which states (such as California) differ in the capacity of their companies to convert Phase I awards into Phase II awards (see Annex Table 3-4).
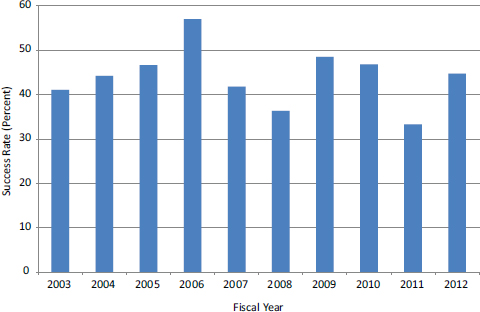
FIGURE 3-19 NSF Phase II SBIR application success rates, 2003-2012.
SOURCE: National Science Foundation.
For states with small numbers of Phase II awards (25 states reported fewer than 10 Phase II awards), the conversion rates are erratic and hence unsuitable for detailed analysis. For the remaining states, 16 had conversion rates greater than 40 percent, two had rates less than 30 percent, and nine had rates between 30 percent and 40 percent. As with Phase I, for all states there is no statistically significant correlation between the number of awards by state and the success rate (Pearson’s r = 0.117. However, for the 25 states with at least 10 awards, there is a weak positive relationship (Pearson’s r = 0.4997).
At the same time, the correlation between Phase I awards and Phase II awards is very strong (Pearson’s r = 0.99), which confirms that the distribution of Phase II awards is strongly dependent on the distribution of Phase I awards.
Phase II Awards by Company
Because Phase I awards were widely distributed among companies it should come as no surprise that Phase II awards were also widely distributed. NSF provided 981 Phase II awards during the study period. Only five companies received five or more awards, claiming 2.8 percent of the total. The remaining awards went to 787 different companies, with 647 receiving only one award. Annex Table 3-7 lists the companies that received five or more Phase II awards.
This finding is not surprising given the preponderance of companies that received only one Phase I award, which automatically made them eligible for only one Phase II award. Moreover, discussions with agency staff revealed an interest within NSF to widely distribute Phase II awards.
Demographics of Phase II Winning Companies
This section relies on data from NSF. Given the limitations of these data, the discussion below does not consider the important question of the composition of MOSB ownership, in particular the share of awards to African-American, Hispanic, and Native-American-owned firms, patterns which are addressed in Chapter 2 of this report.
Minority-owned Small Businesses (MOSB)
This section reviews applications, success rates, and Phase II awards for MOSBs, which are companies that self-certify at least 51 percent ownership by members of a designated minority group as defined by SBA.
MOSB Phase II Applications
The number of Phase II applications from MOSBs during the study period ranged from a high of 41 in 2004, to a low of 12 in 2010 (see Figure 3-20). To a considerable extent, this variation is driven by the number of Phase I awards
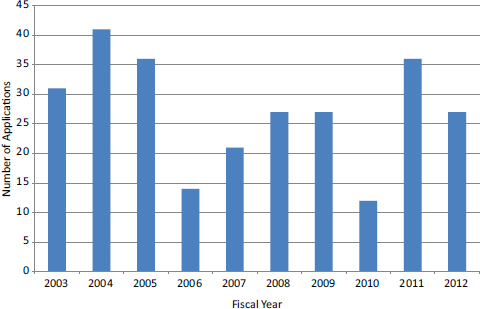
FIGURE 3-20 NSF Phase II SBIR applications from MOSBs, 2003-2012.
SOURCE: National Science Foundation.
BOX 3-1
Analyzing the Participation of Women and Minorities
One of the four primary congressional objectives for the SBIR/STTR program is “to foster and encourage participation by minority and disadvantaged persons in technological innovation.”a This has in the context of SBIR been taken to mean women and minorities. In practical terms, however, SBA has focused attention in two ways. First, the SBA policy directive lists races/ethnicities which, in its view, qualify as disadvantaged. These include African-American, Hispanic, and Native Americans, as well as Asian Americans. Second, attention is focused solely on firms that are majority owned by women or minorities. As a result, agency data covers only the latter—woman and minority-owned firms—rather than broader measures of “participation.”
The implications of these issues are discussed in Chapter 2, where the impact of these narrowed definitions is fully addressed. In the present Chapter 3, we review agency data only, which covers applications and awards to woman-owned firms and firms owned by “socially and economically disadvantaged groups,” (as defined in the SBA policy directive).
__________________
aP. L. 97-219, § 2,July 22, 1982, 96 Stat. 217.
during the preceding year (this is not a 1:1 correspondence, because an NSF Phase I winner may apply for a Phase II award 1 year after the conclusion of its Phase I award, which would be 18 months or even 2 years after the date of the Phase I award). Statistical testing shows a modest positive correlation (Pearson’s r = 0.43).
Figure 3-21 compares the number of MOSB Phase I awards lagged one year with MOSB Phase II awards. As might be expected, the two groups follow similar patterns. At the time, the figure shows that many Phase I MOSB awardees do not receive Phase II awards.
MOSB Success Rates
As with Phase I, it is important to compare MOSB Phase II success rates with non-MOSB success rates (see Figure 3-22). For the entire study period, the average success rate for MOSB applicants was 36 percent, 12 percentage points lower than that for non-MOSB applicants (44 percent). The disparity was particularly pronounced in 2008 and 2009 (see Figure 3-22). Unlike Phase I, for which the gaps between MOSB and non-MOSB success rates were almost uniformly negative, in Phase II the gaps were more variable, positive in 4 years and negative in 6 years.
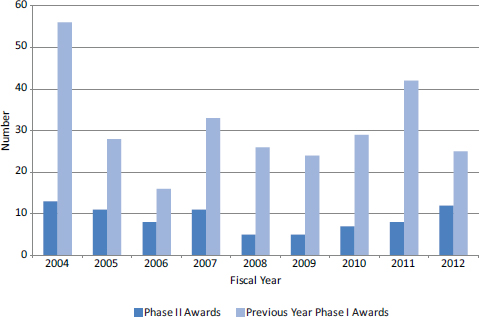
FIGURE 3-21 Comparison of previous year’s number of MOSB NSF Phase I awards and MOSB Phase II awards, 2004-2012.
SOURCE: National Science Foundation.
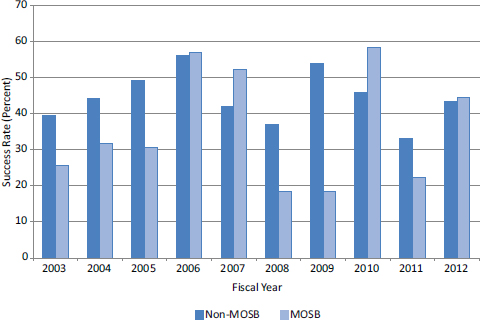
FIGURE 3-22 Comparison of NSF Phase II SBIR success rates for MOSB and non-MOSB applicants, 2003-2012.
SOURCE: National Science Foundation.
It is also interesting to note that when MOSB applications are low, such as in 2006, 2007, and 2010, the MOSB success rate is highest and exceeds the non-MOSB rate. Similarly, the low success years are those with disproportionately more applications.
MOSB Phase II Awards
Figure 3-23 compares the number of Phase II awards to MOSB and non-MOSB applicants. The MOSB share of Phase II awards, and the trend in that share, 2003-2012, can be seen in Figure 3-24.
Woman-owned Small Businesses (WOSB)
This section reviews Phase II applications, success rates, and awards for WOSBs, that is, small business concerns which are at least 51 percent owned by one or more women, or at least 51 percent of the stock is owned by one or more women, and whose management and daily business operations are controlled by one or more women.
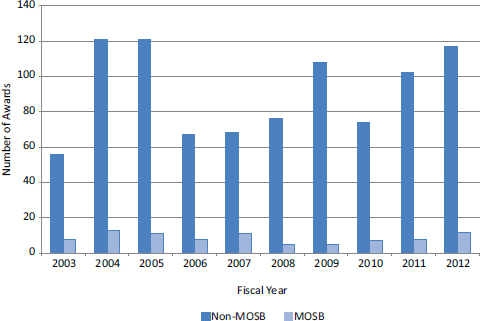
FIGURE 3-23 NSF Phase II SBIR awards to MOSB and non-MOSB firms, 2003-2012.
SOURCE: National Science Foundation.
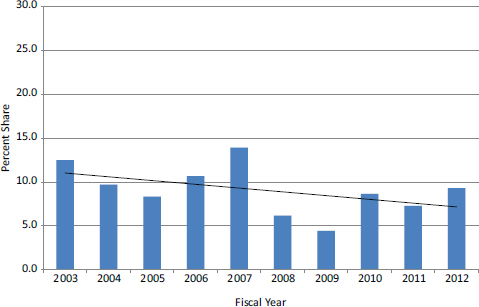
FIGURE 3-24 MOSB share of NSF Phase II SBIR awards and trend line, 2003-2012.
SOURCE: National Science Foundation.
WOSB Phase II Applications
Figure 3-25 shows the number of Phase II applications from WOSBs during the study period. Increases in the number of WOSB applications in 2011 and 2012 helped to drive an apparent overall upward trend across the study period. Note that Phase I applications in Figure 3-17 do not appear to show a similar upward trend.
WOSB Success Rates
Figure 3-26 shows the comparative success rates for WOSB and non-WOSB Phase II SBIR applicants at NSF. Differences between the two populations are captured quite clearly in the “gap” between the rates. For the entire period, WOSBs had an average success rate of 36 percent, lower than non-WOSB applicants (44 percent). For the 5 most recent years, the gap in the average success rates closed to 2 percentage points (38 percent compared to 40 percent).
WOSB Phase II Awards
Figure 3-27 shows the numbers of Phase II awards to WOSB and non-WOSB applicants during the study period. The trend line in Figure 3-28 indicates that the WOSB share of total awards apparently rebounded from relative lows at the beginning of the study period to result in an overall upward trend. From 2005 on, the trend was essentially flat, with award shares ranging from 14.2 percent in 2009 to 7.3 percent in 2011 and averaging 10.5 percent for 2005-2012.
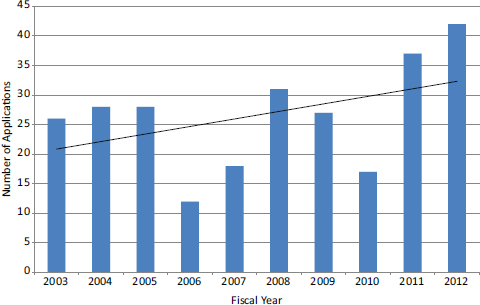
FIGURE 3-25 Number of NSF Phase II SBIR applications from WOSBs, 2003-2012.
SOURCE: National Science Foundation.
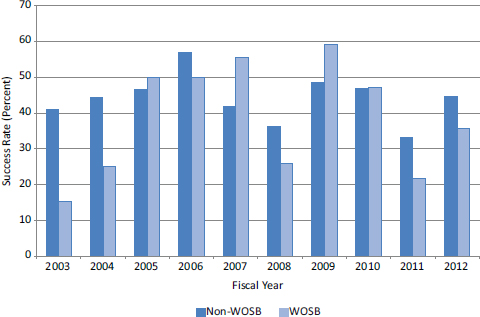
FIGURE 3-26 Comparison of NSF Phase II SBIR success rates for WOSB and non-WOSB applicants, 2003-2012.
SOURCE: National Science Foundation.
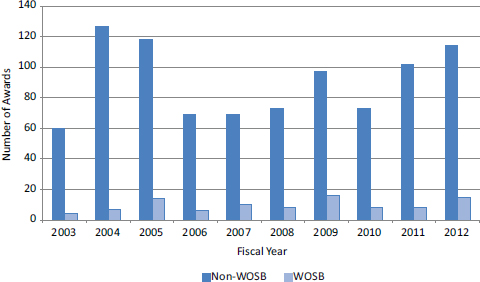
FIGURE 3-27 Comparison of NSF Phase II SBIR awards to WOSB and non-WOSB applicants, 2003-2012.
SOURCE: National Science Foundation.
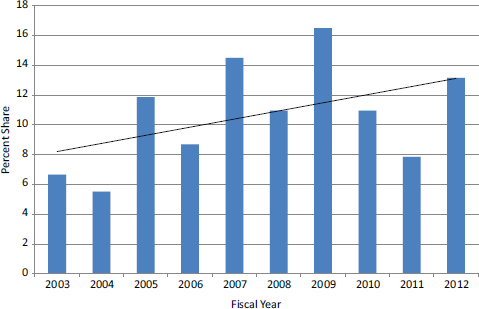
FIGURE 3-28 WOSB share of NSF Phase SBIR II awards, 2003-2012.
SOURCE: National Science Foundation.
ANNEX
DATA TABLES
ANNEX TABLE 3-1 NSF Phase I SBIR Applications, Awards, and Success Rate by State, 2003-2012
| State | Number of Awards | Number of Applications | Success Rate (Percent) |
| CA | 545 | 2,963 | 18.4 |
| MA | 301 | 1,569 | 19.2 |
| NY | 150 | 789 | 19.0 |
| CO | 127 | 731 | 17.4 |
| PA | 122 | 526 | 23.2 |
| TX | 117 | 939 | 12.5 |
| OH | 100 | 646 | 15.5 |
| MD | 91 | 651 | 14.0 |
| IL | 89 | 453 | 19.6 |
| MI | 88 | 523 | 16.8 |
| NJ | 85 | 632 | 13.4 |
| NC | 69 | 300 | 23.0 |
| FL | 62 | 494 | 12.6 |
| VA | 62 | 727 | 8.5 |
| GA | 61 | 292 | 20.9 |
| WI | 54 | 174 | 31.0 |
| MN | 52 | 341 | 15.2 |
| AZ | 47 | 434 | 10.8 |
| CT | 41 | 253 | 16.2 |
| WA | 40 | 282 | 14.2 |
| AR | 38 | 168 | 22.6 |
| NM | 37 | 229 | 16.2 |
| SC | 37 | 138 | 26.8 |
| MO | 35 | 188 | 18.6 |
| UT | 35 | 219 | 16.0 |
| IN | 34 | 193 | 17.6 |
| OR | 32 | 196 | 16.3 |
| MT | 31 | 149 | 20.8 |
| KY | 22 | 110 | 20.0 |
| IA | 21 | 73 | 28.8 |
| ME | 20 | 64 | 31.3 |
| TN | 19 | 132 | 14.4 |
| AL | 17 | 152 | 11.2 |
| KS | 14 | 95 | 14.7 |
| NE | 14 | 40 | 35.0 |
| NH | 14 | 84 | 16.7 |
| OK | 13 | 107 | 12.1 |
| WY | 13 | 47 | 27.7 |
| DE | 12 | 125 | 9.6 |
ANNEX TABLE 3-1 Continued
| State | Number of Awards | Number of Applications | Success Rate (Percent) |
| ID | 12 | 61 | 19.7 |
| HI | 10 | 59 | 16.9 |
| LA | 10 | 48 | 20.8 |
| MS | 9 | 35 | 25.7 |
| ND | 8 | 32 | 25.0 |
| SD | 8 | 55 | 14.5 |
| VT | 8 | 76 | 10.5 |
| AK | 6 | 23 | 26.1 |
| WV | 6 | 50 | 12.0 |
| PR | 4 | 26 | 15.4 |
| RI | 4 | 38 | 10.5 |
| NV | 3 | 74 | 4.1 |
| DC | 2 | 17 | 11.8 |
SOURCE: National Science Foundation.
ANNEX TABLE 3-2 State Rankings: Phase I Awards, Science and Engineering PhDs per 1,000 Populations and R&D as Percentage of State GDP
| State | Number of Awards | R&D/GDP (Percent) | S&E PhDs/per 1,000 Pop | Population | Rank Awards | Rank R&D/GDP (Percent) | RankS&E PhDs/per 1,000 Pop | Pop. Rank |
| CA | 545 | 4.39 | 0.64 | 37,253,956 | 1 | 5 | 7 | 1 |
| MA | 301 | 5.36 | 1.16 | 6,547,629 | 2 | 3 | 2 | 14 |
| NY | 150 | 1.51 | 0.58 | 19,378,102 | 3 | 33 | 11 | 3 |
| CO | 127 | 2.42 | 0.60 | 5,029,196 | 4 | 19 | 8 | 22 |
| PA | 122 | 2.34 | 0.53 | 12,702,379 | 7 | 21 | 14 | 6 |
| TX | 117 | 1.59 | 0.38 | 25,145,561 | 6 | 30 | 32 | 2 |
| OH | 100 | 2.16 | 0.41 | 11,536,504 | 5 | 25 | 27 | 7 |
| MD | 91 | 6.23 | 1.05 | 5,773,552 | 9 | 2 | 3 | 19 |
| IL | 89 | 2.46 | 0.43 | 12,830,632 | 10 | 18 | 22 | 5 |
| MI | 88 | 4.00 | 0.43 | 9,883,640 | 11 | 6 | 23 | 8 |
| NJ | 85 | 3.70 | 0.56 | 8,791,894 | 12 | 8 | 13 | 11 |
| NC | 69 | 2.05 | 0.50 | 9,535,483 | 15 | 27 | 20 | 10 |
| FL | 62 | 1.09 | 0.25 | 18,801,310 | 13 | 37 | 49 | 4 |
| VA | 62 | 2.38 | 0.57 | 8,001,024 | 8 | 20 | 12 | 12 |
| GA | 61 | 1.36 | 0.36 | 9,687,653 | 14 | 35 | 35 | 9 |
| WI | 54 | 2.18 | 0.38 | 5,686,986 | 18 | 24 | 33 | 20 |
| MN | 52 | 2.75 | 0.50 | 5,303,925 | 19 | 16 | 19 | 21 |
| AZ | 47 | 2.22 | 0.32 | 6,392,017 | 17 | 23 | 40 | 16 |
| CT | 41 | 3.35 | 0.65 | 3,574,097 | 16 | 12 | 6 | 29 |
ANNEX TABLE 3-2 Continued
| State | Number of Awards | R&D/GDP (Percent) | S&E PhDs/per 1,000 Pop | Population | Rank Awards | Rank R&D/GDP (Percent) | RankS&E PhDs/per 1,000 Pop | Pop. Rank |
| WA | 40 | 4.87 | 0.60 | 6,724,540 | 22 | 4 | 9 | 13 |
| AR | 38 | 0.57 | 0.23 | 2,915,918 | 23 | 49 | 51 | 32 |
| NM | 37 | 8.01 | 0.93 | 2,059,179 | 20 | 1 | 4 | 36 |
| SC | 37 | 1.47 | 0.33 | 4,625,364 | 27 | 34 | 39 | 24 |
| MO | 35 | 3.79 | 0.39 | 5,988,927 | 29 | 7 | 30 | 18 |
| UT | 35 | 2.70 | 0.47 | 2,763,885 | 25 | 17 | 21 | 34 |
| IN | 34 | 2.34 | 0.38 | 6,483,802 | 26 | 22 | 31 | 15 |
| OR | 32 | 2.89 | 0.52 | 3,831,074 | 24 | 15 | 17 | 27 |
| MT | 31 | 1.07 | 0.52 | 989,415 | 21 | 38 | 16 | 44 |
| KY | 22 | 0.93 | 0.28 | 4,339,367 | 31 | 42 | 45 | 26 |
| IA | 21 | 2.00 | 0.36 | 3,046,355 | 34 | 28 | 36 | 30 |
| ME | 20 | 0.95 | 0.37 | 1,328,361 | 33 | 41 | 34 | 41 |
| TN | 19 | 1.56 | 0.41 | 6,346,105 | 30 | 32 | 28 | 17 |
| AL | 17 | 2.16 | 0.34 | 4,779,736 | 28 | 26 | 37 | 23 |
| KS | 14 | 1.58 | 0.29 | 2,853,118 | 37 | 31 | 44 | 33 |
| NE | 14 | 1.03 | 0.33 | 1,826,341 | 47 | 39 | 38 | 38 |
| NH | 14 | 3.53 | 0.43 | 1,316,470 | 38 | 10 | 24 | 42 |
| OK | 13 | 0.70 | 0.30 | 3,751,351 | 32 | 48 | 42 | 28 |
| WY | 13 | 0.29 | 0.28 | 563,626 | 35 | 51 | 48 | 51 |
| DE | 12 | 3.70 | 0.75 | 897,934 | 36 | 9 | 5 | 45 |
| ID | 12 | 3.20 | 0.40 | 1,567,582 | 45 | 13 | 29 | 39 |
| HI | 10 | 1.02 | 0.50 | 1,360,301 | 39 | 40 | 18 | 40 |
| LA | 10 | 0.53 | 0.28 | 4,533,372 | 40 | 50 | 46 | 25 |
| MS | 9 | 0.89 | 0.28 | 2,967,297 | 43 | 44 | 47 | 31 |
| ND | 8 | 1.32 | 0.42 | 672,591 | 41 | 36 | 26 | 48 |
| SD | 8 | 0.71 | 0.31 | 814,180 | 44 | 47 | 41 | 46 |
| VT | 8 | 1.75 | 0.53 | 625,741 | 42 | 29 | 15 | 49 |
| AK | 6 | 0.72 | 0.42 | 710,231 | 49 | 46 | 25 | 47 |
| WV | 6 | 0.93 | 0.30 | 1,852,994 | 48 | 43 | 43 | 37 |
| RI | 4 | 2.96 | 0.59 | 1,052,567 | 50 | 14 | 10 | 43 |
| NV | 3 | 0.75 | 0.25 | 2,700,551 | 46 | 45 | 50 | 35 |
| DC | 2 | 3.44 | 4.79 | 601,723 | 51 | 11 | 1 | 50 |
SOURCES: SBA SBIR awards database (awards data); U.S. Census (population); NSF Science and Engineering Indicators 2014 (R&D%GNP; scientists and engineers per 1,000 populations).
ANNEX TABLE 3-3 NSF Phase II SBIR Awards, Proposals, and Success Rates by State, 2003-2012
| State | Number of Awards | Number of Proposals | Success Rate (Percent) |
| CA | 215 | 432 | 49.8 |
| MA | 119 | 266 | 44.7 |
| NY | 60 | 130 | 46.2 |
| TX | 49 | 102 | 48.0 |
| CO | 47 | 116 | 40.5 |
| OH | 33 | 79 | 41.8 |
| MD | 30 | 77 | 39.0 |
| PA | 30 | 98 | 30.6 |
| MI | 27 | 70 | 38.6 |
| IL | 26 | 62 | 41.9 |
| FL | 25 | 55 | 45.5 |
| NC | 22 | 56 | 39.3 |
| GA | 21 | 51 | 41.2 |
| NJ | 19 | 69 | 27.5 |
| WI | 19 | 35 | 54.3 |
| VA | 16 | 53 | 30.2 |
| AZ | 15 | 44 | 34.1 |
| SC | 15 | 25 | 60.0 |
| CT | 14 | 37 | 37.8 |
| MN | 14 | 48 | 29.2 |
| OR | 14 | 26 | 53.8 |
| WA | 14 | 26 | 53.8 |
| AR | 12 | 36 | 33.3 |
| IN | 12 | 30 | 40.0 |
| MT | 11 | 22 | 50.0 |
| UT | 11 | 24 | 45.8 |
| KY | 10 | 19 | 52.6 |
| NM | 9 | 34 | 26.5 |
| IA | 8 | 11 | 72.7 |
| KS | 8 | 15 | 53.3 |
| MO | 8 | 27 | 29.6 |
| HI | 6 | 10 | 60.0 |
| LA | 6 | 7 | 85.7 |
| ND | 6 | 9 | 66.7 |
| OK | 6 | 13 | 46.2 |
| AL | 5 | 15 | 33.3 |
| VT | 5 | 7 | 71.4 |
| WY | 5 | 13 | 38.5 |
| ID | 4 | 11 | 36.4 |
| NH | 4 | 10 | 40.0 |
| TN | 4 | 17 | 23.5 |
| ME | 3 | 16 | 18.8 |
| DC | 2 | 3 | 66.7 |
| DE | 2 | 8 | 25.0 |
| MS | 2 | 9 | 22.2 |
ANNEX TABLE 3-3 Continued
| State | Number of Awards | Number of Proposals | Success Rate (Percent) |
| NE | 2 | 10 | 20.0 |
| NV | 2 | 4 | 50.0 |
| PR | 2 | 4 | 50.0 |
| RI | 1 | 4 | 25.0 |
| SD | 1 | 5 | 20.0 |
| WV | 1 | 7 | 14.3 |
| AK | 0 | 3 | 0 |
SOURCE: Small Business Administration.
ANNEX TABLE 3-4 NSF Phase II SBIR Awards and Conversion Rates by State, 2003-2012
| State | Number of Awards | Phase I-Phase II Conversion Rate (Percent) | ||
| CA | 215 | 39.4 | ||
| MA | 119 | 39.5 | ||
| NY | 60 | 40.0 | ||
| TX | 49 | 41.9 | ||
| CO | 47 | 37.0 | ||
| OH | 33 | 33.0 | ||
| MD | 30 | 33.0 | ||
| PA | 30 | 24.6 | ||
| MI | 27 | 30.7 | ||
| IL | 26 | 29.2 | ||
| FL | 25 | 40.3 | ||
| NC | 22 | 31.9 | ||
| GA | 21 | 34.4 | ||
| NJ | 19 | 22.4 | ||
| WI | 19 | 35.2 | ||
| VA | 16 | 25.8 | ||
| AZ | 15 | 31.9 | ||
| SC | 15 | 40.5 | ||
| CT | 14 | 34.1 | ||
| MN | 14 | 26.9 | ||
| OR | 14 | 43.8 | ||
| WA | 14 | 35.0 | ||
| AR | 12 | 31.6 | ||
| IN | 12 | 35.3 | ||
| MT | 11 | 35.5 | ||
| UT | 11 | 31.4 | ||
| KY | 10 | 45.5 | ||
| NM | 9 | 24.3 | ||
| IA | 8 | 38.1 | ||
ANNEX TABLE 3-4 Continued
| State | Number of Awards | Phase I-Phase II Conversion Rate (Percent) | ||
| KS | 8 | 57.1 | ||
| MO | 8 | 22.9 | ||
| HI | 6 | 60.0 | ||
| LA | 6 | 60.0 | ||
| ND | 6 | 75.0 | ||
| OK | 6 | 46.2 | ||
| AL | 5 | 29.4 | ||
| VT | 5 | 62.5 | ||
| WY | 5 | 38.5 | ||
| ID | 4 | 33.3 | ||
| NH | 4 | 28.6 | ||
| TN | 4 | 21.1 | ||
| ME | 3 | 15.0 | ||
| DC | 2 | 100.0 | ||
| DE | 2 | 16.7 | ||
| MS | 2 | 22.2 | ||
| NE | 2 | 14.3 | ||
| NV | 2 | 66.7 | ||
| PR | 2 | 50.0 | ||
| RI | 1 | 25.0 | ||
| SD | 1 | 12.5 | ||
| WV | 1 | 16.7 | ||
| AK | 0 | 0.0 | ||
SOURCE: National Science Foundation.
ANNEX TABLE 3-5 Explaining Differences in Observed Award Distributions by State, 2003-2012
| Variable 1 | Variable 2 | Pearson r score |
| Awards | R&D as Percent of GDP | 0.373 |
| Awards | S&E PhDs employed per 1,000 pop | 0.441 |
| Awards | Population | 0.789 |
| Awards-rank | R&D%GDP-rank | 0.473 |
| Awards-rank | S&E PhDs-rank | 0.449 |
| Awards-rank | Pop-rank | 0.818 |
NOTE: The Pearson r test for awards/employed scientists and engineers excludes the District of Columbia, which is an outlier in opposite directions on both arrays.
SOURCES: Small Business Association SBIR awards database (awards data); U.S. Census (population); NSF Science and Engineering Indicators 2014 (R&D%GDP; scientists and engineers per 1,000 population).
ANNEX TABLE 3-6 Companies Receiving More Than Five NSF Phase I SBIR Awards, 2003-2012
| Company Name | Number of Phase I SBIR Awards | Percentage of all Phase I SBIR Awards |
| Resodyn | 9 | 0.3 |
| Sinmat | 9 | 0.3 |
| TDA Research | 9 | 0.3 |
| Tetramer Technologies | 9 | 0.3 |
| Lynntech | 8 | 0.3 |
| Micro Magnetics | 8 | 0.3 |
| Radiation Monitoring Devices | 8 | 0.3 |
| Sensor Electronic Technology | 8 | 0.3 |
| Advanced Diamond Technologies | 7 | 0.2 |
| BioDetection Instruments | 7 | 0.2 |
| Luna Innovations | 7 | 0.2 |
| Structured Materials Industries | 7 | 0.2 |
| Uncopiers | 7 | 0.2 |
| Advanced Thermal Technologies | 6 | 0.2 |
| Barrett Technology | 6 | 0.2 |
| CCVD dba MicroCoating Technologies (MCT) | 6 | 0.2 |
| Inscent | 6 | 0.2 |
| Materials Modification | 6 | 0.2 |
| NanoSonic | 6 | 0.2 |
| NexTech Materials | 6 | 0.2 |
| Sun Innovations | 6 | 0.2 |
| SVT Associates | 6 | 0.2 |
| Total | 157 | 5.4 |
SOURCE: Small Business Administration.
ANNEX TABLE 3-7 Companies Receiving Five or More NSF Phase II SBIR Awards, 2003-2012
| Company Name | Number of Phase II SBIR Awards | Percent of all Phase II SBIR Awards |
| Lynntech | 7 | 0.7 |
| Faraday Technology | 5 | 0.5 |
| TDA Research | 5 | 0.5 |
| Tetramer Technologies | 5 | 0.5 |
| WTE | 5 | 0.5 |
| Total | 27 | 2.7 |
SOURCE: Small Business Administration.


