
1
Introduction and Background1
The U.S. Department of Agriculture (USDA) Economic Research Service’s (ERS) Food Availability Data System (FADS) produces three distinct but related data series on food and nutrient availability for consumption: food availability data, loss-adjusted food availability data, and nutrient availability.2 FADS is illustrated in Figure 1-1.
The data serve as popular proxies for actual consumption at the national level for more than 200 commodities (e.g., fresh spinach, beef, and eggs). The core Food Availability (FA) data series provides data on the amount of food available, per capita, for human consumption in the United States with data back to 1909 for many commodities. As illustrated in Figure 1-1, FADS uses a food balance approach that relies on available data on annual supply of a commodity (e.g., sum of beginning stocks, production, and imports) in a specific year and subtracts known non-U.S. and nonfood uses of the product in that year (exports, farm and industrial uses, and ending stocks) to get an estimate of the amount of the
________________
1This background information comes from three sources: the presentation of Mary Bohman, administrator of the Economic Research Service, in the introductory session of the workshop; the presentation of Mary Muth, RTI International and chair of the steering committee that organized the workshop, in the introductory session of the workshop; and the Request for Proposal prepared by the Economic Research Service of the U.S. Department of Agriculture as part of the contract for convening the workshop.
2For an overview of the three series, see http://www.ers.usda.gov/data-products/foodavailability-(per-capita)-data-system.aspx [July 2014].
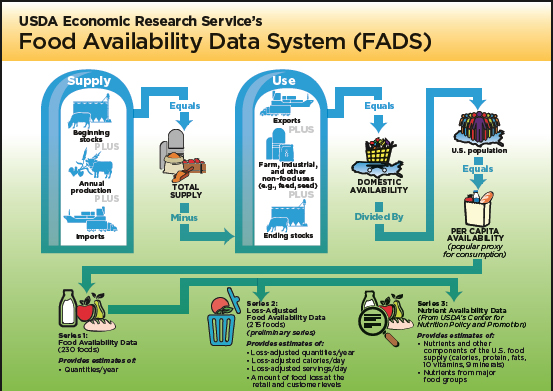
FIGURE 1-1 Food Availability Data System.
SOURCE: Information from USDA’s Economic Research Service. Available: http://www.ers.usda.gov/data-products/food-availability-(per-capita)-data-system.aspx [September 2014].
commodity available for consumption, called domestic availability.3 The FA data are often referred to as food disappearance data because the data represent the amount of the food supply that “disappears” from farms, net imports, and storage facilities into the food marketing system and is available for consumption in the United States during a year. The FA data series provides annual total and per capita food availability estimates, which are useful for studying food consumption trends. As another use of the food availability data, USDA’s Center for Nutrition Policy and Promotion (CNPP) uses the FA data to calculate the nutrient content of the U.S. food supply and provides these data on the CNPP website. These data are also published as part of FADS by ERS.
The Loss-Adjusted Food Availability (LAFA) data series is derived from the FA data series by adjusting for food spoilage, plate waste, and other losses to more closely approximate actual intake.4 LAFA data provide daily estimates of the per capita loss-adjusted availability amounts (e.g., in pounds, ounces, grams, or gallons, as appropriate), calories, and food pattern equivalents (i.e., “servings”) of the five major food groups (dairy, fruit, grains, meat, and vegetables), plus added sugars and sweeteners and added fats and oils available for consumption. Per capita calorie consumption and food pattern equivalents are estimated for more than 200 agricultural commodities from 1970 to the most recent year of data available. Data are reported for individual commodities, aggregated food groups, and totals (e.g., total calories per day).
ERS also uses the loss assumptions embedded in the LAFA data series to estimate the amount and value of food loss at the retail and consumer levels in the United States. (Figure 1-2 provides an illustration of food loss and its economics.) Food loss represents the edible amount of food, postharvest, available for human consumption but not consumed. It includes cooking loss and natural shrinkage (e.g., moisture loss); loss from mold, pests, or inadequate climate control; and food waste. While ERS developed LAFA to monitor food intake and diet quality, the food loss estimates have been used to inform the discussion of food loss, food waste, recovery, and gleaning. Using the LAFA data, ERS researchers calculated that at the retail and consumer levels, an estimated 133 billion pounds, or 31 percent of the 430 billion pounds of food available for human consumption in the United States in 2010, were losses and were not eaten in that year. At 2010 retail prices, this loss translates into $161.6 billion worth of food (Buzby, Wells, and Hyman, 2014). As another example of the use
________________
3For more information, see http://www.ers.usda.gov/data-products/food-availability(per-capita)-data-system/food-availability-documentation.aspx [June 2014].
4For more information, see http://www.ers.usda.gov/data-products/food-availability(per-capita)-data-system/loss-adjusted-food-availability-documentation.aspx [June 2014].
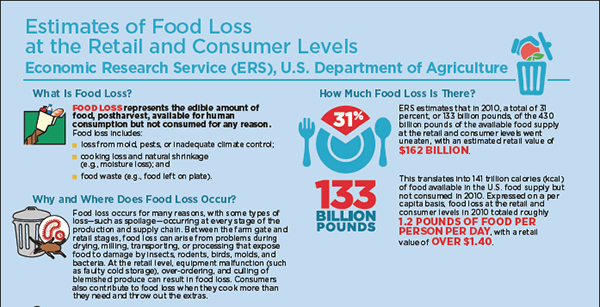
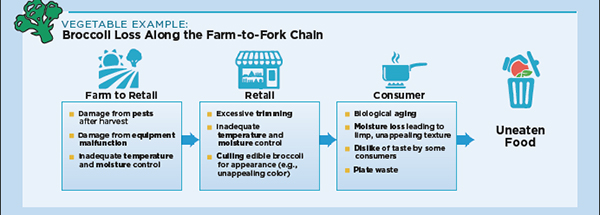
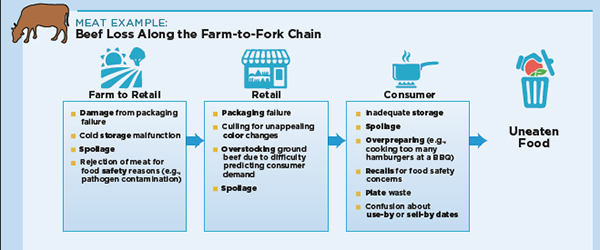
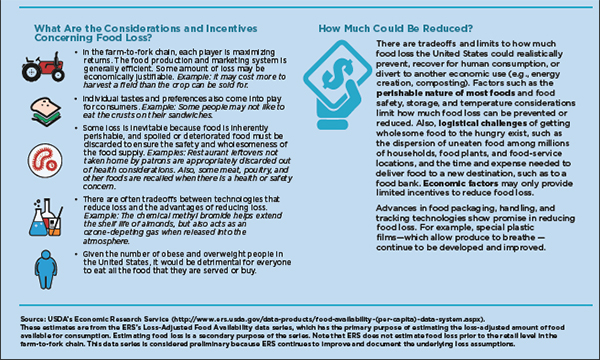
FIGURE 1-2 The economics of food loss.
SOURCE: Information from USDA’s Economic Research Service. Available: http://www.ers.usda.gov/data-products/foodavailability-(per-capita)-data-system/loss-adjusted-food-availability-documentation.aspx [September 2014].
of the LAFA data, the Environmental Protection Agency’s tool to estimate the economic feasibility for food waste anaerobic digesters uses the data as part of its background information (U.S. Environmental Protection Agency, 2010).
In fiscal year 2014, as part of an initiative to systematically review all of its major data series, ERS decided to review FADS. One of the goals of this review is to advance the knowledge and understanding of the measurement and technical aspects of the data supporting FADS so the FA and LAFA data can be maintained and improved.
Though relying on existing data is a strength of FADS, this reliance poses a challenge if these data are discontinued or suspended by other agencies. Such terminations or suspensions threaten the viability of FADS. For example, in 2012, the U.S. Census Bureau terminated its Current Industrial Reports (CIR) Program5 that provided consumption data for some commodities. In 2013, USDA’s National Agricultural Statistics Service (NASS) suspended the collection of key production and storage data for several commodities in FADS.6 NASS has resumed publication of most of its surveys, however, and is considering establishment of new surveys to make up for the loss of the CIR.
ERS considers the LAFA data series to be preliminary because many of the underlying loss assumptions by commodity need to be updated to be more nationally representative and current, and need to be documented. For example, ERS noted that better data are needed in several areas: (1) the amount lost at the farm and the farm-to-retail levels in the United States for each of the commodities in the LAFA data series; (2) updated retail-level loss estimates for select commodities in the LAFA data series (i.e., dairy, added fats and oils, added sugars and sweeteners, grains, nuts, eggs, and fruits and vegetables in forms other than fresh, such as frozen or canned);7 (3) consumer-level loss estimates in away-from-home settings (e.g., in restaurants); and (4) consumer-level loss estimates for select commodities eaten at home not calculated in FADS (as contained in Muth et al., 2011).
ERS also observed that there are structural considerations in FADS data, for example, determining the most appropriate place in the bal-
________________
5For more information, see http://www.census.gov/manufacturing/cir/index.html [June 2014].
6To see the notice of the suspension, see http://www.nass.usda.gov/Newsroom/Notices/03_12_2013.asp [June 2014].
7Supermarket loss estimates for 2005-2006 were obtained from the Perishables Group Inc. and published in Buzby et al. (2009). New retail-level loss estimates for individual fresh fruits, meat, poultry, seafood, and vegetables for 2011-2012 were obtained by ERS in 2014 from the now-called Nielsen Perishables Group Inc. and are currently being analyzed for inclusion in LAFA.
ance and use spreadsheet to remove the inedible share of fresh fruits and vegetables, such as peelings and pits. Further, multi-ingredient products have become more popular in recent years. They are not tracked in FADS, which is based on individual commodities. This may be a source of understatement of imports and exports of commodities that are commonly used in multi-ingredient or processed products (e.g., underreporting grain in grain-based products like cookies and crackers). ERS noted that other data challenges to be addressed involve the use of residuals to estimate food availability for particular commodities, such as rice. The increasing availability of scanner data provides opportunities for better estimation of food availability.
ERS posed one overarching research question about whether it is treating all commodities the same within the FA data series (e.g., consistent inclusion of U.S. territories8) and within the LAFA data series (e.g., how food loss is removed at the different stages of the farm-to-fork chain). Lessons could potentially be learned from other countries and international organizations and entities, but the lack of universal definitions for food loss and food waste complicates the comparison of estimates in the few cases where national estimates are available. As ERS food loss estimates have been used to inform policy discussion on food waste and recovery, it is important to accurately characterize food loss along the supply chain from farm to fork.
Accordingly, to begin to address these issues, ERS requested that the Committee on National Statistics (CNSTAT) of the National Research Council (NRC) and the Food and Nutrition Board (FNB) of the Institute of Medicine (IOM) convene a joint workshop with a goal to advance knowledge and understanding of the measurement and technical aspects of the data supporting the FA and the LAFA data series so that these data series and subsequent food availability and food loss estimates can be maintained and improved. The statement of task for the steering committee that planned the workshop is as follows:
An ad hoc steering committee will organize a public workshop, select and invite speakers and discussants, and moderate discussions on data and estimation issues for the food availability system of estimates developed and regularly published by the Economic Research Service (ERS) of the U.S. Department of Agriculture. The workshop agenda will feature invited presentations and discussions and will cover the core Food Availability (FA) data series, the Loss-Adjusted Food Availability (LAFA) data series, and the food loss estimates that are produced using
________________
8As presented later in the workshop (see Chapter 2), shipments to U.S. territories are treated as exports in the balance sheet for beef (Table 2-2) but not in the balance sheets for oats (Table 2-1) or carrots (Table 2-3).
the LAFA series. Estimates from these series are important for studying food consumption trends, per capita calorie consumption for individual commodities, food groups, and totals (e.g., total calories per day), and food waste. Issues for the workshop to consider include: the effects of termination of selected Census Bureau and USDA data series on estimates for affected food groups and commodities; the potential for using other data sources, such as scanner data, to improve estimates of food availability; and possible ways to improve the data on food loss at the farm and retail levels and at restaurants. For each topic, the workshop will consider what are the most important knowledge gaps, what data sources may be available or could be generated to fill gaps, what can be learned from other countries and international organizations, ways to ensure consistency of treatment of commodities across series, and the most promising opportunities for new data for the various food availability series.
Following the workshop, a designated rapporteur will prepare an individually authored summary of the presentations and discussion. Commissioned papers may be published with the summary or posted on the Internet as background for the workshop. A transcript of the workshop discussions will also be provided to the sponsor.
The steering committee, working by teleconference and e-mail, planned the workshop to fulfill the statement of task. The workshop consisted of four technical sessions, plus introductory and final wrap-up sessions. The technical sessions covered the following topics.
- Current methods, data, and uses of the food availability system and food loss estimates.
- Historical and current uses of the data for economic modeling and reporting of statistical trends.
- Alternative approaches for estimating food availability—international and domestic.
- Alternative approaches for estimating food loss—international and domestic.
The first session was intended to introduce the audience to the details of FADS, both food availability and food loss, and featured two speakers from ERS. Each of the remaining sessions had four presentations to focus on different aspects of the topic, and the last two sessions also featured focused discussions between panelists and the audience. The steering committee identified potential speakers for each topic based on the individual’s unique expertise and selected speakers with a range of disciplines and viewpoints. Based on the charge, the committee asked the following key questions to be addressed during the workshop:
- Where are the most important knowledge gaps?
- Do data exist to support research to fill any remaining substantial knowledge gaps? If not, could such data be generated?
- Are there lessons to be learned from other countries and international organizations?
- Are commodities and commodity groups treated the same within the FA and the LAFA data series?
- What are the most promising opportunities in terms of new data for the FA data series, the LAFA data series, or the associated food loss estimates?
The day-and-a-half workshop was held April 8 and 9, 2014. Chapters 2 through 5 provide a summary of the presentations and discussions from Sessions 1 through 4. Chapter 6 is a summary of the final session. A glossary of acronyms and terms can be found in Appendix A. The workshop agenda can be found in Appendix B, the list of participants can be found in Appendix C, and brief biographies of the speakers and steering committee members can be found in Appendix D.
This workshop summary was prepared by a rapporteur as a factual summary of what occurred at the workshop. The steering committee’s role was limited to planning and convening the workshop. The views contained in the report are those of individual workshop participants and do not necessarily represent the views of nonparticipants, other workshop participants, the steering committee, the NRC, or the IOM.


