
3
Historical and Current Uses of the Data for Economic Modeling and Reporting of Statistical Trends
This chapter summarizes the second session of the workshop, describing historical and current uses of the data from the Food Availability Data System (FADS) for economic modeling and reporting of statistical trends. The moderator of the session was Sarah Nusser (Iowa State University). The presentations of the four speakers in the session are summarized in the following sections of the chapter. Laurian Unnevehr (University of Illinois at Urbana-Champaign) provided an overview on the importance of FADS for research. Helen Jensen (Iowa State University) talked about use of FADS data in economic modeling of food consumption, production, and policy. Susan Krebs-Smith (National Cancer Institute) talked about using food availability (FA) data to examine issues of nutrition and diet quality. Finally, Tabitha Rich (Department of Agriculture and Agri-Food [DAAF], Canada) talked about food availability estimates in Canada. The last section in this chapter summarizes the open discussion at the end of the workshop session.
STATEMENT OF LAURIAN UNNEVEHR IMPORTANCE OF FADS FOR RESEARCH
Unnevehr stated she had two propositions: First, the research stakeholder community for FADS data has greatly expanded over time in interesting ways, and second, while FADS data have been around for a while, they have fresh relevance because they are uniquely suited to answering questions about food system performance via their link between supply
and demand. Some of her comments are informed by looking back at the history of demand analysis, she said, and she pointed to Unnevehr et al. (2010), a review of the field over the past 100 years.
As background, Unnevehr explained that FADS grew out of an agricultural statistical system focused on production estimates. From this early focus, the U.S. Department of Agriculture (USDA) developed an estimate of aggregate demand (disappearance) that reflects basic components of supply: production, trade, processing, and stocks. She added that she uses the word “disappearance,” although she said she understands USDA has moved away from the term. She observed that articles published in 2013 include citations using USDA “disappearance” data. To find references to use of FADS data through a Google search, she said it is important to search on both “disappearance” and “availability.” She noted the term “disappearance” describes what the data really are—disappearance into the retail system—as Krebs-Smith observed during the previous open discussion (see Chapter 2).
According to Unnevehr, FADS data are uniquely suited for understanding demand at the aggregate or population level, and how supply and demand are linked. Among the questions that FADS is uniquely well suited to answer are: (1) what share of the food supply is imported; (2) which kinds of meats, fruits, vegetables, and dairy products are most consumed; (3) what is the trend in total calories per capita; (4) what share of the food supply is lost or wasted; and (5) how does the U.S. food system compare with other countries?
She noted, for example, that the trend in total calories per capita clearly tracks the rise in obesity. For example, Popkin and Nielson (2003) used food availability data from different countries to talk about the rise in sweetener consumption around the world and how the United States does or does not track with international trends.
She highlighted four main areas in which FADS has been used in research, noting that her list is not comprehensive. The first is in measuring aggregate demand response to changes in supply, market shocks, and advertising. The second is in basic forecasting models of demand, supply, and prices, which she called foundational to understanding what is going on in the food system domestically and globally. The third is in looking at how well aggregate demand reflects dietary guidance, while the fourth is looking at the environmental impact of food demand, the newest area of research.
Unnevehr noted that research stakeholders have expanded over time. Research stakeholders began with agricultural economists for whom FADS was, for a long time, the only source of data available to carry out demand analysis. She said this has become a less important use over time, as the research focus shifted with consumer behavior. Analysts
became more concerned with demand for quality attributes and specific products, and with how consumer demand varies between different types of households, such as those that do and do not receive Supplemental Nutrition Assistance Program (SNAP) benefits. These new needs caused agricultural economists to look for other sources of data, such as retail scanner data and data from the National Health and Nutrition Examination Survey (NHANES), to understand more specific kinds of health outcomes.
Since the development of the nutrient and serving data within FADS, she said, public health economists and nutritionists have published results that use these data to look at nutrition questions. The most recent and growing use of FADS data concerns industrial ecology, life-cycle analysis, and environmental systems, she said, referring to Venkat (2012) as one example.
Unnevehr suggested it might be useful to track the use of FADS data in research through Internet search engines, warning, however, that the data are not always referred to as “food availability data” even though FADS data are being used. An analysis of use of the data over time might provide guidance about their value to research stakeholders, and identify who those researchers are and their real data needs.
She showed a figure from Morrison, Smith, and Lin (2009) to illustrate different data sources for unflavored milk consumption (see Figure 3-1). The four sources are Homescan, Nielsen household panel data based
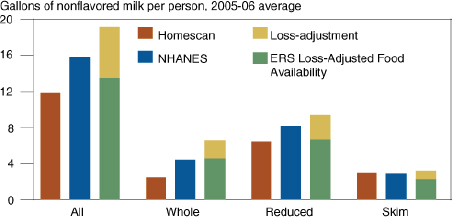
FIGURE 3-1 FADS as one source of food consumption data, with milk as an example.
SOURCE: Morrison, Smith, and Lin (2009).
on scanner data on purchases by households,1 NHANES data, the Loss-Adjusted Food Availability (LAFA) series, and the FA data series (shown as the aggregate of the LAFA series and the loss adjustment). As she explained, the first bar in each series (red) represents purchases. The second (blue) bar represents intake. The third bar, with two colors, represents FA as aggregate of the LAFA (green) and the loss adjustment (gold) data. She noted that the figure illustrates how close all these estimates are even though different things are being measured, but also shows that the FA series consistently gives the largest estimate of consumption.
She reminded the audience about questions FADS cannot answer, such as the demand for specific food products. The level of disaggregation in FADS, while impressive, can never be complete, she noted. While there may be estimates for kale, for example, there may not be estimates for arugula or another green. Similarly, FADS cannot be used to answer questions about how food demand varies with household characteristics such as receipt of SNAP benefits. It cannot answer questions about demand for different food products and/or for quality attributes of food. And finally, it cannot be used to address the demand for food away from home versus food at home.
Unnevehr described several examples of research, beginning with the historical use of the data. By providing a consistent measure of aggregate demand over time, FADS supports models of supply and demand to answer questions such as how commodity prices are expected to change in the future. In general, in these kinds of models, per capita consumption of foods in major commodities is used to estimate the relationship between supply and demand and the changes that result in new prices. As has been noted previously, demand in the United States is inelastic. Population and income growth lead to growth in total demand. For many commodities, supply is predetermined in the period of analysis, and the analysis considers how changes in supply intersect with demand to give new equilibrium prices in the future. This kind of analysis is used for a wide variety of policy questions, as described by Jensen later in the workshop session.
Unnevehr emphasized that supply and demand analysis is a foundational use of FADS data. In the 1980s, there were many estimates of meat demand, all trying to answer the same question with the same limited FADS data. The question of concern was whether the rapid increase in chicken consumption relative to beef was driven by the decline in the relative price of chicken or by an actual shift in preference. All of the analyses used FADS data, with mixed results. These mixed results forced research-
________________
1For a discussion of the accuracy of this dataset, see http://www.ers.usda.gov/publications/err-economic-research-report/err69.aspx#.U63LAxbXFfM [July 2014].
ers to conduct more detailed analysis of specific kinds of consumers and specific kinds of products. The most recent use of FADS data for analysis of meat demand changes was in McGuirk et al. (1995), she noted.
Unnevehr noted that the bibliography contains several references to food system demand estimates (Beatty and LaFrance, 2005; LaFrance, 2008). She said FADS remains one potential source for estimating demand systems, but there are many competing sources. Depending on the research questions, analysts may choose to use retail scanner data or some other source of information for estimating demand, with a decline in the use of FADS in published demand studies.
She provided a few exceptions to that trend, such as the generic advertising in the USDA-supported Got Milk campaign and campaigns for other commodities. Milk producers contribute a share of sales into a fund that pays for generic advertising for their commodity. Because an analyst is trying to measure the impact of advertising on aggregate commodity usage, FADS data are widely used. As another example, Zheng, Kinnucan, and Kaiser (2010) used FADS data on beverages to estimate how private advertising expenditures had a different kind of impact on demand for soda than the generic advertising expenditures for milk. This analysis estimated how advertising expenditures rotate demand curves with special interest in how generic dairy advertising influences milk demand.
She said that Piggott and Marsh (2004) provide another example, using one of the building blocks of FADS: quarterly data on meat disappearance from supply. Their analysis examined consumers’ responses to food safety media coverage of major food safety events related to meat, such as major published recalls. They found short-lived effects of significant media events.
In contrast to Piggott and Marsh (2004), Unnevehr said most studies of food safety incidents have used scanner data, including a study by Arnade, Calvin, and Kuchler (2009) of the spinach E. coli outbreak in 2005 and its impact on lettuce demand. This analysis used scanner data to relate weekly changes in consumption of leafy greens to announcements about the outbreak and its severity. The advantage of scanner data for this type of analysis is that there is more time and product specificity. In summary, she said, FADS data are just one of several different sources that people can use to study market impact questions.
She described growing areas of importance concerning the use of FADS. The first is nutritional epidemiology, including Willett (2012), a work with more than 500,000 citations that she said might be the most cited reference that has used the food availability data. Willett addressed the question of how different patterns of food consumption correlate with the incidence of disease and devoted the first chapter to an example of
basic nutritional epidemiology: an examination of the simple correlation between meat consumption and incidence of colon cancer that indicates that countries that eat more meat have more colon cancer. Then, she said, the author discussed the limitations and value of these kinds of epidemiological studies. Such studies are valuable for setting up hypotheses for more controlled investigation.
Guo et al. (2011) provide another health sector use of FADS data: an examination of the incidence of pathogens and foodborne illness as they relate to food commodity sources. The authors developed a model that used many different data sources, including FoodNet2 data on foodborne illness and FADS data to represent consumption. Their risk assessment model for salmonella found that chicken is likely the primary source of salmonella foodborne illness in the United States because of the high incidence of salmonella on chicken and high consumption of chicken.
Unnevehr also cited Young and Kantor (1999) and Buzby, Wells, and Vocke (2006) as examples of research that considered how U.S. food production might change if diets matched nutritional guidelines. She noted that these were fairly simple assessments that considered how crop acreage would need to shift for production to meet demand that follows dietary guidance, without consideration of how international trade might change or whether new equilibrium prices would alter demand. She noted renewed interest in this question as shown by recent citations of these articles in papers regarding local foods and sustainable food supply. These references provide a provocative thought experiment about what it would take for the U.S. population to eat a healthier diet and what it would mean for the food system, she observed.
Unnevehr said there are more in-depth analyses of different economic policies and how those policies would promote healthier diets. She noted that Jensen will discuss Miao, Beghin, and Jensen (2012), which used FADS data to look at the impact on consumption of taxing sweeteners at different places in the supply chain. In contrast, she said, Okrent and Alston (2012) built a complete system to look at the impact of a calorie tax or of a fruit and vegetable production subsidy without using FADS. Through a complex framework, the authors related supply elasticities based on NASS production data to intake and obesity data from NHANES. Unnevehr observed that these two recent and contrasting studies—one on sweeteners that was built on FADS data (Miao et al., 2012) versus one that considered the whole system and its relationship to an obesity outcome that did not use FADS data (Okrent and Alston, 2012)—illustrate that FADS is one of many data alternatives. It will meet some research-question needs better than others, she said.
________________
2See http://www.cdc.gov/foodnet/ [July 2014].
Unnevehr talked about new work on the impact of the food system on the environment that uses FADS. For example, Venkat (2012) addressed the question about the extent to which food waste contributes to greenhouse gas emissions. He used FADS estimates of losses for 134 commodities and separated out losses at the consumer level versus those in the production supply chain. Venkat called the losses up to the consumer level unavoidable and losses at the consumer level avoidable, estimating that “avoidable” food loss (at the consumer level) accounted for 2 percent of U.S. greenhouse gas emissions.
Weber and Matthews (2008) used FADS in a paper highly cited because of its findings in environmental science and technology, she said. To look at how food transportation contributes to greenhouse gas emissions, the authors combined FADS with the U.S. Department of Commerce Commodity Flow Survey to evaluate the relative impact of changing transportation versus dietary patterns on greenhouse gas emissions. She noted that those familiar with the food system would not be surprised that the authors found transportation is a much smaller contributor to emissions than food production. Therefore, changes in diets that would spur changes in the production mix would reduce emissions more than eating locally produced foods. Part of the reason the article is widely cited, she said, is the current interest in sustainable diets and whether changes in consumption patterns in high-income countries might promote a more sustainable global food system.
Unnevehr closed by returning to her two initial propositions. First, a vastly expanded stakeholder group for the FADS data goes beyond the traditional agricultural economics constituency. Uses of the data now show up in a wide variety of fields in public health, nutrition, and various kinds of environmental analysis. Second, questions about food system performance; how well it meets social, environmental, and nutritional needs; and how well it is performing and delivering an affordable food supply are not going away, but are becoming more detailed and pressing. She said FADS is key to answering those questions, and the loss estimates, in particular, are critical because they lead to a better characterization of demand that gets closer to intake and to understanding environmental impacts.
STATEMENT OF HELEN JENSEN ECONOMIC MODELING OF FOOD CONSUMPTION, PRODUCTION, AND POLICY
Jensen talked about economic modeling relating to food consumption, production, and policy to provide a closer look at examples of the way FADS data are used to address policy questions. She noted that the
workshop session includes a lot of information about what FADS provides and that she will use the term “disappearance.” The FA and LAFA data are estimates for food available for consumption. The system uses an accounting conversion to get from supply availability to retail availability. She stressed the importance of that conversion.
She reiterated that FADS data are in an aggregate form, so they are consistent with what is supplied. Consistency is important, she said, because it supports linkage of what is produced to what is available for consumption. Conversion factors are used to move from raw product to retail form. The methodology embedded in FADS allows for aggregation of commodities. To determine total fruit or greens availability, for instance, one adds up pounds of various kinds of fruits or pounds of greens to get at total pounds of food. For some uses, it is very important to have factors that allow this kind of aggregation.
She noted that the conversions are done in a consistent way, albeit possibly historic and not updated as frequently as is desirable, using food availability of pork to illustrate the updating of the conversion factors between 1981 and 2000 (see Table 3-1). She pointed out that in 1994, the conversion at retail for pork was 0.78 and for boneless it was 0.72. The conversion factor for retail is 0.78 for all years, but the conversion factor for boneless changed over the period from 1981 to 1989, then remained constant. She said that the change in the boneless conversion factor over time reflects an investment by the Economic Research Service (ERS) that resulted in an update to the series that was done in a consistent way.
Jensen then explained Table 3-2, which illustrates the conversion to retail factors for different products. The carcass weight conversion to boneless pork is 0.72, the carcass weight of beef to boneless beef is 0.67, and the carcass weight to boneless for broilers is 0.60. Jensen pointed out that potatoes are available in FADS in three different forms (fresh, frozen, and chips or shoestrings). As eaten fresh, the conversion to retail is 0.96, but to convert pounds of potatoes into pounds of chips the conversion factor is 0.24, reflecting the fact that 0.24 pounds of potatoes is in 1 pound of potato chips.
Jensen stated that to look at disappearance of potatoes and move back to the production system, the conversion factors allow the analyst to move between the food availability series and back to the raw product. She noted that this is important for some uses that have become more important over time, such as studying the land used in production or the energy used in processing products into different forms.
Jensen provided three examples of uses of FADS data. The first, documented in Miao et al. (2012), was a study that looked at policies to reduce consumption of sweeteners through a consumption tax and through a
TABLE 3-1 Segment of the Food Availability Spreadsheet for Pork
| Food Disappearance | |||
| Total (millions of lbs.) | |||
| Year | Carcass | Retail | Boneless |
| 1981 | 16,058.3 | 12,461.2 | 11,481.7 |
| 1982 | 14,528.0 | 11,288.2 | 10,416.6 |
| 1983 | 15,452.8 | 12,022.3 | 11,110.6 |
| 1984 | 15,482.6 | 12,060.9 | 11,163.0 |
| 1985 | 15,733.3 | 12,272.0 | 11,375.2 |
| 1986 | 15,003.0 | 11,687.4 | 10,877.2 |
| 1987 | 15,224.6 | 11,844.7 | 11,068.3 |
| 1988 | 16,422.6 | 12,760.4 | 11,955.7 |
| 1989 | 16,422.1 | 12,743.6 | 11,971.7 |
| 1990 | 15,912.3 | 12,348.0 | 11,600.1 |
| 1991 | 16,261.0 | 12,610.5 | 11,854.3 |
| 1992 | 17,317.0 | 13,438.0 | 12,624.1 |
| 1993 | 17,305.0 | 13,428.7 | 12,615.3 |
| 1994 | 17,698.0 | 13,733.6 | 12,901.8 |
| 1995 | 17,682.8 | 13,721.9 | 12,890.8 |
| 1996 | 16,727.0 | 12,980.2 | 12,194.0 |
| 1997 | 16,747.0 | 12,996.7 | 12,208.6 |
| 1998 | 18,247.0 | 14,159.7 | 13,302.1 |
| 1999 | 18,898.8 | 14,666.2 | 13,778.0 |
| 2000 | 18,503.0 | 14,358.3 | 13,488.7 |
SOURCE: Prepared by H. Jensen for presentation at the workshop. Data from Economic Research Service Food Availability System, see http://www.ers.usda.gov/data-products/food-availability-(per-capita)-data-system.aspx [July 2014].
tax on the input sweeteners. Four different sweeteners were considered: sugar, corn sweetener, other (including honey), and artificial sweeteners.3
As Jensen explained, the study considered nine sweetener-intensive
________________
3Artificial sweeteners include sugar substitutes (mannitol, sorbitol, etc.) and artificial sweeteners (solids).
| Per Capita Availability (lbs.) | Factors (%) for Converting Carcass Weight to | ||||
| Carcass | Retail | Boneless | Retail | Boneless | |
| 69.8 | 54.2 | 49.9 | 0.78 | 0.715 | |
| 62.6 | 48.6 | 44.9 | 0.78 | 0.717 | |
| 66.0 | 51.3 | 47.4 | 0.78 | 0.719 | |
| 65.5 | 51.0 | 47.2 | 0.78 | 0.721 | |
| 66.0 | 51.5 | 47.7 | 0.78 | 0.723 | |
| 62.3 | 48.6 | 45.2 | 0.78 | 0.725 | |
| 62.7 | 48.8 | 45.6 | 0.78 | 0.727 | |
| 67.0 | 52.1 | 48.8 | 0.78 | 0.728 | |
| 66.4 | 51.5 | 48.4 | 0.78 | 0.729 | |
| 63.6 | 49.4 | 46.4 | 0.78 | 0.729 | |
| 64.1 | 49.8 | 46.8 | 0.78 | 0.729 | |
| 67.4 | 52.3 | 49.1 | 0.78 | 0.729 | |
| 66.5 | 51.6 | 48.5 | 0.78 | 0.729 | |
| 67.2 | 52.1 | 49.0 | 0.78 | 0.729 | |
| 66.3 | 51.5 | 48.4 | 0.78 | 0.729 | |
| 62.0 | 48.1 | 45.2 | 0.78 | 0.729 | |
| 61.4 | 48.6 | 44.7 | 0.78 | 0.729 | |
| 66.1 | 51.3 | 48.2 | 0.78 | 0.729 | |
| 67.7 | 52.5 | 49.3 | 0.78 | 0.729 | |
| 65.5 | 50.8 | 47.8 | 0.78 | 0.729 | |
food markets: breakfast cereal/bakery, cheese,4 condiments, ice cream, juice, milk, processed fruits/vegetables, soft drinks, and sweetener products. The study considered the supply of sweetener-intensive foods from processors, used existing demand elasticities compiled by ERS, and con-
________________
4 Cheese spreads are examples of sweetened cheese products.
TABLE 3-2 Conversion Factors Reflecting Changes to the Product Through Processing from Commodity to Retail Product
| Commodity (primary weight) | Conversion Factor | Retail Product |
| Pork (carcass weight) | 0.729 | Pork (boneless) |
| Beef (carcass weight) | 0.669 | Beef (boneless) |
| Broilers (carcass weight) | 0.600 | Broiler (boneless) |
| Potatoes (pounds) | 0.960 | Potatoes (fresh) |
| Potatoes (pounds) | 0.500 | Potatoes (frozen) |
| Potatoes (pounds) | 0.245 | Potatoes (chips and shoestrings) |
SOURCE: Prepared by H. Jensen for presentation at the workshop. Data from Economic Research Service Food Availability System, see http://www.ers.usda.gov/data-products/food-availability-(per-capita)-data-system.aspx [July 2014].
sidered the equilibrium between supply and demand. It looked at the effect on sweetener consumption of taxes applied either to the input or to the final product and evaluated consumer welfare changes.
The FA data measure the use of raw and semi-processed agricultural commodities from which a final food product is made. The study used the cost share of sweeteners (value of shipments) from the Current Industrial Reports (CIR).5 The study created a ratio adjustment that looked at the food disappearance data relative to what was estimated as going into industry. She went on to say that for some products, like cereals, the ratio was close to 1. Amounts included in products of the cereal industry were close to amounts of food disappearance: in other words, there is not much loss from processing to final goods. For other products, this was less true, possibly because of trade (imports or exports) and also perhaps the data series are not completely aligned. These ratios allowed the authors to calibrate the model so that it reflected final use or consumption.
Jensen reported that the authors applied available ERS and other demand elasticities for foods. They estimated the tax rate required on caloric sweetener input to achieve a 10 percent reduction in use of sweeteners and found the rates required would be a 27.5 percent tax on sugars and a 43 percent tax on high-fructose corn sweetener, while for other products, a tax had no impact. If the tax were to be applied on final products, a tax of nearly 40 percent on sweetened products would be needed to achieve a 10 percent reduction in use of sweeteners. The study mea-
________________
5Jensen stated she does not think that sweeteners are among the products NASS is considering adding back to their survey system to replace the CIR data. She said she hoped that the Miao et al. (2012) study might give some support for collecting data on sweeteners. In her view, there may be more uses for these data than for some of the commodities being considered, such as wheat and corn.
sured consumer welfare loss and found it to be five times greater when the tax was applied at the consumer level than it would be if applied at the manufacturing level. She said the analysis did not fully capture that processors can substitute input ingredients more easily than can consumers. The FADS contribution to this study, she noted, was the ability to link manufacturing shipments data to consumption through the FA data series and the adjustment ratio to analyze consumer demand for sweetened products. She reminded the audience of the caveats, saying that the analysis was not perfect, but it may be useful.
Jensen went through a second example, the Food and Agricultural Policy Research Institute6 (FAPRI) model at the University of Missouri and Iowa State University. This large-scale model uses some FADS data and, she suggested, it might benefit from greater use. For example, the outcome could be expressed through FA to show results relative to food use. Methods used in FAPRI are similar to economic modeling done within ERS.
The objectives for FAPRI are to provide baseline projections for the U.S. agricultural sector and international commodity markets, and then to examine the impacts of policy changes on production, consumption, farm and retail prices, farm income, trade, and government costs. The FAPRI model is in equilibrium in the baseline period and makes projections for from 10 to 15 years forward from the year of the baseline to illustrate both the baseline and the policy change. As examples of policy analysis that used FAPRI, she listed
- multilateral trade and agricultural policy reforms in sugar markets;
- analysis of the link between ethanol, energy, and crop markets;
- effect of growth in ethanol’s use on commodity prices and land use;
- long-run impact of corn-based ethanol on the grain, oilseed, and livestock sectors;
- renewable fuel standard waiver for 2014 and beyond;
- factoring greenhouse gas emissions from land use change into biofuel calculations; and
- impacts of selected provisions of the House and Senate Farm Bills (2013) (excluding the nutrition title).
Jensen pointed out that none of these areas of analysis mention diet and what goes on with respect to the consumer level. The FAPRI model is not well designed at this point to conduct that type of analysis, she said.
________________
6See FAPRI (Missouri) http://www.fapri.missouri.edu [July 2014] and CARD (Iowa) http://www.card.iastate.edu/research/tap [July 2014].
Jensen reviewed the U.S. and international commodities covered in the FAPRI model, which include biofuels, dairy, grains, livestock, oilseeds, and sugar. Fruits and vegetables are included in a small satellite model that allows the model to solve and predict either the consumer price index (CPI) or the effect on categories within the CPI. She said these satellite models are fairly rudimentary, and one innovation might be to include adjustments to account for the processing sector. The model is used to estimate the expected price changes at the retail level.
She said country coverage in the international model is quite broad, though certain countries are included for only specific commodities, such as wheat only or corn only. Major countries are represented in the FAPRI models. Some large areas, such as Africa, are represented both by individual country models and by an aggregate to reflect the rest of the region.
Jensen described the structure of the FAPRI model, in which equilibrating supply and demand comes about through price changes. In the baseline period, the system is in equilibrium, and a policy change from that baseline affects the supply side, causing the different commodity markets to adjust. There is continual updating to find world (and some country-specific) market-clearing prices.
She said the models can be made so that changes in the livestock sector affect the food sector and vice versa. Macroeconomic conditions, including macroeconomic projections from large-scale databases, are included to reflect unemployment rates and aggregate income. She noted that if the livestock sector is going to try to expand, it takes a while for the expansion to occur for beef but less time for poultry. These kinds of constraints (including biological constraints) are based on historical data and built into large-scale models. Imports and exports determine the residual to equilibrium that is achieved through international prices.
Jensen pointed out that the focus of the model is on supply and production, not foods as consumed. The supply response depends on changes in net returns and behavioral responses. Calories and per capita food demand do not have an impact, at least for the industrial, higher-income countries, she said, although this is less so for countries with lower incomes, where the macro conditions (income) will have an impact and demand drives changes to the system.
She characterized FAPRI as a partial equilibrium model. It does not account for the impact of changes on population, income, or costs to all sectors of production. Other large-scale modeling systems have different modeling approaches and assumptions. For example, she noted, Global Trade Analysis Project (GTAP) models are general equilibrium models. Each large model has its own structure, whether driven by regional focus, general equilibrium, or partial equilibrium. In most cases, Jensen said, models have some biological constraints built into the supply response.
The FAPRI model is built on net returns and behavioral responses to returns. When prices increase and producers see a higher price, they respond by increasing available supply.
As her third example, Jensen described the International Model for Policy Analysis of Agricultural Commodities and Trade (IMPACT) developed through the International Food Policy Research Institute (IFPRI).7 This large-scale model includes a system of equations to model global food demand, supply, trade, income, and population with 115 geopolitical regions in the world and the main agricultural commodities. Supply, demand, and prices are determined within regions, and the regions are linked through trade that is computed as a residual. The supply and demand functions incorporate elasticities to approximate the underlying production and demand. Demand (the sum of demand components) is determined by prices, income, and population. World agricultural commodity prices are determined annually at levels that clear international markets. IMPACT is used to analyze world and regional food and resource issues.
She noted a unique aspect of IMPACT: its effort to determine availability of calories at the equilibrium of supply and demand. The commodities are converted into consumption and estimates for a region’s percentage of population; different outcomes, such as hunger, malnourished children, female access to education, and availability of health and sanitation, are examined under different policy changes.
Jensen pointed to Jensen (2011) to illustrate how international data from the United Nations’ Food and Agriculture Organization, similar to FADS, can be used (also discussed later in the workshop, see Chapters 4 and 5). The study examined the share of protein that comes from animal products, by country, versus gross national income (GNI) measured in U.S. dollars. The author identified a possible relationship between protein consumption and GNI: a function that increases rapidly at lower levels of income, and increases at a declining rate with larger incomes. She noted that analyses like these rely on the availability of data series that are consistent over time and geography.
Jensen ended her presentation by noting several features of the FADS data that support their utility for policy analysis. First, the data provide a consistent series of food use (disappearance) over time. She emphasized the importance of the conversion factors, because they express the relationship between the agricultural product (commodity) and what is available for consumption (retail). That relationship changes with technology and with consumer taste.
________________
7For more information, see http://www.ifpri.org/publication/international-model-policy-analysis-agricultural-commodities-and-trade-impact-0 [June 2014].
Large-scale models are developed to account for the interaction between supply and demand, and to look at policy changes relative to this baseline. For the United States and other industrialized economies, the issue of food production (supply) dominates policies; the United States makes fewer policy changes at the retail or consumer levels. In international global markets, she said, demand changes due to population and income growth, and trade effects are bigger drivers.
STATEMENT OF SUSAN KREBS-SMITH USES OF FADS DATA TO EXAMINE ISSUES OF NUTRITION AND DIET QUALITY
According to Krebs-Smith, one major use of the food availability data is to evaluate the American diet in its most generic sense. She said she views the FADS data not as a proxy for consumption, but as a measure of food entering retail distribution channels with implications for consumption. Two other key uses she identified are to examine the potential of the food supply to meet the nutritional needs of the U.S. population, and to monitor changes and historical trends. She noted that the FA data series goes back to 1909, and the LAFA data to 1970. ERS has used consistent methodologies, even through its activities to implement updates. This makes the data very good for studying historical trends.
Krebs-Smith noted her interest in using the food availability data to answer questions related to nutrition and diet quality because of the impact on the chance of developing disease. In thinking about the full food supply chain, what people eat is affected by what is available in the household, in food outlets and grocery stores, and so on up the chain. The FA data provide a metric for foods that are entering the food supply chain. Because food supply ends up downstream and influences what people eat, it is important in terms of health and disease, she said.
Although a major topic of this workshop is a consideration of waste and loss factors, she said measures of waste and loss can obscure the relationship between food availability and food use. She noted that if loss and waste are not accounted for or measured with differential bias, then the relative proportions of availability of one type of food to another might be distorted. She said it is important to understand how the different commodities fare in terms of their waste and loss factors.
Krebs-Smith summarized how nutrient availability data are derived as an example of an important use of the FA data for nutrition and diet quality-related analyses. She explained that to calculate the nutrition estimates, the annual per capita availability estimate for a commodity is multiplied by food composition data for about 27 nutrients found in the edible portion of the food. For all foods, the results are totaled and con-
verted to amounts per capita per day. Nutrients that are added to certain commodities for fortification and enrichment are also included in the nutrient content of the food supply. She noted that nutrient information is applied to the FA data, not the LAFA data, so the nutrient data represent an overstatement of the amounts people ingest. She pointed out that nutrient values exclude nutrients from inedible parts of the foods, such as bones, rinds, and seeds, but they include nutrients from edible parts of food that are not always eaten, such as the separable fat on meat.
Krebs-Smith noted that people who are interested in diet and health questions are not just interested in nutrients, but also in specific foods and food patterns. As an example, she cited Hiza and Bente (2011), a USDA report that provides nutrient data8 to 2006. She noted that a report providing data through 2010 is planned for release.
She illustrated the concept of nutrient data through Figure 3-2, which shows trends in calcium availability per capita in the U.S. food supply from 1909 to 2006. Calcium available in the food supply rose until about 1940 and has been relatively flat since that time. She pointed out that Figure 3-3 illustrates another way of looking at the data by looking at the foods that are supplying calcium in the diet. She noted that the data do not necessarily reflect the richest sources of the nutrient. If a food is widely available, even if not a particularly rich source, it may be a major source of the nutrient in the U.S. diet. In the case of calcium, however, cheese, whole milk, and low-fat skim milk are the major sources of calcium in the diet and also happen to be the richest sources of the nutrient.
Krebs-Smith went on to talk about analysis considering dietary guidance in terms of foods. She first noted that Kantor (1998) was a landmark study about how the U.S. food supply compares to dietary recommendations and was one of the first uses of the LAFA data, also developed by Kantor. The servings used in this analysis were based on the 1996 Food Guide Pyramid. They were calculated for individual foods and commodity groups, and then aggregated into pyramid food groups, as well as added sugars and sweeteners and added fats and oils. Krebs-Smith pointed to Figure 3-4, which displays food supply servings measured with and without loss adjustment for various commodities. She noted if loss adjustments had not been included, the assessment of how well the diet compares to recommendations would have shifted for some food groups.
She described changes in food supply servings that would be needed to meet recommendations, developed by Kantor (1998), as shown in Figure 3-5. Although the grain group did not at the time require much change, whole grains were not assessed in this original report. Krebs-
________________
8Nutrient data are computed using FA data as the basis rather than the LAFA data.
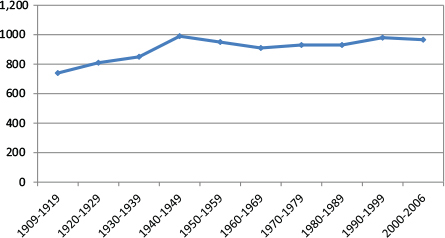
FIGURE 3-2 Trends in calcium per capita, U.S. food supply, 1909-2006 (milligrams).
SOURCE: Hiza and Bente (2011).
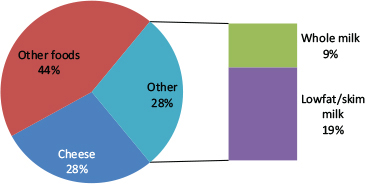
FIGURE 3-3 Food sources of calcium, U.S. food supply, 2006.
SOURCE: Hiza and Bente (2011).
Smith observed that the availability of vegetables, fruits, dairy, and meat all needed to change, some of them quite dramatically, while dramatic declines were needed in added sugars and added fats and oils.
According to Krebs-Smith, McNamara et al. (1999) took this analysis a step further by examining how Americans were eating relative to the Food Guide Pyramid recommendations. They quantified discrepancies at the individual and aggregate food supply levels, with an analysis
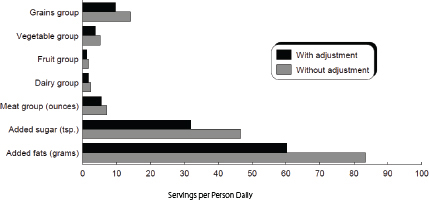
FIGURE 3-4 Food supply servings measured with and without loss adjustment.
NOTE: Losses include retail, household, and institutional losses of edible food portions.
SOURCE: Kantor (1998).
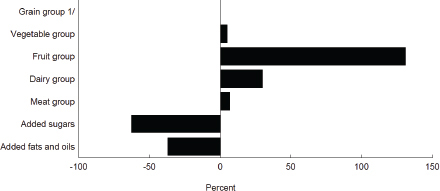
FIGURE 3-5 Change in food supply servings needed to meet recommendations. 1/Grain group servings meet the recommendation for a 2,200-calorie diet.
SOURCE: Kantor (1998).
that involved NHANES data as well as food supply data. By projecting dietary gaps out 20 years based on Census Bureau population projections, the study estimated that at the time, there needed to be more than one-and-a-half times the fruit supply, 50 percent more total low-fat dairy supplies, 15 percent more lean meat supplies, and a dramatic change in the composition of vegetables. Availability of dark green and deep yellow vegetables, and dried beans and peas would need to triple, while supplies of white potatoes and other starchy vegetables would need to be halved. She said the analysis also showed that huge decreases would be needed
in caloric sweeteners and added fats. This analysis highlighted the imbalances in several of the food groups.
Krebs-Smith pointed to Young and Kantor (1999), calling it another classic use of the loss-adjusted data. She said this report was the first analysis of the implications on U.S. agriculture if the population were to meet dietary recommendations, with the analysis updated in Buzby, Wells, and Vocke (2006) for selected food groups. This updated analysis found that consumption or production of fruit would need to increase by 132 percent, and the land area harvested would need to more than double. Because of the constraints of quality land, labor, and climate, this would probably result in more imports.
To evaluate dietary patterns, Krebs-Smith said a question is whether the food supply is consistent with the pattern of recommended diets and referred to her research (Krebs-Smith, Reedy, and Bosire, 2010) and to Reedy, Krebs-Smith, and Bosire (2010). The Healthy Eating Index (HEI), a multicomponent index that captures diet in multiple dimensions, has been used to assess dietary patterns. The LAFA data, nutrient availability data, and salt availability data from the U.S. Salt Institute9 were used in this analysis, she explained.
The HEI gives a score between 0 and 100. A plot of the score from 1970 to 2010 shows that it is approximately flat, with a score of about 50, which she characterized as mediocre at best. She said it is also possible to look at the index for its component parts and to examine total energy that comes from different sources. She said that Miller et al. (2014) illustrate the percentage of total calories over time that comes from sugar, solid fats, and alcohol, which represent what are considered to be empty calories.
Krebs-Smith reminded the audience that the LA and LAFA data represent foods available that enter distribution channels. She suggested thinking of them as headwaters of the food stream, rather than a proxy for consumption. Even though analysts sometimes think of them as separate measures of the same construct, she said they are different and it is better if there are metrics all along the food supply chain.
She observed that the nutrient estimates are only as good as the nutrient composition data that are applied. As discussed earlier (see Chapter 2), she said there is room for improvement in the food waste and loss estimates, pointing to a few such areas. First, she said, food availability data, even nutrient availability, do not capture all the sodium that enters the food stream as the commodity of salt, an issue because sodium is a nutrient of concern. She suggested better data would also be helpful about whole grains, another issue of concern in diet and health. Finally,
________________
9Krebs-Smith observed that since sodium is of concern, the FADS data might benefit from incorporation of salt, even though it is not an agricultural product.
fats and oils are not exactly captured by the food supply data in a way that is compatible with dietary recommendations. She observed that analysts need to impute the amount of fat that is trimmable from meat, and the loss of fats and oils can be substantial. She stated that these estimates need more careful examination.
In closing, Krebs-Smith stated that the FA and LAFA data are an important and useful resource for assessing the country’s ability to provide healthy diets to all, and for evaluating policy changes and interventions aimed at improving diets. To her, the accuracy and precision of the waste and loss factors are important because they affect the conclusions that can be drawn, and she commended ERS for continuing to try to improve the quality of the data. She said nutrient data are also useful, but suggested that they might be more useful if applied to the LAFA data.
STATEMENT OF TABITHA RICH AN OVERVIEW OF CANADIAN FOOD AVAILABILITY ESTIMATES
Rich explained that Statistics Canada is Canada’s centralized statistical agency, and FA and LAFA data are part of the agency’s agricultural statistics program. She noted that data development is different in Canada compared to the United States, because a department like hers, the DAAF, is often called upon to help Statistics Canada by providing subject matter expertise for data development. Her department has been filling this role for the Canadian equivalent of FADS for many years and has been a partner in Canada’s food availability data system since the system began in about 1956. For the first few years, only basic data on food supply per capita were published. Beginning in about 1960, Statistics Canada began publishing complete supply and disposition tables.
By the early 2000s, Canada reached out to ERS to pursue an interest in estimating loss-adjusted food availability. DAAF and Statistics Canada worked with researchers at ERS to evaluate adoption of the U.S measures. She said that analysts compared food consumption patterns in Canada and the United States, determining that the patterns were similar enough that U.S. loss estimates could be used in the Canadian system. Canada has used many U.S. loss estimates ever since.
Like many countries, she continued, Canada produces its FA estimates along the same lines as the Food and Agriculture Organization (FAO) balance sheet, starting with sources of food supply and then subtracting all nonfood uses. The difference, a residual estimate, is called disappearance, net supply, or food available, and it is considered a proxy for consumption.
She noted the Canadian methodology includes a series on waste within the supply and disposition part of the spreadsheet. A nonfood use
category represents storage and transport losses. For example, Canadian data on storage and transportation losses are available for fresh fruits and vegetables, eggs, most grains, and several other commodities. This is different from the LAFA series, she noted, where these losses appear as a conversion factor between the primary and retail levels. Both the U.S. and Canadian systems report per capita food availability at the retail level as the proxy for consumption. For some commodities, where data on storage and transportation losses are not available, Canada uses the USDA factor to adjust between the primary and retail levels.
Rich gave two examples. First, for butter, the primary weight and retail weight are the same, meaning there are no storage and transportation losses. Canada uses the USDA retail loss factor of 7 percent and the consumer loss of 35 percent to get at the equivalent of loss-adjusted food availability for butter. For eggs, Canada has loss data from storage and transportation. The loss due to leaker and reject eggs is about 2.2 percent. In FADS, the loss from primary to retail is 1.5 percent. Canada uses the USDA losses of 9 percent at the retail level and 23 percent at the consumer level10 to get at the loss-adjusted food availability for eggs.
Rich compared the LAFA losses at the retail and consumer level to the equivalent losses from the Canadian system for a variety of groups of commodities. Though there may be some differences due to commodities appearing in different groups, the data are very similar, she said. The largest differences11 in total loss were 5.1 percent for vegetables and 4.7 percent for fruits (with Canadian losses higher) and 5.8 percent for added sugars and syrups (with U.S. losses higher).
According to Rich, the results may indicate differences in consumption, as well as simply measurement differences. For example, as noted above, the data indicate Canadians may have higher consumption of fresh fruits and vegetables, and they also indicate that Canadians wasted about 31 percent of the food supply in 2010, very similar to U.S. results.
Rich said her department is interested in gaining a better understanding of food loss and food waste, and pointed to some of the same limitations as in the U.S. system. The approach likely underestimates food loss and waste, and food availability is generally calculated as a residual, so accuracy is sensitive to inaccuracies in all of the component data series. She noted Canada, too, has lost some input data series, particularly some manufacturing data sources. Canada has also considered using retail
________________
10The factor 23 percent is for other consumer losses in the U.S system. Nonedible consumer losses in the U.S. system are 12 percent and do not appear to be included in the Canadian system.
11Computed as the absolute value of the difference between the Canadian loss in percentage and the U.S. loss in percentage.
scanner data, and has found that these data may be useful for a few processed fruits and vegetables. However, if scanner data are used as the proxy for consumption, the impact is that the supply and disposition balance sheet is no longer complete—so results cannot be aggregated at all levels of the balance sheet and used for other purposes.
She observed that one difference between the Canadian and U.S. systems is where inedible waste is accounted for. The Canadian system accounts for it between the primary and retail levels, while the U.S system considers it a consumer loss. For example, for eggs, the loss from primary to retail (leaker and reject eggs) was likely to be inedible. For fresh vegetables, it is less clear whether the loss between primary and retail was edible or not. She noted that these ambiguities would benefit from additional research, and the rich underlying data used in the tables are worth discussing, debating, and improving.
OPEN DISCUSSION
Krebs-Smith asked Jensen about her point that few policy changes at the consumer level would have the same kind of impact as policy changes at the food production level, asking whether it relates to the point that food supply data show U.S. diets are not aligned with food dietary recommendations. Jensen said she did not mean to imply that policies for consumers concerning dietary guidance would have no effect. What she was indicating was that the kinds of policies under consideration in the Farm Bill are likely to have much greater effect, especially in an industrialized economy, on production and supply—the availability side. In contrast, she said, other factors, whether they be income or changes in education that could be tracked over time, would have more of an effect at the consumer level in lower-income countries.
Josef Schmidhuber asked about Jensen’s result that it would take a 42 percent tax on sugar to reduce sugar consumption by 10 percent. Jensen replied that her result was for aggregate sweetener consumption, including high-fructose corn syrup. Schmidhuber said based on his work on similar issues, sweeteners might be one area where a tax makes sense. If the goal is to collect revenue, a tax makes sense because demand is inelastic. Consumption might not change, but at least revenue would increase. However, sweeteners present two options: sugar and high-fructose corn syrup. When there is a healthier substitute, a small tax may be sufficient to move from an unhealthy to a healthy substitute in production. Jensen explained that her result has to do with the fact that many different kinds of foods contain either high-fructose corn syrup or sugar sweeteners. The result of applying a tax will hit a product differ-
ently depending on the demand elasticities for the products and the share of sweetener in the products.
In answer to a question from Mary Muth, Krebs-Smith said the HEI was computed using both NHANES and FADS data; they were found to be very similar on the overall scale, within a few points of each other. Some of the components were a bit different, she noted, which would provide a reason to look at those components more carefully. She said it is not clear they differ because of loss adjustment factors or underreporting in NHANES. Measurement errors exist in both datasets, and the HEI might be an interesting tool for comparing the two series, she suggested.
Unnevehr asked about the USDA’s Center for Nutrition Policy and Promotion (CNPP) estimates of nutrient availability based on FA and not LAFA data. She asked Krebs-Smith whether anyone has looked at how the nutrient availability would change if the LAFA data were used as the starting point. Krebs-Smith conjectured that the overall quantity of nutrients would go down, with some relative differences with different nutrients. Jean Buzby pointed out that ERS has a chart that compares the calories from the nutrient availability data12 versus the calories from the LAFA data. ERS and CNPP have discussed the possibility of CNPP adopting the LAFA series as the foundation of its nutrient series, like ERS does, she added. Krebs-Smith noted having both would be valuable and that the LAFA data have been applied to the Healthy Eating Index. The nutrient breakdown is designed to be applied to the LAFA data, and in her work, they did a calibration on calories along with a proportional adjustment.
Jensen commented on a graphic from Miller et al. (2014) presented by Krebs-Smith, pointing to the decrease from about 13 percent of energy from solid fats in 2005 to a little over 8 percent in 2009 with a small uptick in 2010. She asked whether the decrease might be attributed to changes in the adjustment factors, such as those that accounted for closer trimming of meat in the 1980s, or whether Americans have improved their diets, and whether the recent uptick is due to the consumption of more trans fats. Krebs-Smith said she did not have a reason for the decline.
Connie Citro (National Academy of Sciences) observed that the FA and LAFA data are prepared in an accounting framework. She asked whether any analysis has incorporated variability, perhaps as part of a sensitivity analysis. She noted in a survey context, estimates of variability are expected, and there are sources of bias and variability in each of the entries in the supply and disposition spreadsheet. Krebs-Smith responded
________________
12Portions of the CNPP’s Nutrient Content of the U.S. Food Supply Data are provided in tables on the ERS website in the Nutrient Availability data. Available: http://www.cnpp.usda.gov/USFoodSupply.htm [July 2014].
that with the HEI, she and her colleagues did some sensitivity analyses for sodium, because it was from an external data source of unknown quality. They used varying estimates of what the waste or loss of sodium might be, because salt is used in processes such as pickling, where much of it could be thrown out with the juice. In testing the sensitivity of the HEI in relation to variability in salt, they found that even if the assumption was that half of the sodium would be lost, sodium scores were low (meaning the sodium content was in excess of recommendations).
Citro also asked about possibilities for improving timeliness, and if there are bottlenecks that might be addressed. Mark Jekanowski noted that the FA data being released at the time of the workshop were for 2012.13 Internally, he said, ERS updates the data as new estimates become available. However, updated FA data are not posted until all of the input data have been finalized; this takes about 18 months from the close of the year of the data. Buzby added that ERS does one annual update of the FA and LAFA data. Nusser asked whether any preliminary data might be useful to release sooner. Buzby said ERS has considered more frequent updates, but decided ERS resources are best spent on the annual update.
Muth asked about Rich’s statement that loss for fruits and vegetables is higher in Canada than the United States. She asked whether that is because of differences in the loss estimates or because the losses are applied to a larger amount of fruits and vegetables available for consumption. Rich replied that per capita availability of fruits and vegetables at the retail level is higher in Canada, and thus losses are higher.
Muth also asked if Canada has any qualitative information and asked whether it might be an artifact of the accounting approach. Rich observed that Canada has not done much to find anecdotal evidence. She said that Gooch, Felfel, and Marenick (2010) looked at food waste in the middle part of the food chain in Canada. In addition, the Canadian Community Health Survey—Nutrition Module collected food consumption data via a food diary, but it did not collect information about food waste and has not been conducted since 2004. Finally, she noted that Gooch et al. (2013) focused on consultation with industry, some retailers, and a few food processors to gauge qualitatively what the waste is at those levels.
Mary Bohman (ERS) asked the speakers to speculate about the most valuable additions that ERS could make to the FADS data. Krebs-Smith suggested a thorough assessment of the waste and loss adjustment factors. She commended ERS on what they have done to improve and update these factors, but said there are more food groups and levels to examine. Jensen agreed it is important to evaluate the factors and to keep them up to date to capture the impact of technological changes, particularly in
________________
13This was also the case for the LAFA data.
processing. She said a processor has a much greater ability to control food waste than a retailer has. Unnevehr echoed Jensen’s point about processed foods, noting more and more of the food supply is in processed products. She pointed to a previous analysis by David Klurfeld of the Agricultural Research Service (ARS)14 that tried to estimate the amount of trans fats in foods (unhealthy and added during a hydrogenation process). Unnevehr added that a review of the extent to which processing wastes and conversions are reflected in the data would be useful.
Rich agreed about the importance of the conversion factors and the other parts of the food chain. She reiterated her point about ambiguity in definitions. For example, Canada has estimates for fruits and vegetables lost in storage and transportation. She said if these losses are food that was edible and intended to be consumed, they represent waste rather than loss. She suggested striving for consistency in the application of the definitions used in the food supply and disposition tables.
Krebs-Smith suggested that adding data on whole grains would be very useful. More information on sodium would be useful as well, although she recognized that this may be more relevant for the nutrient availability data system because sodium is not an agricultural commodity. She also expressed interest in more information on fats and oils.
Nusser stated that, as someone without extensive knowledge of FADS before this workshop, she found the waste and loss factors sound somewhat ad hoc. She asked whether a taxonomy of loss could be used to map out the system. The goal would be to look at the elements of the system and identify existing surveys or other more rigorous ways to estimate the factors. She observed that the waste and loss estimates are a very important part of the system and suggested that a structured, methodological approach to evaluating the loss estimates might be useful.
Schmidhuber stated he compares estimates in his work, including loss factors (extraction rates) across countries. The nutrient conversion factors show little variability across countries, he said, but there is huge variability in the processing industry or technical conversion factors. For example, for grains such as millet or wheat, the factors range from 0.59 to 0.975. He noted variability in the basic data and in the methods underlying the basic data from country to country. For the international data, he said improving the basic data would be most productive, although this may not be the case in the United States. However, he observed, even in the United States, there is some variability from commodity to commodity in how estimates for waste for product used for feed or seed and for other items are compiled and presented.
________________
14For additional information, see the PowerPoint presentation at http://www.heart.org/idc/groups/heart-public/@wcm/@global/documents/downloadable/ucm_301513.pdf [October 2014].


