
5
Alternative Approaches for Estimating Food Loss: International and Domestic
This chapter summarizes the fourth session of the workshop on alternative approaches for estimating food loss, moderated by Josef Schmidhuber (Food and Agriculture Organization [FAO]). Kai Robertson (World Resources Institute [WRI]) described the Food Loss and Waste Protocol currently under development, as highlighted in the first section of the chapter. The second section reports on the questions and answers after her talk. The third section summarizes the presentation by Klaus Grünberger (FAO) about a model for imputing food losses in food balance sheets, followed by a summary of the questions and answers that resulted. The fifth section is a summary of the presentation by Morvarid Bagherzadeh (OECD), who described a project to assess the availability and quality of data on food waste in OECD countries and how policy objectives have shaped data production. Shelly Schneider (Franklin Associates) then described methods for developing estimates of waste—both sample-based and food availability-based—used by the U.S. Environmental Protection Agency (EPA). The last section is a summary of the discussion with panelists and the audience, facilitated by Jean Schwab (EPA), which centered on possible ideas to improve Economic Research Service (ERS) estimates of food waste and loss.
STATEMENT OF KAI ROBERTSON FOOD LOSS AND WASTE PROTOCOL
Robertson said that she was representing WRI, which serves as secretariat for developing the Food Loss and Waste Protocol in collaboration with many other stakeholders. The Food Loss and Waste Protocol is a new effort, just getting under way at the time of the workshop, intended to produce a global standard with guidance for measuring food loss and waste. If successful, it would enable a wide swath of users, including countries, companies, and other organizations, to measure and estimate how much food is lost and wasted in a credible, practical, and consistent manner, and would support identification of where loss and waste occur.
She said the long-term vision of the stakeholders is that the wide use of the protocol and its measurement standards will empower the world to minimize food loss and waste. One benefit, she said, would be enhanced food security, because food that would be wasted or lost could be used to feed people in need. Another benefit would be to encourage economic growth by raising the incomes of farmers who would receive more value from crops currently being “lost” and by saving resources now used to grow, transport, and process food that is not used for its intended purpose. An environmental benefit would accrue by reducing the amount of methane produced from decomposing food, she said.
Robertson noted that WRI publishes World Resources Reports, each focused on a major global issue and the issue’s intersection with the environment and development. The 2013/2014 World Resources Report1 focuses on how the world will feed nine billion people by 2050 in a manner that ensures that agriculture contributes in a positive way and adverse impacts are minimized. She pointed to Lipinski et al. (2013), one of the many working papers developed in support of the report, which was a collaborative effort with the UN Environment Programme (UNEP), FAO, the Waste and Resources Action Programme2 (WRAP), and the Postharvest Education Foundation. The paper’s first recommendation was to develop a global Food Loss and Waste Protocol, with the premise that “what gets measured gets managed.” She stated it is very difficult to adequately manage food loss and food waste if there is no consistent way to measure them, referring to the earlier workshop session (see Chapter 2) about the challenges associated with measuring food availability, loss, and waste. She identified three challenges to the multidimensional topic of food loss and waste: definitions, data, and diverse methods.
Robertson observed that there are different definitions of what con-
________________
1For information about the report, see http://www.wri.org/our-work/project/world-resources-report [July 2014].
2For more information about WRAP, see http://www.WRAP.uk.org [July 2014].
stitutes food loss and waste. ERS, FAO, and others have collected data, but the quantifiable data on loss and waste are sparse, inconsistent, or nonexistent. The diverse methods for gathering the data result in a lack of comparability and consistency, and they risk confusion and potential multiple reinventions of the wheel, she said.
As Robertson explained, the Food Loss and Waste Protocol will address the definition and diverse method components of the challenge. It will not collect data, but is intended to enable data collection. As a precedent, WRI partnered with the World Business Council on Sustainable Development (WBCSD) in launching a Greenhouse Gas Protocol in 1998. At that time, she said, there was a similar concern about lack of a consistent, standard, agreed-upon way to measure and monitor greenhouse gas emissions. WRI and WBCSD convened a multistakeholder process to develop the Greenhouse Gas Protocol,3 which she said is now seen as the standard for measuring greenhouse gas emissions.
Development of the Food Loss and Waste Protocol is drawing from the lessons learned during the development of the Greenhouse Gas Protocol, Robertson noted. It will have standard language to specify requirements and recommendations, and its development will rely on the same guiding principles that underpinned the Greenhouse Gas Protocol. These guiding principles point to the need for a multistakeholder process in order to be inclusive and global, including public- and private-sector organizations from around the world. The guiding principles also point to building on existing initiatives, so data collection efforts on food loss and food waste by USDA, EPA, FAO, and others will be examined. She said WRI wants to build on these measurement methods.
WRI is trying to keep the scope broad, Robertson explained, looking from farm to fork to see where food loss and waste might occur. The protocol will be designed for multiple audiences and uses, and it will be modular. A key component of meeting diverse users’ needs is to be practical and have low barriers for use. Hence, she said, “modular” means that the protocol will define the possible components of food loss and waste, so users may select those components that best satisfy their needs and objectives. Another key guideline is to “avoid letting the perfect become the enemy of the good,” she said. It is not necessary to have complete, precise information about food loss and waste to be able to take action. This is one way in which the Food Loss and Waste Protocol differs slightly from the Greenhouse Gas Protocol, she pointed out, as greenhouse gases can be measured much more precisely than food loss and waste.
Robertson said that in developing the Food Loss and Waste Protocol, WRI is cognizant of being amenable to differences. This is a global effort
________________
3For more information on the protocol, see http://www.ghgprotocol.org/ [July 2014].
and an issue for both developing countries and developed countries, so availability of resources and data measurement capabilities will differ widely. The protocol will address this by providing tiered guidance. For example, there will be guidance for collecting the most reliable and comprehensive data, and it is hoped that entities might aspire to this. But there will also be guidance on lower cost, less resource-intensive options for entities with fewer capabilities.
Robertson said WRI is planning on a 2-year process to develop the Food Loss and Waste Protocol. Over the last several months, the team has been developing a governance strategy and mapping out the overall structure of the protocol. Public- and private-sector entities have been invited to join the effort. For the next few months, technical working groups, in coordination with an external review group, will develop measurement standards and draft content, with the intent to have a draft by the end of 2014 that can be pilot-tested in early 2015. The protocol will be edited based on reviews and published by September 2015. She acknowledged the due date is “somewhat aspirational,” but it is driven by the fact that the UN General Assembly will meet then and it is expected that food loss will be on the agenda. She noted that there will be public updates during the process.
She said that the first protocol will be titled version 1.0. It is expected that as the protocol is used over time, there will be advances in methods and data, and user needs may change. Similar to the Greenhouse Gas Protocol, additional versions are likely. The organizations currently directly involved in developing the protocol include WRI as secretariat, as well as six other leading organizations: (1) Consumer Goods Forum (CGF), a network for CEOs of leading manufacturers and retailers from around the world representing trillions of dollars in sales; (2) FAO, which works on postharvest losses and has launched an initiative called Save Food; (3) Food Use for Social Innovation by Optimizing Waste Prevention Strategies (FUSIONS), a multistakeholder project working toward achieving a more resource-efficient Europe and on providing guidance on defining food loss and waste for the European Union; (4) UNEP, which has launched a food loss campaign called Think, Eat, Save, Reduce Your Foodprint; (5) WBCSD, a CEO-led organization of companies focused on sustainable development; and (6) WRAP, a UK-based organization with a focus on food waste and packaging issues. The group has deep technical expertise, she pointed out, and while the organizations are based in the developed world, a number of them have deep and broad reaches globally.
The organizational structure includes the secretariat, steering committee, technical working groups, and an external review group. The technical working groups will develop content in two phases: review
and analysis, and writing and revising. There are two subgroups because approaches to measuring food loss and waste are different upstream and downstream. The upstream group will focus on losses at harvest up to the point of processing, and the downstream group will focus on the processing point forward to consumption. The external review group will provide independent perspectives on the Food Loss and Waste Protocol, particularly feedback on the draft guidance. It will be more informally involved to review draft products. A group of pilot testers will be drawn from these groups. The pilot testers will be engaged at the end of 2014 when the draft protocol is ready for testing. They will provide feedback, and case studies will be developed.
Robertson invited workshop participants to join any of these groups. She noted the benefits of participating are to shape the guidance of what comes out at the end of the process and to exchange experiences with experts from around the world. WRI will also provide recognition for everyone who contributes to the process.
She described what the report might contain and said project updates will be available on the WRI website.4 The report will focus on the standards and guidance for how to measure, with supplementary material to help users. These might be developed from case studies, references, or tools and other information.
QUESTIONS AND ANSWERS: KAI ROBERTSON
Laurian Unnevehr asked whether the WRI effort is planned to include loss at the consumer level. Robertson replied that the protocol will go through consumption, both at home and away from home. She noted that WRAP has done a lot of work on household food and drink surveys and since the Consumer Goods Forum is composed of retailers, the consumption part is critical in their view.
Susan Krebs-Smith asked Schmidhuber whether FAO is involved with the WRI effort, and if so, whether FAO would apply the protocol to their food balance sheets. Schmidhuber responded that the FAO Agriculture, Industry, and Services Division is involved, but not the Statistics Division. However, he said, FAO is open to a protocol that makes sense and can be populated with data. Such a protocol would be adopted into the FAO system because it is consistent with what FAO has been trying to do to define waste and loss at various stages. The big question for him, he said, is whether FAO could mobilize the resources to populate the system with data.
Robertson added that the protocol is intended to enable data collec-
________________
4For updates, see http://www.wri.org/food/protocol [July 2014].
tion, but a lot of data do not yet exist. Hence, she said, the protocol will provide a framework for consistent discussion about the terms and what is actually included in specific components.
Sarah Nusser asked if the Global Strategy to Improve Rural and Agricultural Statistics is involved with the development of the protocol. Schmidhuber responded that FAO has already started that collaboration with the World Bank and the Global Strategy. He said FAO is collaborating on setting up an experimental design to measure waste at different stages of the value chain for four or five representative systems. The hope, he said, is to be able to draw inferences from one representative country within a food chain to other countries that have similar food chains.
STATEMENT OF KLAUS GRUNBERGER A MODEL FOR IMPUTING FOOD LOSSES IN FOOD BALANCE SHEETS
Grünberger described an analytical effort to use existing data to impute food losses to countries and commodities for which FAO does not have data. The analysis is documented in Grünberger (2013). He reminded the audience that the food balance sheet has about 100 crops or commodities and more than 180 countries or territories, though not all commodities are produced or consumed in every country. He said that there are thousands of loss figures in the spreadsheet for which data are needed but not available. He described an approach for imputing, or estimating, this missing data.
In the present FAO system, like the U.S. system, losses are computed using loss ratios, he explained. For example, as shown in Figure 2-4 (see Chapter 2), in the United States, the loss ratio for carrots to retail is 3 percent. In the FAO system, fixed ratios are used for all countries and years. Losses at a given time are computed as the product of the loss ratio for that country and commodity times net supply (production plus net imports plus stock withdrawals) for that country and commodity for the given time period.5 These loss ratios have not been updated in some time. The purpose of the project he described in his presentation is to provide a way to update the loss ratios.
Grünberger said the data used in the analysis were selected from loss data provided to FAO by national statistical offices and by ministries of agriculture. FAO considers these to be official. These loss data were divided by net supply to yield a loss ratio. There is one loss ratio computed from official data for primary commodities for each country that had such data, and for as many years as possible from 1970 to 2012. The
________________
5The FBS Handbook (Food and Agriculture Organization, 2001) provides further information.
intention was to have a dataset with some observations in most parts of the world, and for different commodities or food groups. Since there were not enough data for sub-Saharan Africa, additional research revealed some data from national food balance sheets that were included in the sample.
Grünberger showed Table 5-1 to illustrate the sample, regions, and commodity groups covered. For some regions, no data of certain food groups are available: for example, in Northern Africa and the Middle East, there is no information on pulses (legumes). He pointed out that within the body of the table, each country and commodity observation is counted once. However, several of the countries repeated their observations over time, as shown in the last row and the last column of Table 5-1. This repeated information was generally very stable over time, he explained. For example, if a country reported loss ratios for 1990 and 2000, it was likely that the same value was reported in both years. He said the data had probably not been updated, so they could not be viewed as panel data. As a result, for analytical purposes, the information was considered to be a cross-sectional dataset with repeated observations.
Grünberger described a regression model that related the log of the loss percentage to several factors (see Box 5-1). The model includes a time trend, dummy variables for regions and subregions, a dummy variable for a commodity, an interaction term between commodity group and the percentage of paved roads in a country,6 and an interaction term between the commodity group and the per capita gross domestic product (GDP) of a country. He said the interaction term between commodity group and percentage of paved roads was included because of the potential differential impact by product. For example, bad roads will result in more damage in transporting tomatoes than cereals. Similarly, GDP may be a proxy for storage quality (for example, the availability of cold storage), which, too, is more important for some food groups than others.
He said one variable not included in the model is climate. Although an initial analysis included average rainfall and temperature by country, their analysis found inclusion of these variables created extreme outliers in predicted values. Another issue was this simple model has no way to capture weather variability: Average rainfall, for example, is likely to be less important than whether it is consistent over the year or seasonal. Another potential factor to include is excess production. One might imagine greater losses may occur in a year with very high production because storage facilities are full, Grünberger observed.
Grünberger stressed that the model is intended only for prediction of loss ratios. He showed Figure 5-1 to illustrate the predicted loss values
________________
6To reflect the transportation infrastructure.
TABLE 5-1 Sample Size by Food Group and Subregion
| Food Group | SSA | Northern Africa and Middle East | Latin America | Western Industrialized Countries |
| Cereals | 24 | 29 | 37 | 140 |
| Roots and tubers | 13 | 5 | 17 | 19 |
| Sugar crops | 2 | 2 | 3 | |
| Pulses | 5 | 17 | 9 | |
| Tree nuts | 4 | 4 | ||
| Oil crops | 7 | 3 | 14 | 14 |
| Vegetables | 5 | 2 | 29 | 49 |
| Fruits | 10 | 9 | 61 | 46 |
| Stimulants and spices | 8 | |||
| Milk | 2 | 2 | 3 | 14 |
| Eggs | 2 | 3 | 3 | 15 |
| Meat | 10 | 5 | 16 | 4 |
| Total | 78 | 60 | 211 | 317 |
| Incl. repeated obs. | 164 | 584 | 3,418 | 4,778 |
NOTE: Sub-Saharan Africa (SSA). Data are treated as cross-sectional with repeated observations. Totals include countries not classified by subregion.
SOURCE: Prepared by K. Grünberger for presentation at the workshop. Based on Food and Agriculture Organization data.
versus the input loss ratios. He observed that the fit is modest, most likely because of noise in the input data. The predicted mean loss ratio, however, may provide a reasonable estimate for the actual loss ratio.
He showed Table 5-2, illustrating the predicted losses for six subregions and 12 item groups. He pointed out that the mean loss ratio is about 8 percent, and the highest ratios are for fruits, vegetables, and tree nuts in Latin America and in sub-Saharan Africa, where loss ratios are quite high. Next, he used Table 5-3 to illustrate the difference between the loss ratios predicted by the model and those used in the balance sheets. Overall, the model results are about 0.5 percent higher than the food balance sheets; for several item groups and subregions, the differences are quite dramatic. Overall in Latin America, the model results are 4.5 percent greater than food balance sheet losses. Breaking this down further, he noted that the current food balance sheet losses might be too low in Latin America for vegetables (by 9.8 percent) and fruits (by 4.5 percent). He went on to say his group knows there is measurement error in the loss ratio data and will carefully review the actual loss rates versus the model-based results
| Eastern Europe and Central Asia | Asia and Pacific | Total | Incl. Repeated Observations |
| 41 | 29 | 313 | 4,233 |
| 10 | 14 | 80 | 1,228 |
| 4 | 11 | 66 | |
| 2 | 2 | 36 | 470 |
| 2 | 2 | 12 | 224 |
| 6 | 8 | 52 | 573 |
| 19 | 3 | 108 | 1,421 |
| 23 | 3 | 154 | 2,031 |
| 2 | 10 | 108 | |
| 6 | 2 | 29 | 340 |
| 7 | 2 | 32 | 427 |
| 7 | 42 | 651 | |
| 127 | 67 | 879 | |
| 1,557 | 920 | 11,772 | |
as part of their evaluation. He also noted that if the mean of the measurement error is different from 0, predictions are biased.
He closed by saying this approach is an efficient way to estimate losses given the poor-quality data that are available. He stated FAO is considering extending the model to incorporate additional data from regional or commodity-based surveys, although combining different types of data would have to be done carefully. They are also considering extending the model to represent losses at various stages of the value chain (commodity tree) described by Schmidhuber in an earlier session (see Chapter 4). He noted, however, a major challenge is that there are not enough data to populate the processing trees.
QUESTIONS AND ANSWERS: KLAUS GRUNBERGER
Jean Buzby asked for and received clarification that the United States is included in the analysis Grünberger presented. She stated that when she last looked at the commodities covered by FAO for the United States compared to those covered by the Food Availability Data System (FADS),
BOX 5-1
Model Specification for Food Loss Ratio (LR)
![]()
where T is a linear time trend
RE is the set of dummy variables for subregions
C is a set of dummies identifying the commodity
CG identifies the food group
PR is the percentage of paved roads in the country
GDP is the country’s per capita GDP
Indexes i, j, t refer to the commodity, country, and year of observation, respectively
The model is estimated by OLS, clustering std. errors at commodity and country level. Logarithmic predictions are corrected for retransformation bias.
SOURCE: Prepared by L. Grünberger for presentation at the workshop.
she observed some differences. She asked whether FAO uses the method Grünberger described to impute commodities that are not in FADS.
Schmidhuber noted the model Grünberger described has not yet been applied. The current methods used by FAO are very similar to those used by ERS. FAO multiplies supply, the sum of production, net imports, and stock withdrawals, by a loss ratio. He said while there is nothing wrong with the methodology, FAO noticed the loss ratios have not changed for 30 years. The need for a process that can be updated with new data drove FAO to consider this new approach, and FAO is still collecting input about the new method. He suggested ERS may want to consider this new approach as well. He noted it is a stopgap measure because of discomfort with the existing approach, but FAO’s ultimate goal is to have a measured approach developed with an experimental design and measurements through representative value chains that can be rolled out to all countries.
Rosanna Morrison (ERS) asked whether the model includes a term to account for civil or military disruptions, saying that if this could be done by country and time period, it might help with the model fit. Grünberger said the model does not capture extreme events, political or climatic. He said variability by country over time is so low that national statistical offices may not respond to such changes. If the data were of higher quality, he said, including extreme events would be a logical next step.
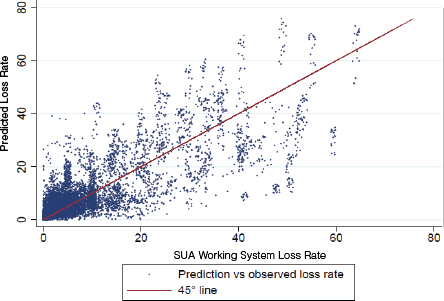
FIGURE 5-1 Validation: Scatterplot of predicted loss rates versus estimation in sample.
NOTE: SUA (supply and utilization accounts) is the statistical framework that provides data for food balance sheets.
SOURCE: Prepared by K. Grünberger for presentation at the workshop. Based on Food and Agriculture Organization data.
Mary Muth asked whether the loss estimated in Grünberger’s analysis is the total cumulative loss from production through consumption. He replied it is cumulative loss up to the retail level. Muth asked whether it would be possible to split the available data on losses into those that are based on expert opinion and those based on measurement approaches and whether that could be controlled for in the model. Grünberger replied the goal was to update the loss ratios developed from expert judgment in the 1970s. He used one source of homogeneous data. He said if data from surveys were available, it would be important to control for the different typology of the data. Schmidhuber added that they do not have the metadata information that would allow them to distinguish expert opinion from official measurements because countries do not provide the information.
Suzanne Thornsbury asked how FAO plans to move forward. She observed that it is hoped that the model, a stopgap approach to updating the loss ratios, and the experimental design approach will provide
TABLE 5-2 Results: Predicted Loss Rates by Food Group and Subregion
| Food Group | SSA | Northern Africa and Middle East | Latin America | Western Industrialized Countries | Eastern Europe and Central Asia | Asia and Pacific | Total |
| Cereals | 7 | 4 | 8 | 3 | 4 | 5 | 5.20 |
| Roots and tubers | 7 | 6 | 11 | 6 | 4 | 6 | 6.80 |
| Sugar crops | 2 | 2 | 4 | 2 | 1 | 2 | 2.30 |
| Pulses | 5 | 3 | 5 | 2 | 2 | 3 | 3.50 |
| Tree nuts | 14 | 8 | 16 | 5 | 7 | 10 | 11.00 |
| Oil crops | 7 | 4 | 7 | 2 | 3 | 5 | 5.00 |
| Vegetables | 19 | 9 | 19 | 6 | 6 | 14 | 13.00 |
| Fruits | 15 | 7 | 15 | 5 | 5 | 11 | 11.00 |
| Stimulants and spices | 1 | 0 | 1 | 0 | 0 | 1 | 0.53 |
| Milk | 3 | 1 | 3 | 1 | 1 | 2 | 1.90 |
| Eggs | 3 | 1 | 4 | 1 | 1 | 2 | 2.10 |
| Meat | 11 | 6 | 15 | 4 | 3 | 8 | 8.60 |
| Total | 12 | 5.8 | 13 | 4.1 | 4.1 | 8.4 | 8.40 |
NOTES: SSA = sub-Saharan Africa. Averages of predicted loss rates for the year 2009. Losses are reported in percentages.
SOURCE: Prepared by K. Grünberger for presentation at the workshop. Based on Food and Agriculture Organization data.
TABLE 5-3 How Results Would Change Losses in Food Balance Sheets
| Food Group | SSA | Northern Africa and Middle East | Latin America | Western Industrialized Countries | Eastern Europe and Central Asia | Asia and Pacific | Total |
| Cereals | –1.5 | –2.2 | 2.0 | –2.0 | –0.4 | –2.2 | –1.1 |
| Roots and tubers | –2.1 | 1.2 | 3.7 | 3.3 | –0.7 | 0.3 | 0.6 |
| Sugar crops | –4.9 | 0.7 | –1.0 | 1.1 | 1.1 | –3.2 | –2.1 |
| Pulses | 0.3 | –1.5 | 1.4 | –1.8 | –2.3 | 0.9 | –0.5 |
| Tree nuts | 5.9 | 2.5 | 1.0 | –2.3 | –0.4 | –0.6 | 0.1 |
| Oil crops | 0.7 | –0.6 | 4.3 | –1.8 | –0.8 | 1.2 | 0.6 |
| Vegetables | 9.5 | 0.2 | 9.8 | –1.5 | –0.3 | 3.1 | 2.5 |
| Fruits | 5.2 | –1.7 | 4.5 | –2.2 | –2.2 | 0.9 | 0.8 |
| Stimulants and spices | –3.1 | –2.7 | –9.5 | –2.0 | –2.9 | ||
| Milk | –2.7 | –3.2 | –1.0 | –0.7 | –0.6 | –3.0 | –2.2 |
| Eggs | –6.8 | –3.3 | –0.3 | –1.7 | –1.1 | –4.3 | –3.5 |
| Meat | 1.1 | –0.6 | 2.1 | –0.4 | –42.4 | –1.4 | |
| Total | 1.5 | –1.0 | 4.5 | –1.6 | –1.0 | 0.1 | 0.5 |
NOTES: SSA = sub-Saharan Africa. Averages of predicted loss rates for the year 2009. Losses are reported in percentages. High differences in losses of meat in Asia and Pacific are due to high losses in the FBS of Myanmar.
SOURCE: Prepared by K. Grünberger for presentation at the workshop. Based on Food and Agriculture Organization data.
updates to single points in time. Since the loss ratios are expected to continue changing, she asked whether FAO has thought about how to carry estimates of change forward into the future. Schmidhuber said keeping factors up to date is a perpetual problem that does not only apply to updating the waste numbers. FAO hopes the experimental design approach will provide an anchor for the food balance sheets with a calibration to a measured result that could be repeated in the future to provide an updated anchor. FAO expects to use such results along with an imputation model that rolls them out over time.
Nusser commented that the temporal modeling, including civil and military unrest and the climate, would help FAO do predictions into the future. She commented that when good independent data are available, there is a lot of promise for this approach to provide a framework to predict losses and how they change in response to local conditions. Schmidhuber explained FAO would not be able to predict into the future. If the model includes a term for something like civil unrest, the regression R2 may be increased, but civil unrest is impossible to predict.
Robertson asked about efforts to harmonize loss ratios across different entities. She said that from her perspective, it seems there would be value in having a standard database on loss ratios, and she considered how the Food Loss and Waste Protocol might give users guidance on these ratios. She asked if the only loss ratios are those developed by FAO and ERS. For FAO, Schmidhuber stated FAO makes everything it has publicly available. He expressed his concern about the old loss ratios providing a standard, and noted FAO is trying to update conversion factors, extraction rates, and loss factors. For ERS, Buzby and Jekanowski stated the conversion factors used in FADS are all available on the ERS website in the food availability (FA) and loss-adjusted food availability (LAFA) spreadsheets. Updates to factors are documented in either the FA documentation7 or the LAFA documentation.8
STATEMENT OF MORVARID BAGHERZADEH OECD METHODS FOR ESTIMATING FOOD WASTE
Bagherzadeh started by describing the OECD’s role and its membership. It provides policy advice and has a strong statistical structure because of the belief that good policy advice needs information about
________________
7For FA documentation, see http://www.ers.usda.gov/data-products/food-availability(per-capita)-data-system/food-availability-documentation.aspx [July 2014].
8For LAFA documentation, see http://www.ers.usda.gov/data-products/foodavailability-(per-capita)-data-system/loss-adjusted-food-availability-documentation.aspx [July 2014].
fundamentals. Through time, OECD has also developed as a forum to share best practices.
She said OECD’s project on food waste was initiated in 2010 when agriculture ministers from member countries and emerging economies met in Paris. Part of their discussions focused on the possibility that reducing food waste could be an answer to food security issues. The ministers asked OECD to look into the topic. In 2011, OECD developed its Green Growth Strategy, aimed at helping countries anchor their economic growth in green growth. The strategy identified reducing food waste as a means to increase available food supply and reduce pressure on resources and climate.
OECD has just completed the first phase of work by taking stock of existing data. They have not collected data but rather identified data that are available, Bagherzadeh explained, as well as tried to identify the policies relevant to influencing food waste. The next phase will be to model the impact of reducing food waste on agricultural markets and trade. The third phase will be to try to draw policy lessons from incentives and disincentives to reduce food waste that apply to the processing and retail industries.
Bagherzadeh went on to say that analysts at OECD have observed that two sets of policy objectives relate to food waste: one related to food security, or optimizing food availability, and the second related to the state of the environment, which includes minimizing waste management needs. Governments have had to face waste and sometimes limited food supply, and they want to produce enough to supply demand. One of the elements of waste is food. Governments also want to optimize the end-of-life treatment of food waste and to consider the allocation of finite resources—the competition between agriculture and other uses of scarce resources such as water. As she commented, “half of a loaf of bread may be water. If the loaf is thrown away, the water resource has been wasted.” Water is also important to industrial processes, energy production, and transportation.
She noted that these policy objectives have led to two measurement strategies. For food security, governments try to measure food available for consumption. As a result, as presented earlier in the workshop (see Chapter 2), waste is measured when the food leaves the food chain. For the environment, with an objective to limit and manage waste, the policy leads to measuring waste when it enters the waste management system. OECD analysts have observed that these policy objectives have led to development of laws and regulations that sometimes require reporting. This reporting requirement, in turn, leads to the production of data, which is how FAO and OECD have populated their databases, and she suggested the same may be true for ERS.
Bagherzadeh said examples of measurements withdrawn from available food include the FADS LAFA data (described in Chapter 2), FAO food waste estimates (not the balance sheets described in Chapter 3, she clarified, but other initiatives at FAO), and numerous household-level surveys. Examples of data collected about waste reduction include inputs to waste treatment facilities in the European Union and other places (although a gap occurs in places with no central waste management or no treatment at all); business registers in Japan, Korea, and European countries (but without data on small businesses); and curbside collection with separation of food waste in Korea,9 which has very good estimates of household food waste but no data from urban areas.
Bagherzadeh pointed to the report Global Food Losses and Food Waste (Gustavsson et al., 2011).10 She characterized it as a very important analysis of food loss and waste and pointed to a conclusion in the report that if global food loss were attached to a single country, that country would be the third largest contributor to greenhouse gases in the world.
She gave four country examples of efforts to improve the measurement of food waste and loss, noting the examples provide steps forward but also have limitations. Her first example was the United States. She referred to Buzby’s description about U.S. initiatives to improve data on food loss at retail and consumer levels (see Chapter 2). Her second example was Finland. A study found households are the main contributors to food waste, although OECD analysts suspect this finding is because Finland has not examined the rest of the food chain. Bagherzadeh’s third example was a preparatory study conducted in the European Union (EU) that indicated that households are the main contributors to waste, but that manufacturing is also important. She said that 3 percent of EU emissions are from food waste. One limitation of this effort is the data from member countries are quite heterogeneous. Her fourth example, also from the EU, was a specific collection of food waste begun by Eurostat two years ago.11 Results are anticipated in 2014, with expectation of a fine breakdown of where in the supply chain food waste could be produced. Bagherzadeh said the limitations are that it is a voluntary process, and not many countries are participating.
Bagherzadeh described the methodology behind OECD’s stocktaking study of food waste data. Data sources included a web and literature
________________
9Korea has implemented a technology for curbside collection with separate measurement of food waste.
10Gustavsson et al. (2013) describe the methodology used for the 2011 study and also estimates greenhouse gasses.
11Eurostat has developed a plug-in or satellite table as part of its annual survey on waste to collect finer levels of detail on food waste activity. It has greater detail about industry types and food types.
review, a one-sheet questionnaire added to a regular annual OECD survey of member countries, and the Eurostat ENV-WASGEN accounts for waste dataset. Approximately 3,000 data points for 31 countries were assembled. Each data point is classified according to country and region, definition used, economic activity, commodities or grouping, measurement unit, and year. Overall the information illustrates data coverage by sector. For example, household waste is quite well covered, data on agricultural waste are weak, and there is some information about manufacturing and food services waste, she explained.
She said results vary by country, and she used examples from three countries to describe the share of food waste by stage in the supply chain: household, food services, large-scale consumers, manufacturing, and agriculture. In Germany, more than half the waste was at the household level; in Denmark and Japan, household waste was less than half. In Japan, the largest share, more than half, was in the manufacturing sector. These results contributed to the conclusion by OECD analysts that households are not necessarily the main contributors to food waste; instead, lack of information and knowledge about the other sources of waste leads to the view that households are the main source.
She observed that the OECD study has found that measurements of food waste available in different countries are different, depending on the country’s objectives. How waste is measured, units of measurement, and reporting differ, as does the time period of reporting. She observed that the WRI effort described by Robertson (summarized earlier in this chapter) reflects an area to explore. Differences are not necessarily bad, she said, but may be an obstacle to making comparisons. It is important to understand what is being measured, why, and how it will be used.
Bagherzadeh gave some examples of important differences in definitions. The OECD study used the term “waste” as shorthand for loss and waste. She pointed out that in Europe, the term “waste” must be used carefully because of a directive that dictates how products are treated once they are so labeled. As a result, industry has started to use the term “by-product” instead. According to the directive, an item labeled waste has to be immediately taken in by the waste management system, and it cannot be used as food. This is one reason why industry has very little food waste; it is reported as a food by-product.
As another definitional issue, she talked about the labels “edible” versus “inedible,” which vary by country or sometimes ethnicity. For example, in China, parts of animals are eaten that are not eaten in Europe. Elsewhere, some people consider vegetable peels to be edible, while others do not. Her conclusion is that the edible versus inedible distinction is cultural and judgmental, and as a result, it is not a good category for use in official breakdowns.
Another definitional issue is “avoidable” versus “unavoidable.” As an example, she said OECD heard presentations from an industry that steams carrots. In the process, carrots were peeled first, and the peel was used as a thickener in soup. She stated that what is avoidable and unavoidable is technology-driven. Her conclusion again is that this concept is not a good category for official breakdowns.
Finally, Bagherzadeh discussed the concept of consumption by humans, saying that if something intended for human consumption is diverted to another use, it is classified as waste in some definitions. However, in some cases, it becomes feed for animals, which could represent a detour before it comes back on someone’s plate. She questioned policies that would categorize such products as waste.
Bagherzadeh said that she applauded the current initiatives by WRI, UNEP, FUSION, and others to look at such issues as definitions and measurement of food waste. She said these efforts will ultimately strengthen food waste data and represent the beginning of a learning curve. She said it is important to share data and best practices, while minimizing resource expenditures to the extent possible. Definitional issues, as noted above, and system boundary issues about what food and the supply chain are necessitate discussion and sharing. She noted the importance of accepting statistical differences. It does not necessarily mean the quality is bad, but rather that the statistic was developed to fill a different objective.
Bagherzadeh referred the audience to three OECD reports:
- Food Waste Along the Food Chain (in press)
- Food Losses and Food Waste in China: A First Estimate (Liu, 2014), and
- Food Chain Analysis Network: Summary Report of the 4th Meeting (OECD, 2014).
The first is the result of the OECD stocktaking exercise she described.12 The second, Food Losses and Food Waste in China, was released in 2014. In China, she said, a big issue is food waste from eating away from home, which occurs more frequently with a booming economy. The impact on waste is compounded by such cultural issues as when people go out, they may demonstrate opulence by ordering too much food. Bagherzadeh noted the trend to eat outside the home more frequently exists in many countries. In these countries, restaurants are a source of increasing food waste. The third publication is a summary report of the Food Chain
________________
12It is expected to be released as part of the OECD Food, Agriculture and Fisheries Papers, possibly during 2014. When released, it will be available at http://www.oecd-ilibrary.org/agriculture-and-food/oecd-food-agriculture-and-fisheries-working-papers_18156797 [August 2014].
Analysis Network meeting held in June 2013, where Buzby presented the FADS approach. Bagherzadeh noted that the Food Chain Analysis Network brings together governments, business, and academia to share information.
STATEMENT OF SHELLY SCHNEIDER EPA METHODS: CURRENT AND FOOD AVAILABILITY-BASED METHODS
Schneider’s presentation described the work done by Franklin Associates for EPA. She started out by introducing a series of reports and data produced by EPA titled Municipal Solid Waste (MSW) in the United States: Facts and Figures.13 The latest report (U.S. Environmental Protection Agency, 2014) has data from 1960 to 2012 and looks at 40 to 50 product categories, including food waste. Other categories include plastic bottles, office paper, and corrugated boxes. The original audience, still important, was state and local solid waste managers. The report describes the contents of solid waste from households and from commercial/institutional facilities.
Schneider explained that Franklin Associates works with EPA on food waste management. In the mid-1980s, EPA economists worked with William and Marjorie Franklin to develop the original methodology, based on landfill sorting. Landfill sorting involves taking waste from a packer truck, sampling it, and weighing it. She said the problem with food waste is that there is compaction and transfer of moisture, particularly to paper goods. It is difficult to get a valid measurement by weight.
In the 1990s when municipalities became more interested in managing organic waste, sampling studies began at the point of generation, closer to the source where the waste is ready for management, Schneider said. The methodology changed to the current sample-based methodology, where the sources are residential and commercial/institutional. The industrial sector (preconsumer) is not included, nor is one product: fats, grease, and oils.14
Currently 20 communities are represented by residential curbside sampling studies, including communities located in Arizona, California, Canada, Illinois, Minnesota, Missouri, North Carolina, Vermont, Washington, and Wisconsin. Missing are data from the southern part of the United States (except North Carolina). It is anticipated as more residential programs to recover food waste come on board, additional sampling studies will represent more areas of the country. The data range for the average
________________
13Available: http://www.epa.gov/osw/nonhaz/municipal/msw99.htm [July 2014].
14EPA is looking into quantifying fats, greases, and oils.
from those 20 communities is 0.16-0.67 pounds per person per day, with an overall average of 0.35 pounds per person per day.
There are 60 sampling studies from the commercial sector compiled from the following sectors: grocery stores (14), restaurants (17), hotels (2), prisons (6), universities and colleges (5), schools (5), and hospitals and nursing homes (11). Demographic or economic factors, such as number of employees, number of prisoners, or number of students, are used to generalize results from these studies to the sector total. Using this methodology, the estimate for total food waste in the commercial sector in 2012 was about 60 million tons, with 54 percent coming from restaurants and 25 percent coming from grocery stores.15 She noted a limitation of the approach is the small number of data points, especially in sectors such as hotels. As new sampling points become available, they are added to the dataset and included in the methodology.
Schneider explained that Franklin Associates started looking into using the ERS LAFA data to estimate food waste for MSW in 2012. They calculated food losses in pounds per capita per year for the following categories and subproducts: dairy (27 products); added fats and oils (13 products); fruit (63 products); grains (9 products); meats, poultry, fish, eggs, and nuts (24 products); added sugar and sweeteners (6 products); and vegetables (67 products). For each product, they started with the LAFA data and looked at the different stages (primary, retail, and consumer) and loss adjustments. They assumed the difference between primary and retail would be industrial, and the difference between retail and consumer would be commercial. After capturing food loss at each level for each product in each category, they considered the management of that waste. They separated waste by product and category into solid and liquid, and estimated what part of the solid was disposed of through the sewer system. With this process the goal was to partition the FADS data into two main categories, nonmunicipal solid waste (assumed to be industrial process loss) and municipal solid waste that is broken into three categories: liquid food lost to sewer, solid food loss to sewer system, and food loss to solid waste system. The last item is needed for the MSW report.
With this breakdown, 31 percent of the total LAFA food loss was process waste, 18 percent liquid lost to the sewer system, 7 percent solid waste lost to the sewer system, and 44 percent was municipal solid waste (14 percent retail and 30 percent consumer16) lost to the solid waste sys-
________________
15Sampling curbside or at the back of the restaurant or grocery store means that measurement is postdonation of unsalable or leftover food that might be used to feed people or animals.
16FAFL consumer food loss includes restaurant, institutional, and residential loss.
tem. Schneider stressed the differences between the sample-based and food availability approaches. For example, the LAFA consumer category includes food away from home, while in the sample-based approach, food losses away from home at restaurants and institutions are included in the commercial sector.
To prepare an estimate of total food loss to the solid waste system based on the LAFA data, three additional items need to be estimated and subtracted out for the number to be as comparable as possible to the estimate based on the sample-based methodology: food donations, food used for animal feed, and food for industrial use. Schneider said Franklin Associates prepared an estimate for food donations based on information from measurements by two of the biggest organizations in the country. As yet, they do not have an estimate of food used for animal feed. She said the estimate for industrial use of food waste currently represents the rendering industry, which uses outdated meat and seafood from grocery stores and yellow grease collected from restaurants. For 2012, food loss inputs to the solid waste system based on the LAFA data were about one-third again higher than the estimate derived by the sample-based method. Schneider stressed that the comparison work is not complete, and EPA continues to evaluate reasons for differences.
FACILITATED DISCUSSION WITH PANELISTS AND AUDIENCE
Schwab gave some background information about why EPA is interested in food issues. She reminded the audience that as Schneider explained, EPA has a food waste data series that runs from 1960 to 2012. Schwab said she has been involved in studying food waste since 1997 and worked with USDA on the 1999 publication Waste Not, Want Not: Feeding the Hungry and Reducing Solid Waste Through Food Recovery (U.S. Environmental Protection Agency, 1999). This publication established the food recovery hierarchy, which was trying to emphasize source reduction to limit food waste: feeding hungry people through donation, feeding animals, rendering, and composting, all trying to limit the amount of food waste going to landfills.
The reason EPA is involved, she said, is because of the pollution associated with landfills. Food waste is large on the food production side and levels off through transportation. However, once food becomes waste and goes to landfills, the impact is huge. Landfills are the third largest generators of greenhouse gases in the United States after mining and agriculture, she noted, and EPA also works with developing countries to help them limit food waste going into landfills. The goal is to help countries attain their greenhouse gas climate change commitments.
Schwab underscored that dealing with food waste is not easy. As
described earlier, there are issues of definitions, data, and methodology. One challenge to the methods described by Schneider, she noted, is that if one is off by a small fraction, the result could be a large error in the national estimate.
She referred to the presentation by Tabitha Rich (see Chapter 3) that Canada may have survey information concerning transportation and storage loss from primary to retail, and asked whether this information could be used to verify the loss factors in the United States or other countries. She went on to say that it used to be common wisdom that in developing countries most of the food was lost in transportation and storage and not as much at the consumer level, but she has observed this is not the case.
Schwab then challenged the audience to identify data gaps and to discuss priority approaches for filling them.
Robertson observed that the workshop has highlighted the fact that many assumptions are embedded in the available datasets but sometimes not considered when comparisons are made. Keeping the assumptions in mind might help illuminate reasons for differences and guide efforts needed to fill data gaps. She asked Schneider to clarify one of the assumptions being made when the LAFA data are used to estimate the amount of municipal solid waste. She asked if all of the loss between retail weight and consumer weight is going to municipal solid waste, or if their assumption is that some is diverted to other uses. Schneider responded that they make a distinction between liquid and solid waste and try to estimate what goes into the sewer system as opposed to being handled as solid waste. In addition, if other uses are known, such as rendering, they try to capture this information as well.
Robertson asked whether Franklin Associates has tried to capture the increasing use of anaerobic digesters or composting facilities. Schneider clarified that the amount going to anaerobic digestion would be in the food waste generation number. In their accounting of food waste, food waste is generated when it is ready to be managed (prior to recovery or disposal). Schwab added that the issue of anaerobic digestion is important both nationally and internationally. She said EPA is trying to focus on sustainable materials management. She explained that anaerobic digestion means taking organic materials, sewage, sludge, manures, or food waste, and putting it in giant enclosed vats. The material goes methanogenic, anaerobic, without air, so it is intentionally creating methane gas as renewable energy. The process removes the energy and leaves the bulk residual material (including the fibrous material from food waste). In many instances, the bulk residual material still ends up in a landfill. In a landfill, the bulk material can still create some methane that causes problems. However, the bulk of food did not go away and was not beneficially used. EPA would like to see the bulk residual material go back into
the soil. She explained that this would close the loop, adding nutrients and carbon back to the soil and achieving carbon sequestration, water retention, and drought resistance. She clarified that anaerobic digestion and composting are different. Compositing returns nutrients to the soil, while anaerobic digestion is preprocessing. She pointed to a number of entities that advocate waste to energy, or sending their food by-products to anaerobic digestion for energy. Most of these entities stop accounting for food at that point. She noted that this is another piece of the food supply chain with issues about accounting and measurement. She went on to say that Germany has used anaerobic digestion for a long time, and in the past most of the residual material went to landfills. She thinks that more of it is being used now. One of the challenges is that it has been found that adding food to manures results in higher gas generation. As a result, there is an increasing demand to use food waste in anaerobic digestion.
Unnevehr noted that many communities in the United States are picking up food waste, or parts of it, separately, and EPA is using community-level samples. The retail scanner data that ERS is evaluating would support an analysis within those communities of the volume of food being sold. That might provide data on what is going into those households. If those information sources could be linked, the data might support an assessment of total food waste. Schneider agreed, saying perhaps an indicator could be developed.
Schwab presented a statement and question from Lisa Johnson sent through the workshop webcast. According to Johnson, fruit and vegetable losses in the United States have been historically estimated between 20 and 50 percent of the crop, due to grade standards, labor issues, weather, policy, and grower decisions, among other reasons. Often these fruits and vegetables are disposed of on the farm, and she asked about looking at this as a way to increase supply for human consumption. Buzby replied that very little data are available for losses on the farm. She referred to Kader (2005) and a small study by Dana Gunders (Natural Resources Defense Council, 2012) on the topic. She said understanding farm-level loss would be very resource-intensive with different states, commodities produced, weather conditions, pest conditions, and other variables, and it would also vary widely by year. Mark Jekanowski added that he thinks that most farmer decisions are made for sound economic reasons, and some loss on the farm is inevitable. Grades and standards exist to serve consumer or market needs. He said there could be a debate about whether or not those grades and standards are appropriate, or whether there are better channels for diverting some of the product that does not meet grades and standards. However, he stated that losses due to weather, labor, pests, and so on are not avoidable losses. He then asked about how to account for lower yields that result from a farmer’s decision to use
organic practices. He repeated that the issue of loss on the farm is complicated and, if not done properly, has the potential to be misinterpreted and misused.
Krebs-Smith suggested that the workshop could consider how to best document food loss and waste. Quoting from Robertson’s talk, she noted “what gets measured gets managed.” Without measures, decisions cannot be made about whether something is reasonable or not. There could be good reasons for all the losses in the system, but the purpose of the workshop, she said, is not to evaluate these reasons but to help determine how to develop a full accounting and how to measure food loss and waste to support policy decisions in the future.
Helen Jensen said she understands Krebs-Smith’s point, but noted the difficulty because of the diversion of food to other uses. For example, if apples do not meet grade standards, some are diverted into other human food uses, such as applesauce; some are diverted to animal feed; and some are plowed and enrich the soil. Robertson described another gap due to gleaning—food left on the farm that is still edible and picked by volunteers for human consumption.
Nusser suggested that in information gathering, it is important to account for the part that is not of primary interest. From a political or public relations perspective, it might be useful to think about the nature of food waste. If an economic decision results in food not going through the regular availability channels, it might be useful to know what happened to it. She suggested what is needed is more than just measuring a number but also getting an understanding of reasons for actions and outcomes of actions. With data and understanding, it would be possible to better evaluate the food situation. She expressed hope that this is what will result from the Food Waste and Loss Protocol described by Robertson. She reiterated that it is difficult to identify gaps without a systematic understanding of what loss is in a common language.
Schwab agreed, saying she does not want to lose focus on the waste part of the downstream side, where outcomes may be more controllable. She noted that some losses are easier to measure than others, and some types of retailers or other entities are more interested than others in participating in efforts to measure food loss. Grocery stores, for example, are willing to share their information and work with EPA on reducing waste, but manufacturers are more reluctant to share data. According to her, they do not want to be viewed as wasteful and they want to avoid government regulations.
She reminded the audience that Bagherzadeh described the situation in Europe where manufacturers do not use the term “waste,” instead calling it by-product. She asked whether OECD has any data on such by-products and what is done with them. Bagherzadeh replied that when
food is called a by-product, it is made into another product. She reported WRAP in the United Kingdom has done intensive work with industry. They use a confidentiality clause that allows them access to data on food waste in the processing industry. They are then able to publish summary statistics about waste in industry, but individual results are protected.
Schwab said perhaps the use of confidentiality agreements or other ways to create aggregate information while protecting individual data is one way to move forward. Nusser stated that the use of confidentiality agreements and protection of data from individual entities is very common in the survey world and has been well documented.
Robertson described the Food Waste Reduction Alliance17 (FWRA) in the United States, a collaborative effort among three trade associations: Food Marketing Institute, a supermarket trade association; Grocery Manufacturers Association; and National Restaurant Association. FWRA conducted a survey directly with retailers and manufacturers, and results were posted last year on the FWRA website.18 Next year FWRA will survey restaurants. Food waste is broken into animal feed and different diversion methods, as well as disposal.
Jensen asked about any work on substitution—for example, the apples that go to feed pigs may displace the pig’s regular food (e.g., corn or grain). In an accounting sense, the apples are displacing the pig’s regular food.
Schwab described a food recovery challenge at EPA, when businesses and industry were asked to provide information on what had been source-reduced, what had been donated, and what had been sent for animal feed. She said they can do some accounting, but results are not generalizable to the nation. She said the amount of food used for animal feed has been dropping over the years because of food safety concerns. Recently it has increased somewhat because grain and corn prices have increased.
Schwab explained that in Europe, more entities send food to hog farmers than in the United States. In the European system, a retail outlet can send leftover sandwiches, for example, to a local hog farmer. Europe tends to have many small hog farms, she noted, whereas the United States has fewer but larger hog farms. As a result in the United States, food waste is often generated far away from farms, perhaps in urban areas, and it does not make economic sense to transport food waste long distances. Food waste is 80 to 90 percent water, and cost efficiencies limit how far it can be shipped for compost or animal feed to 25 to 30 miles. As a result, she said, use of food waste for animal feed is not as prevalent in the United States as it is in Europe.
________________
17See http://www.foodwastealliance.org/ [July 2014].
18See http://www.foodwastealliance.org/about-our-work/assessment/ [July 2014].
Jensen noted that food waste from household kitchens is one source, but the waste or by-product from produce is quite a large component of feed in some regions and for some industries. Jekanowski stated that citrus pulp from processing oranges into juice is commonly used as livestock feed. Presumably the same could be true for other processed fruits and vegetables, but he said he does not know of any studies that have looked into this. Thornsbury added that, many times, the waste or by-product will get pelletized and incorporated into animal feed, and many processes try to make use of by-products to recover value. Jensen added that most likely the largest of the components is dry distiller’s grain, which is the by-product of corn from the ethanol industry.
Robertson said that as part of the Food Loss and Waste Protocol, the collaborators want to define “food,” which she said will lead to some points Bagherzadeh raised about edible versus inedible food and avoidable waste versus unavoidable waste. She said the European Parliament has a definition of food, which comes in a regulation on food safety.19 As she quoted, the definition states “food means any substance or product whether processed, partially processed, or unprocessed, intended to be or reasonably expected to be ingested by humans.” The next sentence states “food includes drink, chewing gum, and any substance including water intentionally incorporated into the food during its manufacture, preparation, or treatment.” She noted that this definition is based on what is ingested, or planned to be ingested, which excludes such items as eggshells, meat bones, and pineapple skins.
________________
19Definition from Article 2 of Regulation (EC) No 178/2002 of the European Parliament and of the Council of 28 January 2002. See http://eur-lex.europa.eu/LexUriServ/LexUriServ.do?uri=CELEX:32002R0178:EN:HTML [July 2014].


