
3
Principles for Working with Big Data
Important Points Made by Individual Speakers
- MapReduce is an important programming method designed for easy parallel programming on commodity hardware. (Jeffrey Ullman)
- There is an expertise gap between domain scientists and data scientists: domain scientists do not know what is possible technically, and data scientists do not understand the domain. (Juliana Freire)
- A data scientist should have expertise in databases, machine learning and statistics, and visualization; it is challenging, and perhaps unrealistic, to find people who have expertise in all three. (Juliana Freire and other discussion participants)
- Data preparation is an important, time-consuming, and often overlooked step in data analysis, and too few people are trained in it. (Juliana Freire)
Through better understanding of the tools and techniques used to address big data, one can better understand the relevant education and training needs. The third session of the workshop focused more specifically on how to work with big data. Presentations were made by Jeffrey Ullman (Stanford University), Alexander Gray (Skytree Corporation), Duncan Temple Lang (University of California, Davis), and Juliana Freire (New York University). The session was chaired by Brian Caffo (Johns Hopkins University).
Jeffrey Ullman, Stanford University
MapReduce (Dean and Ghemawat, 2004), explained Jeffrey Ullman, is a programming method designed for easy parallel programming on commodity hardware, and it eliminates the need for the user to implement the parallelism and to address recovery from failures. MapReduce uses a distributed file system that replicates chunks to protect against data loss, and it is architected so that hardware failures do not require that the job be restarted. Hadoop1 is an open-source implementation of MapReduce, which is proprietary to Google.
MapReduce, Ullman said, consists of a map function and a reduce function. The map function converts a single element (such as a document, integer, or information record) into key-value pairs. The map tasks are executed in parallel; the code is sent to the data, and the task executes wherever chunks of input are. After the map function has been applied to all inputs, the key-value pairs are sorted by key. The reduce function takes a single key with its list of associated values and provides an output. Reduce tasks are also executed in parallel, and each key with its list of inputs is handled independently.
Ullman then described a data mining course being taught at Stanford University in which students are given access to Amazon Web Services, and many do choose to implement their algorithms by using Hadoop. The course uses real-world data from a variety of sources, including Twitter, Wikipedia, and other companies. Teams of three students propose projects, including the data set to use, the expected results, and how to evaluate their results. About a dozen teams are selected to participate in the course.
Ullman described a 2012 team project on drug interactions. The team used data from Stanford’s medical school from which it extracted records for 3,000 drugs. It sought to identify drug interactions and examine each pair of drugs with a chi-squared test, a statistical test to evaluate the likelihood that differences in data arise by chance. The team was able to identify 40 of the 80 known drug combinations that lead to an increased risk of heart attack. More important, it identified two previously unknown pairs on which there was very strong evidence of interaction. Ullman explained that the team recognized that to make the problem more tractable, it needed to address it with fewer keys and longer lists of values, and it combined the drugs into groups, thereby reducing the number of comparisons and correspondingly reducing the amount of network-use time needed. Ullman stated that this example illustrated how communication time can often be the bottleneck in MapReduce algorithms.
______________
1 See Apache Software Foundation, “Apache Hadoop,” http://hadoop.apache.org/ (accessed May 14, 2014), for more information.
Ullman then spoke more broadly about the theory of MapReduce models. Such models require three elements:
- Reducer2 size: the maximum number of inputs that a given reducer can have, which leads to an upper bound on the length of the value list.
- Replication rate: the average number of key-value pairs generated by a mapper on one input. This measures communication cost per input; it is common for the replication rate to measure the length of time needed to run the algorithm.
- Mapping schema: a description of how outputs for a problem are related to inputs or an assignment of inputs to sets of reducers. No reducer is assigned more inputs than the reducer size; and for every output, there is some reducer that receives all the inputs associated with it.
Ullman showed that replication rate is inversely proportional to reducer size; this forces a trade-off between the two variables and provides a bound on replication rate as a function of reducer size. Ullman pointed out that the inverse relationship makes sense: when more work is done by a single reducer, less parallelism is needed, and the communication cost becomes smaller.
BIG DATA MACHINE LEARNING—PRINCIPLES FOR INDUSTRY
Alexander Gray, Skytree Corporation
Alexander Gray began by briefly describing the first three phases of machine learning: artificial intelligence and pattern recognition (1950s-1970s), neural networks and data mining (1980s and 1990), and convergence of machine learning with statistics (middle 1990s to today). Gray considers that we are now seeing the beginning of a fourth phase, defined by big data with new scalable systems needed to support it.
Gray explained that almost every industry has big data and would be better served by understanding it. He noted a variety of situations in which machine learning is “mission-critical”; in general, this occurs when some extreme is needed, such as high volume, high speed, or extreme accuracy. Gray described a number of kinds of applications of big data, including science (the Search for Extra-Terrestrial Intelligence, the Sloan Digital Sky Survey, and the Large Hadron Collider), medicine (health-care cost reduction, predictive health,3 and early detection), finance
______________
2 A reducer is a function that typically maps a larger set of values to a smaller set of values.
3 The goal of “predictive health” is to predict the probability of future diseases to identify useful proactive lifestyle modifications and surveillance.
(improving derivative pricing, risk analysis, portfolio optimization, and algorithmic trading), and security (cybersecurity, crime prevention, and antiterrorism). In addition, Gray noted kinds of applications that he described as having lower stakes: recommendations, face tagging, dating matches, and online advertising. He posited that many companies would benefit from machine learning to compete and ultimately to survive.
Gray then asked how to maximize predictive accuracy and explained that overall prediction error decomposes into errors that result from the use of finite samples, the choice of model parameters (i.e., algorithmic accuracy), and the choice of models. He noted that one can increase computational speed by orders of magnitude by using smarter algorithms. In addition, speed is connected to accuracy in that speed allows the analyst more time to explore the parameter space. Gray then described weak and strong scaling, a high-performance computing concept that manages data either by using more machines (strong scaling) or by taking more time (weak scaling). With data sets that contain millions of items, parallelism can provide good scaling—for example, changing from one computer to five computers might lead to a 5-fold speed increase in calculation. Gray indicated that data sets that contain billions of items are not uncommon and said that his firm has worked with one client that had data sets that contained trillions of items. Gray noted that strong and weak scaling result in different errors.
In addressing algorithmic accuracy, Gray pointed out that stochastic methods are optimal but generally do not reach optimal results in a single iteration. That type of computation is useful for “quick and dirty” applications. In addressing model error, Gray emphasized the importance of understanding and using a variety of models, as the best model changes on the basis of the data set. He also indicated that the treatment of outliers can change the outcome of an analysis. And he pointed out the utility of visualizing data in a data-specific and domain-specific approach and indicated a need for improved exploratory data analysis and visualization tools. A workshop participant supported the use of visualization and emphasized the need to include the human in the loop; the user should be responsible for and involved in the visualization, not passive, and the visualization should enhance understanding of the data.
PRINCIPLES FOR THE DATA SCIENCE PROCESS
Duncan Temple Lang, University of California, Davis
Duncan Temple Lang began by listing the core concepts of data science—items that will need to be taught: statistics and machine learning, computing and technologies, and domain knowledge of each problem. He stressed the
importance of interpretation and reasoning—not only methods—in addressing data. Students who work in data science will have to have a broad set of skills—including knowledge of randomness and uncertainty, statistical methods, programming, and technology—and practical experience in them. Students tend to have had few computing and statistics classes on entering graduate school in a domain science.
Temple Lang then described the data analysis pipeline, outlining the steps in one example of a data analysis and exploration process:
- Ask a general question.
- Refine the question, identify data, and understand data and metadata. Temple Lang noted that the data used are usually not collected for the specific question at hand, so the original experiment and data set should be understood.
- Access data. This is unrelated to the science but does require computational skill.
- Transform to data structures.
- Perform exploratory data analyses to understand the data and determine whether the results will scale. This is a critical step; Temple Lang noted that 80 percent of a data scientist’s time can be spent in cleaning and preparing the data.
- Perform dimension reduction. Temple Lang stressed that it can be difficult or impossible to automate this step.
- Perform modeling and estimation. Temple Lang noted that computer and machine learning scientists tend to focus more on predictive models than on modeling of physical behavior or characteristics.
- Perform diagnostics. This helps to understand how well the model fits the data and identifies anomalies and aspects for further study. This step has similarities to exploratory data analysis.
- Quantify uncertainty. Temple Lang indicated that quantifying uncertainty with statistical techniques is important for understanding and interpreting models and results.
- Convey results.
Temple Lang stressed that the data analysis process is highly interactive and iterative and requires the presence of a human in the loop. The next step in data processing is often not clear until the results of the current step are clear, and often something unexpected is uncovered. He also emphasized the importance of abstract skills and concepts and said that people need to be exposed to authentic data analyses, not only to the methods used. Data scientists also need to have a statistical understand-
ing, and Temple Lang described the statistical concepts that should be taught to a student:
- Mapping the general question to a statistical framework.
- Understanding the scope of inference, sampling, biases, and limitations.
- Exploratory data analyses, including missing values, data quality, cleaning, matching, and fusing.
- Understanding randomness, variability, and uncertainty. Temple Lang noted that many students do not understand sampling variability.
- Conditional dependence and heterogeneity.
- Dimension reduction, variable selection, and sparsity.
- Spurious relationships and multiple testing.
- Parameter estimation versus “black box” prediction and classification.
- Diagnostics—residuals and comparing models.
- Quantifying the uncertainty of a model.
- Sampling structure and dependence for data reduction. Temple Lang noted that modeling of data becomes complicated when variables are not independent, identically distributed.
- Statistical accuracy versus computational complexity and efficiency.
Temple Lang then briefly discussed some of the practical aspects of computing, including the following:
- Accessing data.
- Manipulating raw data.
- Data structures and storage, including correlated data.
- Visualization at all stages (particularly in exploratory data analyses and conveying the results).
- Parallel computing, which can be challenging for a new student.
- Translating high-level descriptions to optimal programs.
During the discussion, Temple Lang proposed computing statistics on visualizations to examine data rigorously in a statistical and automated way. He explained that “scagnostics” (from scatter plot diagnostics) is a data analysis technique for graphically exploring the relationships among variables. A small set of statistical measures can characterize scatter plots, and exploratory data analysis can be conducted on the residuals.4
A workshop participant noted the difference between a data error and a data blunder. A blunder is a large, easily noticeable mistake. The participant gave the
______________
4 More information about scagnostics can be found in Wilkinson et al. (2005, 2006).
example of shipboard observations of cloud cover; blunders, in that case, occur when the location of the ship observation is given to be on land rather than at sea. Another blunder would be a case of a ship’s changing location too quickly. The participant speculated that such blunders could be generalized to detect problematic observations, although the tools would need to be scalable to be applied to large data sets.
PRINCIPLES FOR WORKING WITH BIG DATA
Juliana Freire, New York University
Juliana Freire began her presentation by discussing the tasks involved in addressing big data. She referred to a Computing Research Association (CRA) report5 on the challenges posed by big data. CRA also documented the data analysis pipeline, which includes acquisition and recording; extraction, cleaning, and annotation; analysis and modeling; and interpretation. A simplified schematic of the pipeline is shown in Figure 3.1.
Freire posited that scaling for batch computation is not difficult—people have been working on this problem for several decades, and there is an infrastructure to support it. However, the human scalability is difficult; as the data size increases, it becomes more difficult for an analyst to explore the data space. The path from data to knowledge, she noted, is human-based and has many complicated elements.
Freire explained that the CRA data analysis pipeline tasks can be classified into two categories: data preparation (which includes acquisition and recording; extraction, cleaning, and annotation; and integration, aggregation, and representation) and data analysis (which includes modeling and interpretation). Data science includes statistics, machine learning, data mining, and visualization, but Freire noted that in many institutions it is synonymous with machine learning, and less emphasis is placed on the other elements. She pointed out that data visualization has been growing in importance and that there is a corresponding need for additional training in it. Freire emphasized that the data pipeline is complex and that what is shown in Figure 3.1 is an oversimplification; for instance, the pipeline is not linear. She also stressed the importance of research provenance: provenance of the exploration process should be captured for transparency, reproducibility, and knowledge reuse. She noted that provenance management is not often taught.
Freire acknowledged that people underestimate the effort required in preparing data. Few people have the expertise to prepare data, but there is a high demand for
______________
5 “Challenges and Opportunities with Big Data—A Community White Paper Developed by Leading Researchers Across the United States,” http://www.cra.org/ccc/files/docs/init/bigdatawhitepaper.pdf, accessed May 19, 2014.
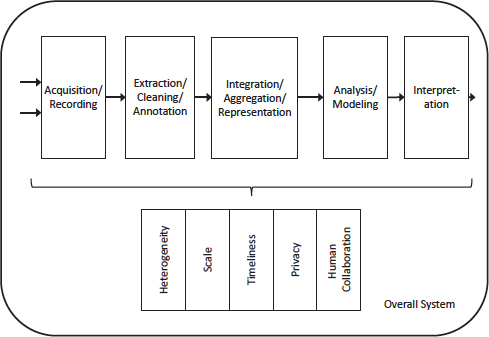
FIGURE 3.1 Simplified schematic of the big data analysis pipeline. Major steps in the analysis of big data are shown in the flow at top. Below it are big data needs that make these steps challenging. SOURCE: Computing Community Consortium, February 2012.
data preparation. In contrast, there are many experts to conduct the analysis, but relatively little time is needed for this step. She stated that data preparation takes a long time, is idiosyncratic, and can limit analyses. She also noted that new data sets continually provide new challenges in big data, and many needs are not met by existing infrastructure.
Freire then provided an example of recent work in applying data science principles to New York City taxis. The raw data set consisted of 500,000 trips per day taken for more than 3 years, which yielded 150 GB of data. The data were not enormous, but they were complex and had spatial and temporal attributes. The data show an unusual degree of regularity; one can easily see temporal changes related to weekends and holidays. The goal was to allow city officials to explore the data visually. The work involved developing a spatiotemporal index that was based on an out-of-core k-dimensional tree (Ferreira et al., 2013) and a new interactive map view.
Freire stated that domain scientists do not know what is possible to do with
their data, and technologists do not know the domain, so there is an expertise gap. Freire quoted Alex Szalay (Faris et al., 2011), who described the ideal scientist as “π-shaped,” with deep knowledge in two fields and connections between them. Freire argued that although the data scientist is supposed to fill the expertise gap, in reality three people make up a “data scientist”: a database expert, a machine learning and statistics expert, and a visualization expert. She said that computer science and data management research have partly failed in that it has not been able to create usable tools for end users. Freire stated that the complexity of data science problems is often underestimated.
Freire was asked by a workshop participant how to prepare students in software while teaching them their domain science. She suggested adding a new course for students who do not have a computer science background. She noted that there were several boot-camp-style programs for Ph.D. science students but that their overall effectiveness is not known.
Participants also discussed the requirements for a data analyst, a topic discussed by Temple Lang during his presentation. One person posited that the single expert in databases, machine learning and statistics, and visualization that Freire described should also be knowledgeable in systems and tools. The database expertise should include computational environments, not just databases. Another participant described the data analyst as a “jazz player” rather than a “symphony player”—in other words, a data analyst should improvise and make decisions rapidly, which cannot be done if the analyst does not know the subject matter well.
Some participants discussed tools. One person noted that commercial tools (such as Spotfire6 and Tableau7) exist in a polished form and work in a variety of applications. Others responded, however, that students need training on these tools, and that a single tool does not usually solve complex data problems. A participant noted that students cannot afford a subscription to Tableau and argued that the existing tools should be open-source; however, open-source tools may not always be well curated.
______________
6 See TIBCO Software, Inc., “Spotfire,” http://spotfire.tibco.com/, accessed June 9, 2014, for more information.
7 See the Tableau Software website at http://www.tableausoftware.com/ (accessed June 9, 2014) for more information.


