
This chapter responds to a specific item in the charge to the panel, to consider reliability growth models in U.S. Department of Defense (DoD) acquisitions. Reliability growth models are models that are used to estimate or predict the improvement of system reliability as a function of the amount of system testing that is carried out. Such models are used in three ways: (1) to help construct test plans for defense systems early in development, (2) to assess the currently achieved system reliability, and (3) to assess whether a defense system in development is on track to meeting its reliability requirements prior to deployment. This chapter examines the form that these models have taken and some of their strengths and weaknesses for the three kinds of applications. We begin with an overview of the concept. We then look at the hardware growth models commonly used, their applications, and the implications for DoD use. Reliability growth models for software are covered in Chapter 9.
The traditional DoD process for achieving reliability growth during development is known as test, analyze, and fix—TAAF. It includes system-level developmental test and posttest assessment of observed failures to determine their root causes. This assessment is followed by an analysis to identify potential reliability enhancements (e.g., hardware, software, manufacturing processes, maintenance procedures, or operations) and incorporation of specific design upgrades. The next step is retesting to verify that failure modes have been removed or mitigated and checking to see that
no new failure modes have been introduced. During developmental testing, failed systems typically are restored (by repair or replacement of parts) and returned to testing. Repeated TAAF cycles during developmental test can “grow” system reliability over time.1
A typical profile for reliability growth is shown in Figure 4-1. Part a of the figure depicts real growth: growth occurs in incremental step increases, with larger gains occurring in the earlier tests—because failure modes with higher failure rates (or failure probabilities) are more likely to occur and contribute more to reliability growth when fixed than their counterparts with smaller failure rates (or probabilities of failure). For any specific system undergoing TAAF, the exact pattern and extent of the actual growth in reliability is random, because the occurrences of individual failure modes (which lead to reliability gains) are random events.
Part b in Figure 4-1 shows how reliability results from different TAAF phases (e.g., developmental test events) are connected. The primary objective is to use all of the available data to strengthen the statistical precision associated with an estimate of system reliability2 (attained at the completion of testing of the last conducted event) and narrowing confidence intervals relative to what could be reported by using results solely from that last test event. The modeling also can smooth out point estimates of system reliability by accounting for inherent randomness in test observations.
There are three primary uses of the methodologies: to facilitate the planning of developmental testing programs (i.e., a series of TAAF phases); to track demonstrated reliability performance over the course of the testing; and to project anticipated reliability beyond observed testing.
Reliability growth modeling began with empirical observations by Duane (1964) on developmental testing programs for relatively complex aircraft accessories. For the systems he was tracking, on a log-log scale, the cumulative number of failures, N(T), tended to increase linearly with the cumulative test time, T.3 Since then, many reliability growth models have been developed (e.g., see the expository surveys in Fries and Sen, 1996; U.S. Department of Defense, 2011b).
Continuous time-on-test reliability growth models can be classified into two general categories. The first builds on a probabilistic framework for the
_______________
1 The concept of reliability growth can be more broadly interpreted to encompass reliability improvements made to an initial system design before any physical testing is conducted, that is, in the design phase, based on analytical evaluations (Walls et al., 2005). Such a perspective can be useful for systems that are not amenable to operational testing (e.g., satellites).
2 This estimate is made at the completion of the last test. It generally does not consider any reliability design improvements that may be implemented after the last event is completed and observed failure modes have been analyzed.
3 This form of “Duane’s Postulate,” or “learning curve property,” is equivalent to the average cumulative number of failures (i.e., N(T)/T) and is roughly linear in T on a log-log scale.
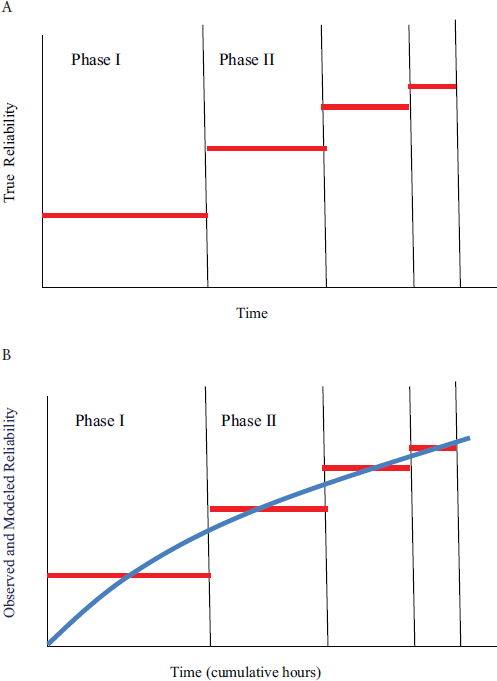
FIGURE 4-1 Illustrations of reliability growth using the TAAF (test, analyze, and fix) process.
cumulative count of failures over time. These are models of the underlying failure process. The second category directly imposes a mathematical structure on the time between successive failures (at the system level or for individual failure mode mechanisms), essentially modeling the dynamics of mean time between failures over time.4 Within each category, a number of different approaches to this modeling have been taken. Other techniques have been adapted to the reliability growth domain from biostatistics, engineering, and other disciplines. Similar categorizations describe families of discrete reliability growth models (see, e.g., Fries and Sen, 1996).
Reliability growth models generally assume that the sole change between successive developmental testing events is the system reliability design enhancements introduced between the events. This assumption constrains their applicability because it specifically excludes the integration of reliability data obtained from substantially different testing circumstances (within a test or across test events). For example, laboratory-based testing in early developmental testing can yield mean-time-between-failure estimates that are considerably higher than the estimates from a subsequent field test. Similarly, the fact that successive developmental tests can occur in substantially different test environments can affect the assumption of reliability growth. For example, suppose a system is first tested at low temperatures and some failure modes are found and fixed. If the next test is at high temperatures, then the reliability may decline, even though the system had fewer failure modes due to the design improvements. Because most systems are intended for a variety of environments, one could argue that there should be separate reliability growth curves specific to each environment. This idea may be somewhat extreme, but it is critical to keep in mind that reliability growth is specific to the conditions of use.
Another characteristic shared by the great majority of reliability growth models is that any specific application imposes a common analysis treatment of the failure data across the entire testing program. Thus, there is a reduction in analytical flexibility for representing the results in individual developmental testing events. In addition, nearly all reliability growth models lack closed-form expressions for statistical confidence intervals. Asymptotic results have been derived for some models and conceptually are obtainable from likelihood function specifications—provided that proper care is taken to account for the non-independent structure of the failure event data. The availability of parametric bootstrap methods has the potential to support statistical inference across broad categories of reliability growth models, but to date the application of this tool has been limited.
_______________
4 A model within one category necessarily generates a unique model from the other category. The physical interpretation that drives the modeling, however, does not translate readily from one type to another.
In DoD acquisition, a small number of reliability growth models dominate (see next section). But across applications, no particular reliability growth model is “best” for all potential testing and data circumstances.
The derivations of common reliability growth models are predominantly hardware-centric. In practice, however, their scope ordinarily encompasses software performance by using failure scoring rules that count all failures, whether traceable to hardware or to software failure modes, under a broad definition of “system” failure. However, the probabilistic underpinnings of software failure modes are quite different from those for hardware failure modes.5 Nevertheless, the resultant forms of software reliability growth may serve to fit reliability data from general developmental test settings.
Given that the reliability of a complex system is in fact a multidimensional outcome that is a function of various failure modes, and the surfacing of these failure modes is a function of a multidimensional input (various factors defining the environment of use), it is not surprising that a one-dimensional outcome—system reliability—expressed as a function of a one-dimensional input (time on test) is sometimes an incomplete summary.
The next two sections look at common DoD models for reliability growth and at DoD applications of growth models. The discussion in these two sections addresses analytical objectives, underlying assumptions, and practical implementation and interpretation concerns.
Two reliability growth models are used in a majority of current DoD applications: one is a system-level nonhomogeneous Poisson process model with a particular specification of a time-varying intensity function λ(T); the other is a competing risk model in which the TAAF program finds and eliminates or reduces failure modes, the remaining risk is reduced, and reliability grows.
The first model is the nonhomogeneous Poisson process formulation6 with a particular specification of a time-varying intensity function λ(T).
_______________
5 Software failure modes conceptually can be viewed as deterministic, in the sense that there is no randomness associated with how an element of code acts when called on to support a specific operation. The code either will work as intended or it will “fail,” and it repeatedly will demonstrate the identical response each time it is called on to support that same function. The pace at which the code is called on to respond to specific types of operations can, of course, be viewed as random—thereby inducing randomness in software failure processes.
6 The characterizing feature of this class of models is that the numbers of failures in non-overlapping time intervals are independent Poisson distributed random variables. A key defining metric for the models is the intensity function λ(T) (also referred to as the rate of occurrence of failure). A physically understandable and easily estimable quantity is the cumulative intensity function, Λ(T), defined to be λ(T) integrated over the time interval [0, T]. Λ(T) equals the expected cumulative number of failures at time T, that is Λ(T) = E[N(T)].
This widely used model, referred to as the power law model,7 is routinely invoked as the industry standard reliability growth model in DoD acquisition settings. In this model, the failure rate is the following function of T, the cumulative time on test:
λ(T) = μβT(β–1), μ > 0, β > 0.
This model can be interpreted as a stochastic representation of Duane’s postulate (see Crow, 1974) in which the log(λ(T)) is a linear function of log(T). The parameter μ is a scale parameter, while the parameter β determines the degree of reliability growth (β < 1) or decay (β > 1). When β = 1, the model reduces to the homogeneous Poisson process model.
The power law model and various associated statistical methodologies were popularized by the U.S. Army Materiel Systems Analysis Activity (AMSAA), building on Crow (1974) and many other reports (see U.S. Department of Defense, 2011b). Indeed, the power law model is commonly referred to as the AMSAA model, the Crow model, or the AMSAA-Crow model.8 This continuous reliability growth formulation has been extended to accommodate one-shot reliability data by treating “failure probability” in a manner that parallels that of “failure intensity” in the context of a nonhomogeneous Poisson process, and the “learning curve property” structure is imposed to establish an assumed pattern of reliability growth.
The power law model is a simple analytical representation that facilitates various analytic and inferential actions (e.g., point estimation, confidence bound constructions, and goodness-of-fit procedures). It has also spawned a number of practical follow-on methods for addressing important test program and acquisition oversight issues (see below).
Although it has such practical uses, there are theoretical problems with the power law model. One problem is that the growth in reliability is taken to be continuous over time— increasing while testing is in progress (when no changes to system reliability designs are made) and adhering to the assumed mathematical form when transitioning from one test phase
_______________
7 The power law model can be used to represent the reliability of bad as old systems, as in Ascher (1968).
8 Less common now is the nomenclature Weibull process model, originally motivated by the observation that the intensity function λ(T) for the power law model coincides with the form of the failure rate function for the time-to-failure Weibull distribution. The Weibull distribution, however, is not pertinent to this reliability growth setting. For instance, at the end of reliability growth testing under the power law construct, the governing system time-to-failure distribution for future system operations, at and beyond the cumulative test time T, is exponential with a constant mean given by the reciprocal of λ(T).
to another (when reliability design enhancements that are implemented provide substantive step-function upgrades to system reliability).9
The second reliability growth model more recently used in DoD is based on the assumption that there are a large number of failure modes and that each failure mode operates independently and causes system failure at its own rate. In this model, when a failure mode is observed in testing and subsequently removed by system design enhancements, then the failure rate is reduced at a specific discreet point in time (not continuously, as in the Crow model). If the fix does not introduce new failure modes, reliability grows as a step function.10 To unify the probabilistic behavior of failure modes prior to corrective actions, additional assumptions can be imposed. For example, for one-shot systems, it is convenient to portray failure mode performance using Bernoulli distributions with associated success probabilities drawn from a common Beta distribution (Hall et al., 2010). Likewise, failure modes for continuously operating systems can be taken to be governed by exponential distributions with failure rates drawn from a parent Gamma distribution (Ellner and Hall, 2006).11
Failure modes that are discovered through testing are categorized as either Type A or Type B, corresponding, respectively, to those for which corrective actions will not or will be undertaken (often because of cost or feasibility prohibitions). For each implemented reliability enhancement, the corresponding failure rate or failure probability is assumed to be reduced by some known fix effectiveness factor, which is based on inputs from subject-matter experts or historical data. Although the number of distinct failure modes is unknown, tractable results have been obtained by considering the limit as this count is allowed to approach infinity.
The power law and failure mode-removal models can be viewed as convenient frameworks that facilitate the application of statistical methods to the analysis of reliability test data and the evaluation of reliability testing programs. But they should not be arbitrarily mandated or capriciously imposed. Due consideration needs to be given to the plausibility of underlying assumptions, the possibilities for nonconforming reliability testing data
_______________
9 Sen and Bhattachrayya (1993) developed a more plausible reliability growth model that is consistent with the “learning curve property” but allows reliability to increase only in discrete steps when system design improvements are instituted.
10 Only one of these fundamental assumptions, statistical independence, is invoked in two failure discount estimation schemes introduced by Lloyd (1987) and used to assess system reliability for certain classes of DoD missiles. Simulation studies, however, indicate that these estimators are strongly positively biased, especially when true system reliability is increasing only modestly during a testing program (Drake, 1987; Fries and Sen, 1996).
11 For a specific extension of the methodologies based on the primary power law process, Crow (1983) captures the effect of unobserved failure modes by assuming that a second power law representation governs the first times to failure for all individual failure modes, both observed and unobserved.
(especially given any variances in testing circumstances), and the potential sensitivities of analytical results and conclusions.
Reliability growth models can be used to plan the scope of developmental tests, specifically, how much testing time should be devoted to provide a reasonable opportunity for the system design to mature sufficiently in developmental testing (U.S. Department of Defense, 2011b, Ch. 5). Intuitively, key factors in such a determination should include the reliability goal to be achieved by the end of developmental testing (say, RG), the anticipated initial system reliability at the beginning of developmental testing (say, RI), and the rate of growth during developmental testing.
The structure of power law formulations directly embraces the growth parameter component of this conceptualization, but the limits of the failure intensity function, especially approaching T = 0, do not coincide with physical reality. Nonetheless, with the benefit of a mathematically convenient constraint imposed on the initial phase of testing, the power law process provides a mechanism for assessing the total number of developmental testing hours needed for growing system reliability from RI to RG. Simulation-based extensions of the methodology support quantifications of what level for T is required to demonstrate the attainment of the system reliability target RG with prescribed level of statistical confidence. Other extensions accommodate testing that is focused on individual subsystems (growth or no growth),12 incorporating analytical aggregations to quantify reliability, and statistical confidence at the system level.
A drawback to this approach is that programmatic risks are sensitive to the length of the first developmental testing event. These shortcomings are not shared by the test planning methodology that is based on the examination of individual failure modes (see U.S. Department of Defense, 2005). That methodology relies on planning parameters that can be directly influenced by program management, such as the fraction of the initial failure rate, or failure probability, addressable by corrective actions (i.e., the management strategy); the average fix effectiveness factor; and the average delay associated with the implementation of corrective actions.
Figure 4-2 displays a typical planning curve (PM-2) for an examination of individual failure modes, highlighting inputs and illustrating key fea-
_______________
12 Testing and analysis at the subsystem level can be appropriate when system functionality is added in increments over time, when opportunities for full-up system testing are limited, and when end-to-end operational scenarios are tested piecemeal in segments or irregularly. Such aggregations, however, need to be carefully scrutinized, especially for deviations from nominal assumptions and effects on robustness.
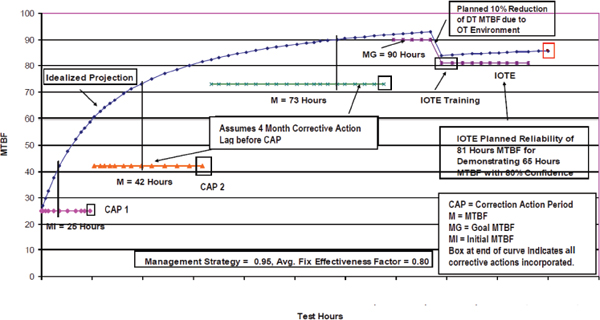
FIGURE 4-2 PM-2 reliability growth planning curve.
NOTES: DT = developmental testing; IOTE = initial test operation evaluation; OT = operational testing; MTBF = mean time between failures. See text for discussion.
SOURCE: U.S. Department of Defense (2011a, Figure 27).
tures.13 The idealized projection curve is an artificial construct that assumes all observed B-mode failures, those identified for correction, are immediately subjected to fixes. It is transformed to system reliability targets for individual developmental testing events. The number of these events and the respective allocation of testing hours across individual events are variables that planners can adjust. A corrective action period ordinarily follows each testing phase, during which reliability design improvements are implemented.14 A nominal lag period precedes each such period, in accordance with the notion that the occurrences of B-mode failures near the end of a test phase will not offer adequate time for diagnosis and redesign efforts. The final developmental testing reliability goal (in Figure 4-2, 90 hours mean time between failures) is higher than the assumed operational reliability of the initial operational test and evaluation (81 hours mean time between operational mission failures or a 10 percent reduction). This difference can accommodate potential failure modes that are unique to operational testing (sources of the developmental test/operational test [DT/OT] gap). Likewise, the planned value for the initial operational test and evaluation operational reliability is higher than the operational reliability requirement (65 hours for mean time between operational mission failures), providing some degree of confidence that the requirement will be demonstrated by the initial operational test and evaluation (reducing the consumer’s risk).
We note that the PM-2 model is currently mandated for use as a result of a memorandum issued June 26, 2011, “Improving the Reliability of U.S. Army Materiel Systems,”15 which states
Program Managers (PMs) of all Acquisition Category I (ACAT I) systems and for ACAT II systems where the sponsor has determined reliability to be an attribute of operational importance shall place reliability growth planning curves in the SEP, TEMP, and Engineering and Manufacturing (EMD) contracts and ensure that U.S. Army systems are resourced to accomplish this requirement…. Reliability growth is quantified and reflected through a reliability growth planning curve using the Planning Model based on Projection Methodology (PM2)…. Where warranted by unique system characteristics, the Army Test and Evaluation Command
_______________
13 We note that Figure 4-2 and the preceding discussions treat “reliability” in the general sense, simultaneously encompassing both continuous and discrete data cases (i.e., both those based on mean time between failures and those based on success probability-based metrics). For simplicity, the subsequent exposition in the remainder of this chapter generally will focus on those based on mean time between failures, but parallel structures and similar commentary pertain to systems that have discrete performance.
14 Not all corrective actions are implemented following a test period; some require longer time periods for development and incorporation.
15 The document is available at http://www.amsaa.army.mil/Documents/Reliability%20Policy_6_29_2011_13_10_10.pdf [August 2014].
(ATEC), in consultation with the Project Manager (PM), may specify an alternative reliability growth planning method.
A reliability growth planning curve is important for developing an overall strategy for testing and evaluation, for defining individual testing events and determining requisite supporting resources, and for providing a series of reliability targets that can be tracked to judge the progress of reliability growth. The Director of Operational Test and Evaluation (DOT&E) requires that a reliability growth curve appear in the system’s Test and Evaluation Master Plan (TEMP), but does not prescribe the specific mechanism by which the plan is to be developed. As program milestones are achieved or in response to unanticipated testing outcomes, the reliability growth curve, as well as the entire TEMP, is expected to be updated.
The DOT&E requirement for presenting and periodically revising a formal reliability growth planning curve is eminently reasonable. To generate its curve, the responsible program office can follow existing standard methods or use other approaches it deems suitable.16 What is important in practice is that any proposed reliability growth curve is fully integrated with the overall system development and test and evaluation strategies (e.g., accommodating other performance issues not related to reliability), recognizes potential sensitivities to underlying analytical assumptions, and retains adequate flexibility to respond to emerging testing results.
There are three key elements of a reliability growth curve that warrant emphasis. First, it should provide a mechanism for early checks of the adequacy of system design for reliability. Second, rough adherence to the planning curve should position a developmental program so that the initial operational test and evaluation, as a stand-alone test, will demonstrate the attainment of the operational reliability requirement with high confidence. Third, since the construction of a planning curve rests on numerous assumptions, some of which may turn out to be incompatible with the subsequent testing experience, sensitivity and robustness of the modeling need to be understood and modifications made when warranted.
Once a developmental program begins system-level testing, reliability growth methodologies are available for estimating model parameters, constructing curves that portray how demonstrated reliabilities have evolved
_______________
16 In the extreme, given a general sense of the developmental testing time available for a particular system and the customary nature of development tests ordinarily undertaken for such classes of systems, one could imagine divining a simple eye-ball fit through a potentially suitable smooth curve that traces from RI to some established mark above RG.
and compare to planned trajectories, and projecting system reliability estimates beyond what has been achieved to date (U.S. Department of Defense, 2011b, Ch. 6). There is a natural inclination for reliability analysts to routinely invoke these methods, especially when faced with budget constraints and schedule demands that cry for “efficiencies” in testing and evaluation by using all of the available data. Likewise, there is an instinctive desire for program management and oversight agencies to closely monitor a program’s progress and to support decisions backed by “high confidence” analyses. In both settings, reliability growth methods offer the prospects of accessible data synthesis—directly through simple equations or by the application of dedicated software packages.
It is sensible to view a reliability growth methodology as a potential tool for supporting in-depth assessments of system reliability, but it should not be assumed in advance to be the single definitive mechanism underpinning such analyses. Comprehensive evaluations of system reliability would consider the spectrum of testing circumstances and their relation to operational profiles, exhibited failure modes and rates for individual test articles and collections (rather than merely system failure times), insights from reliability and design engineers, observations from system operators, and a multiple of other potentially important factors germane to the specific system under development. Subsequently, after due diligence, it may be determined that standard reliability growth methods provide a reasonable approach for addressing a specific analytical issue or for conveniently portraying bottom-line conclusions.
There are a number of reasons that reliability results recorded over the course of developmental testing may not match target values or thresholds prescribed in advance by the associated reliability growth planning curve. Not all of these differences should translate to alarms that system reliability is problematic or deficient, nor should one assume that close conformity of developmental testing results to a reliability planning curve by itself ensures the adequacy of system operational reliability (e.g., the developmental tests may be unrepresentative of more stressful operational circumstances). Again, a detailed understanding of the testing conditions and the extent of divergences from operationally realistic environments and use is critical for meaningful interpretation.
Benign system-level tests (e.g., some types of laboratory or chamber testing common to early developmental testing) may yield inflated reliability results. When followed by testing characterized by more realistic loads and stresses, the apparent trend may suggest that system reliability is in decline. Similar deviations, either upwards or downwards, may be evident in the midst of a developmental testing program when the severity of the environments and use profiles is changed from test to test. Even when the intent is for uniform testing under a prescribed profile of use, test-specific irregulari-
ties can be anticipated. Crow (2008) presents a method for checking the consistency of use profiles at intermediate pre-determined “convergence points” (expressed in terms of accumulated testing time, vehicle mileage, cycles completed, etc.) and accordingly adjusting planned follow-on testing.
When system functionality is added incrementally (e.g., software modules are added as they are developed), testing of the more advanced system configurations may exhibit a relative degradation in system reliability—primarily if the unreliability of the new aspect of the system dominates the enhancements that had been incorporated in response to observations from the immediately preceding test event. Similar effects are possible when a system operationally interfaces with external systems (i.e., an element that is not part of the subject system under development), one of those peripheral systems is modified (perhaps as part of its own developmental cycles), and interface “failures” formally chargeable against the subject system occur in follow-on testing of the subject system.
There are situations in which the demonstrated system reliability falls far short of what was planned, and, after careful review, the likely candidate for the disappointing performance is some combination of an initially deficient reliability design and an inadequate reliability enhancement program. For example, the number of system reliability failures recorded in a system’s first developmental testing event may be well beyond what was envisioned for that initial test or even may far exceed what was planned for the entire developmental testing program (i.e., the complete set of planned tests). Unfortunately, this has been a too common outcome in the recent history of DoD reliability testing. Another disturbing situation is that after a few test events reliability estimates stagnate well below targeted values, while the counts of new failure modes continue to increase.
A visually detectable major departure from the planning curve by itself could provide a triggering mechanism for instituting an in-depth program review. Supporting statistical evidence can be provided by constructed confidence bounds and associated hypothesis tests, or by a formal assessment of the estimated remaining “growth potential” for the system’s reliability (deducing the theoretical upper limit for the system reliability that could be obtained within the defined testing program). The growth potential calculation could indicate that there is little chance for the program to succeed unless major system redesigns and institutional reliability management procedures are implemented (i.e., essentially constituting a new reliability growth program). Alternatively, it could show that there is no strong evidence that would compel a program intervention.
Determining the system’s reliability growth potential is a type of forecasting, functionally extrapolating forward to the ultimate attainable limit. Another documented projection methodology is essentially a one-step-ahead estimate of the system reliability—taking the level of reliability
demonstrated by completed reliability growth testing and giving additional credit for the last set of implemented reliability improvements. These approaches rely on values of failure-mode-specific fix effectiveness factors provided by subject-matter experts. If the effects of the unobserved failure modes are ignored, then positively biased estimates are produced. There are at present no associated statistical confidence bound procedures for this situation, but the setting would seem to be amenable to the application of bootstrap and Bayesian techniques.
Projection-based estimates of system reliability offer a potential recourse when the conducted growth testing indicates that the achieved reliability falls short of a critical programmatic mark. If the shortfall is significant, then the inherent subjectivity and uncertainty of provided fix effectiveness factors naturally limits the credibility of a projection-based “demonstration” of compliance. Supplementary independent reliability engineering analyses, dedicated confirmatory technical testing, or follow-on system-level testing may be warranted.
This description of the current state of reliability growth modeling highlights some issues concerning the validity of these models. Two key concerns are that time on test is often not a good predictor linking time with system reliability, and that reliability growth models generally fail to represent the test circumstances. These two criticisms raise concerns about the applicability of these models.
As noted above, DoD currently uses reliability growth models for three important purposes. First, prior to development, they are used to budget the number of hours of testing needed to grow the reliability from what it is conjectured to be as the result of initial design work to the level of the operational requirement. Because so little is known about the system at that early point in development, one cannot specify a clearly superior method: thus, the use of reliability growth models in this role is reasonable—provided that the parameters central to the specific invoked reliability growth model are plausibly achievable (e.g., based on experiences with similar classes of systems). In the case of nonhomogeneous Poisson process models, a good approach would be to select the growth parameter, β, by examining the growth observed for systems with similar structure, including some components that are essentially identical that have already been through developmental and operational testing. The panel could not determine whether this approach is currently commonplace.
Second, during development, reliability growth models are used to combine reliability assessments over test events to track the current level of reliability attained. Again, for this application, reliability growth methodologies are appropriate—subject to the validation of inherent model assumptions. However, it seems as though in many cases reliability growth models serve merely as curve fitting mechanisms. In this circumstance, we
doubt that reliability growth models would be found to be clearly superior to straightforward regression or time-series approaches.
Third, reliability growth models offer forecasting capabilities—to predict either the time at which the required reliability level ultimately will be attained or the reliability to be realized at a specific time. Here, the questions concerning the validity of reliability growth models are of the greatest concern because extrapolation is a more severe test than interpolation. Consequently, the panel does not support the use of these models for such predictions, absent a comprehensive validation. If such a validation is carried out, then the panel thinks it is likely that it will regularly demonstrate the inability of such models to predict system reliability past the very near future.


