
Appendix D
Supplemental Information About the Models
By Theodore R. Holford and David T. Levy
The CISNET smoking population model tracks individuals by age and U.S. birth cohort beginning in 1864 as the individuals progress through various smoking stages (i.e., reconstructed smoking prevalence, initiation, and cessation rates) to estimate the smoking prevalence and the rates of smoking initiation, cessation, and intensity in the United States by age and gender from 1964 through 2012 (Anderson et al., 2012; HHS, 2014; Holford et al., 2014a). The model reports population levels of smoking, non-lung cancer mortality, and overall mortality (Anderson et al., 2012; Holford and Clark, 2012; Holford et al., 2014b; Jeon et al., 2012). The CISNET smoking population model can also simulate individual smoking trajectories using a “smoking history generator” (Jeon et al., 2012). The CISNET smoking population model was recently used to assess smoking patterns and estimate the smoking rates of initiation and cessation in the United States from 1964 to 2012 (Holford et al., 2014a) and the number of premature deaths prevented in the United States by tobacco control from 1964 to 2014 (Holford et al., 2014b). The model can also simulate lung cancer incidence and mortality when coupled with lung cancer natural history models (de Koning et al., 2014; McMahon et al., 2014; Meza et al., 2014; Moolgavkar et al., 2012). The CISNET smoking and lung cancer models were used to estimate the number of lung cancer deaths in the United States prevented by historical tobacco control efforts from 1975 to 2000 (Moolgavkar et al., 2012). More recently, the CISNET smoking and lung cancer models were used to provide estimates of the potential benefits and harms of computerized tomography lung cancer screening in the United States (de Koning et al., 2014; McMahon et al., 2014; Meza et al.,
2014). The CISNET smoking population model accounts for differences in mortality rates by gender, age, birth cohort and smoking status (Holford et al., 2014b; Rosenberg et al., 2012), and it breaks the population into never smoked, former smoker, and six categories of current smokers varying by intensity. The same approach is applied to projections of U.S. mortality rates based on the Lee-Carter model (Sprague, 2009). The CISNET smoking model does not account explicitly for the effects of tobacco control policies. Instead, the model uses historical U.S. rates of smoking prevalence, initiation, cessation and intensity by age, gender, and birth cohort estimated from National Health Interview Survey (NHIS) data. These rates capture the temporal variations in U.S. smoking patterns and the indirect effects of tobacco control policies as implemented historically.
The SimSmoke model tracks the number of never, current, and former smokers by age and gender in the modeled population by year and evaluates the impacts of tobacco control policies through their effects on smoking prevalence as a function of the assumed associated changes in smoking initiation and cessation rates based on literature review and expert judgment (Levy et al., 2005, 2010b, 2012a). The SimSmoke model estimates the number of annual smoking-attributable deaths and the effects of tobacco control policies on smoking prevalence and attributable mortality, with applications to the entire United States (Levy and Friend, 2000, 2001; Levy et al., 2000a,b, 2001a, 2004, 2005, 2010b) as well as at the state level (Levy et al., 2007, 2008, 2012b), and other countries (Levy et al., 2010a, 2012a, 2013a,b, 2014, in press).
The tobacco control policies modeled in SimSmoke include tax changes, smoke-free air laws, health warnings, the Fairness Doctrine, advertising restrictions, mass media interventions, availability of cessation treatments, and youth access policies considered individually and in combination (Levy et al., 2005, 2010b, 2012a). The initial development and validation of the SimSmoke model used data from the Tobacco Use Supplement of the Current Population Survey (TUS-CPS) (Levy et al., 2005). The SimSmoke model does not consider smoking intensity and does not account for varying patterns by birth cohort.
As is the case with CISNET, the SimSmoke model considers differential mortality rates by gender, age, and smoking status (Holford et al., 2014b; Rosenberg et al., 2012) and breaks the population into never smoked, current smoker, and 16 categories of former smokers differentiated by the number of years since they quit. The SimSmoke model explores the potential effects of raising the minimum age of legal access to tobacco (MLA) on smoking initiation rates in order to make predictions of the policy effects on future smoking prevalence and smoking-attributable deaths and maternal and child health outcomes (i.e., low birth weight, pre-term births and sudden infant deaths) while simultaneously accounting for ongoing tobacco control efforts.
CISNET MODEL (BY HOLFORD)
Smoking History Summary for the United States, 1965–2012
The data from 36 NHISs conducted from 1965 to 2012 were analyzed using the method employed by CISNET (Holford et al., 2014b). Results from this analysis provided summary estimates for birth cohorts starting in 1864 and ending in the calendar year 2012. These estimates included
- Current smoker prevalence;
- Former smoker prevalence;
- Never smoker prevalence;
- Yearly smoking initiation probabilities for never smokers;
- Yearly smoking cessation probabilities for current smokers; and
- Distribution of categories for reported daily cigarettes per day (CPD): CPD≤5, 5<CPD≤15, 15<CPD≤25, 25<CPD≤35, 35<CPD≤45, 45<CPD.
Smoking Prevalence Model
A compartment (macro) model that characterizes a typical smoking history in which a subject begins to smoke at some point (never → current smoker) after which they may quit (current → former smoker) was used. While this over simplifies what can be much more complex in reality, it does provide a useful characterization of the experience for most of the population. Smoking cessation can be especially difficult to characterize because it is often not successful on the first attempt. Hence, we adopted the rule that subjects who report quitting must have done so at least 2 years before the interview, otherwise their period of observation is regarded as being truncated at the given age at cessation.
We defined the basic quantities of interest conditional on a hypothetical case with no transitions to death. Let a represent age, t period or calendar year, and c cohort or year of birth, and all three temporal components may play a role when constructing the basic parameters affecting smoking history. These temporal indicators are related by c = t − a, therefore, when presenting the relationships among the basic model parameters, we can without loss of generality represent them as functions of age and cohort. The smoking initiation probability, p(a,c), is the conditional probability of smoking initiation at age a for cohort c, if not a smoker at a − 1, i.e.,
p(a,c) = Pr{Smoker at a | Not smoker at (a – 1),c}.
It is related to the cumulative proportion of ever smokers at a conditional on remaining alive,
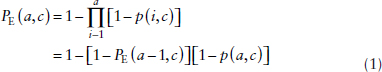
where PE(0,c) = 0, which is equivalent to the actuarial approach for estimating the survival curve. If smoking did not affect mortality then one would expect equation (1), which is conditional on remaining alive, to also hold in a population followed over time. But, of course, mortality is affected by smoking so that the observed proportion of the population who have ever smoked at a particular age is given by PE*(a,c) ≤ PE(a,c). Initiation probabilities estimated at a particular survey would be similarly affected by differential mortality; and we represented these by p*(a,c) = p(a,c)/Cp where Cp ≥ 1 is a constant correction factor introduced to adjust for this effect. We assumed that differential mortality among smoking categories had little effect early in life and the impact intensified with age. Cohorts born before 1935 would only have survey data for ages over 30 when one might expect differential mortality to begin to introduce substantial bias in the unadjusted estimate, ![]() *(a,c). In recent cohorts, almost all smoking initiation occurred before age 30, but for those born early in the twentieth century it was not so uncommon for initiation to occur later in life, especially in women. Later smoking initiation would also tend to postpone the effect of differential mortality in the cohort. We assumed that the differential mortality resulting from cigarette smoking occurred at ages, a ≥ a0, and PE*(a,c) = PE(a,c) for a < a0. Initiation probabilities corrected for differential mortality were found by solving
*(a,c). In recent cohorts, almost all smoking initiation occurred before age 30, but for those born early in the twentieth century it was not so uncommon for initiation to occur later in life, especially in women. Later smoking initiation would also tend to postpone the effect of differential mortality in the cohort. We assumed that the differential mortality resulting from cigarette smoking occurred at ages, a ≥ a0, and PE*(a,c) = PE(a,c) for a < a0. Initiation probabilities corrected for differential mortality were found by solving
![]()
for Cp, i.e., by matching the cumulative initiation rates to the estimated prevalence at age a0. We assumed that a0 was the age at first survey in 1965 or 30, whichever was older.
Smoking cessation was assumed to be a function of age for each cohort. The smoking cessation probability conditional on the subject being alive and currently smoking is
q(a,c) = Pr{Former smoker at a | Smoker at (a – 1),c}.
We assumed that q(a,c) = 0 for a < 15 and we estimated it for 15 ≤ a ≤ 99. The cumulative proportion of smokers in cohort c who had not ceased smoking by age a is given by
![]()
For simplicity, we assumed that this quantity does not depend on the age an individual started smoking, number of cigarettes per day or other factors that may be related to an individual’s success in quitting. Because initiation tends to occur in a fairly narrow age range, variation in age of initiation becomes less of a factor affecting mortality as a cohort gets older. Introducing intensity of smoking into a model for cessation would require detailed lifetime histories of smoking which were not commonly obtained by NHIS, a limitation in the available data.
Current smokers represent ever smokers who have not quit, and given our assumption that this only depends on age for a given cohort, the prevalence is
PC(a,c) = PE(a,c)Q(a,c).
Former smokers are those who have smoked at some point in their lives, but quit before age a, and the proportion of these individuals is
PF(a,c) = PE(a,c) – PC(a,c)
= PE(a,c)[1 – Q(a,c)].
Finally, the proportion of cohort c who have never smoked is the complement of those who ever smoked,
PN(a,c) = 1 – PE(a,c).
For a given age and cohort, the sets of current, former, and never smokers are exhaustive, i.e.,
PC(a,c) + PF(a,c) + PN(a,c) = 1.
Estimation of smoking parameters Data were only obtained for a restricted range of ages, a in [amin,amax], and periods, t in [tmin,tmax] so that the earliest cohort would be cmin − tmin − amax and the latest cmax = tmax − amin. Available data for a given cohort c, would cover an age range that would vary by cohort, i.e., a in [tmin − c, tmax − c]. To fill in smoking history that was not represented in the survey, we represented
each temporal effect as a nonparametric function that we applied outside the range of observed data.
Cross-sectional estimates of ever smokers For years covered by surveys, i.e., 1965–2012, participants provided information that could be used to estimate the prevalence of ever smokers by age, a, for the corresponding cohort, c = t − a. Let Yi be 1 if the i-th individual ever smoked and 0 otherwise, where the probability of the response is a function of age and cohort, PE(a,c). We assume an additive logistic model for Yi, so that
logit {PE(a,c)} = b0 + ba(a) + bc(c)
where β0 is an intercept and β.(•) is a function given by a constrained natural spline. The model was fitted using PROC GENMOD in SAS® with knots specified as
Age: 40, 50, 60, 70
Cohort: 1910, 1920, 1930, 1940, 1945, 1950, 1955, 1960, 1965, 1970, 1980
We assumed that the cohort effect remained constant for those born after 1979, the most recent cohort that would provide data to a survey regarding smoking history after age 30 in 2012 which was the age used to identify Cp. Values used for subsequent cohorts were set to be identical to those for the 1982 birth cohort.
Smoking initiation probability Unadjusted estimates of annual age-specific smoking initiation probabilities for a given cohort, ![]() *(a,c), were directly derived from NHIS data. For each cohort represented in a survey, we determined the number of subjects who started to smoke, d(a,c), and who had never smoked to that point, n(a,c). These comprised the response data introduced into a linear logistic model in which the temporal factors were nonparametric functions to be estimated. Each NHIS survey represented participants who survived until that time, and because this group would overrepresent individuals in a cohort who started smoking late or not at all, these cohort-specific initiation probabilities would be biased downward. The correction factor was found by specifying the target value for the estimated cumulative initiation at a specific age, a0, to be equal to the value estimated from the cross-sectional analysis, i.e.,
*(a,c), were directly derived from NHIS data. For each cohort represented in a survey, we determined the number of subjects who started to smoke, d(a,c), and who had never smoked to that point, n(a,c). These comprised the response data introduced into a linear logistic model in which the temporal factors were nonparametric functions to be estimated. Each NHIS survey represented participants who survived until that time, and because this group would overrepresent individuals in a cohort who started smoking late or not at all, these cohort-specific initiation probabilities would be biased downward. The correction factor was found by specifying the target value for the estimated cumulative initiation at a specific age, a0, to be equal to the value estimated from the cross-sectional analysis, i.e.,
![]()
and finding Ĉp which satisfies this condition.
To determine the crude initiation probability estimates, an age-period-cohort model was fitted to the tabulated data given number of subjects who start smoking and are at risk of starting at a given age,
logit {p*(a,c)} = b0 + ba(a) + bt(t) + bc(c)
where β0 is an intercept and β.(•) is given by a constrained natural spline. We were only interested in the fitted values for the initiation probabilities, which were not affected by the well-known identifiability problem in age-period-cohort models. Knots were specified as:
age: 10, 15, 20, 50, 60
period: 1910, 1920, 1930, 1940, 1950, 1960, 1970, 1980
cohort: 1910, 1920, 1930, 1940, 1945, 1950, 1955, 1960, 1965, 1970, 1980
Age for the target used to determine the correction factor was age in 1965 (year of the first NHIS survey) or 30, whichever was older, a* = max{1965 – c,30}. The target value for the cumulative probability of being a smoker was the estimate derived in the analysis of the prevalence curve, ![]() (a*,c).
(a*,c).
Smoking cessation probability An individual was identified as having quit smoking if they had not smoked for 2 years. Because of the 2-year lag used in the definition of quitting, an individual who reports cessation at age a − 2 or later could not be classified and they would be truncated at that age. Hence, current smokers were similarly truncated at age a − 2. Data used for this analysis were from surveys conducted from 1970–2012, including subjects reporting ages from 17–98. If the reported age of cessation was younger than 8, it was set to 8. For each year of age following smoking, a binary response was created based on our definition of quitting. Yearly estimates of the linear logistic age-period-cohort model were fitted in which
logit {q(a,t,c)} = b0 + ba(a) + bt(t) + bc(c)
where β0 is an intercept and β.(•) are given by a constrained natural splines. We were only interested in the fitted values for the cessation probabilities, which are not affected by the well-known identifiability problem in age-period-cohort models. Knots were specified as follows:
age: 30, 40, 50, 60
period: 1920, 1930, 1940, 1950, 1960, 1970, 1980
cohort: 1910, 1920, 1930, 1940, 1950, 1960, 1970
Estimates of the yearly cessation probability for age a and cohort c were the fitted values for ages 15–99, ![]() (a,a + c,c). The conditional cessation probabilities were used to generate the cumulative probabilities of not quitting,
(a,a + c,c). The conditional cessation probabilities were used to generate the cumulative probabilities of not quitting, ![]() (a,a + c,c), using equation (2).
(a,a + c,c), using equation (2).
Cigarettes smoked per day Reports of the number of cigarettes smoked per day showed an extremely high degree of digit preference, especially concentrated at half or whole U.S. packs. Therefore, dose was analyzed as an ordered categorical response with half pack being at the center of the category, which was also usually the mode and close to the mean. The intervals (approximate interval center) employed were: CPD≤5 (3); 5<CPD≤15 (10); 15<CPD≤25 (20); 25<CPD≤35 (30); 35<CPD≤45 (40); and 45<CPD (60). A cumulative logistic model was fitted to the data using PROC LOGISTIC in SAS® with age, period and cohort represented by additive nonparametric factors function of time using constrained natural splines. Knots were specified as:
age: 25, 30, 35, 40, 45, 50, 55, 60, 65, 70
period: 1970, 1975, 1980, 1985, 2000, 2005
cohort: 1910, 1920, 1930, 1940, 1950, 1960, 1970, 1980
The fitted estimates of the probabilities for each category of smoking dose for each cohort for ages 0 to 99 were used as parameters for the smoking history generator. Estimates for cohorts born before 1920 were constrained to be the same as for the 1920 birth cohort. Similarly, estimates for cohorts born after 2002 were constrained to be identical to those of the 2002 cohort, who would be 7 in 2012, i.e., the year before the earliest age at initiation considered in this analysis.
Estimation of current, former, and never smokers for 1-year cohorts Estimates of smoking prevalence were derived from tkhe estimated curves for ever smokers, ![]() E(a,c), and the corresponding survival function for not quitting,
E(a,c), and the corresponding survival function for not quitting, ![]() (a,c). The estimated prevalence of current smokers by age and cohort is
(a,c). The estimated prevalence of current smokers by age and cohort is
![]() C(a,c) =
C(a,c) = ![]() E(a,c)
E(a,c) ![]() (a,c).
(a,c).
Prevalence of former smokers is
![]() F(a,c) =
F(a,c) = ![]() E(a,c) –
E(a,c) – ![]() C(a,c)
C(a,c)
= ![]() E(a,c)[1 –
E(a,c)[1 – ![]() (a,c)].
(a,c)].
Finally, prevalence of never smokers is
![]() N(a,c) = 1 –
N(a,c) = 1 – ![]() E(a,c).
E(a,c).
Estimated Smoking History Measures, 2012–2100
In order to assess the impact of a change in the minimum legal age of purchase of cigarettes we assume that the impact will primarily affect smoking initiation probabilities and not cessation probabilities or smoking intensity distribution, which were assumed to remain unchanged for future birth cohorts who would experience the policy change. The model status quo initiation and cessation rates are available on the CISNET resources website.1 We assumed that a change to the MLA in 2015 would primarily affect those who were 15 or older, i.e., the 2000 or later birth cohorts. Using the methods described elsewhere (Holford et al., 2014b), the postulated changes in initiation probabilities yielded ever-smoker prevalence estimates in the subsequent birth cohorts. In addition, using the methods described, we obtained estimates of current and former smoker prevalence estimates. The distribution of smoking intensity categories was assumed to remain the same in future birth cohorts.
Smoking status–specific death rates (current smoker by intensity, former smoker, and never smoker), µi(t), were obtained using the Human Mortality Database (HMD) mortality rates for the United States by age, calendar year and gender combined with the method described by Rosenberg et al. (2012). HMD rates were then projected to 2100 using the Lee-Carter model (Sprague, 2009) and then further broken down by smoking status using the Rosenberg et al. method. The death rate at age t for a particular scenario was determined by the given distribution of smoking status, pi(t),
![]()
where i represents the various smoking status/intensity combinations. These death rates were used to modify the population distribution in order to reflect the effect of the change in mortality rate (Holford et al., 2014a). The resulting death rates and estimated populations for 2012–2100 were used to obtain summary measures of the effect of a given scenario.
Premature Deaths Due to Tobacco Use
The excess death rate resulting from tobacco use was estimated by the difference between the death rate under the given scenario and the death rate for never smokers, [![]() (t) – µ0 (t)], where µ0(t) is the death rate at age t for never smokers. If P(t is the population size at age t, then the number of premature deaths due to tobacco use is given by
(t) – µ0 (t)], where µ0(t) is the death rate at age t for never smokers. If P(t is the population size at age t, then the number of premature deaths due to tobacco use is given by
________________
1 See https://resources.cisnet.cancer.gov/projects/#shg/iomr.
![]()
Population estimates by single years of age (0–84 and 85+) were obtained from the U.S. Census for years 1964 through 2060 (USCB, 2013a,b). Population estimates going to 2100 were obtained by following the population from the previous year and assuming that the proportional change would remain the same. For age 0, we assume that after 2060 the proportional increase will be the same as the change estimated by the U.S. Census for 2059 to 2060.
Years of Life Lost
Using the age-specific death rates for a cohort, the expected years of life remaining at age t, e(t), was calculated. For a death that occurs at age t, life expectancy for never smokers, e0(t), would estimate the mean number of years of life lost. The total years of life lost by smokers who died early is given by
![]()
Lung Cancer Deaths Avoided
The two-stage clonal expansion (TSCE) model (Hazelton et al., 2012; Meza et al., 2008) was used to estimate the lung cancer mortality rate. For current smokers, the model gives the rate at age t as a function of age at initiation and smoking intensity. We assume that the age at initiation is independent of intensity, so the joint distribution is obtained as the product of the probability of initiation at a given age and the probability of a particular smoking intensity level. These were then used to obtain the mean lung cancer mortality rate for current smokers. Similarly, for former smokers we obtain the mean lung cancer mortality rate for a particular age of interest by first determining the joint distribution of age at initiation, age at cessation, and smoking intensity. Multiplying this joint distribution by the lung cancer mortality rate obtained from the TSCE model and then summing over all combination of initiation and cessation times provides the probability of lung cancer death at age t. Finally, we obtain the overall rate for a particular scenario by taking a weighted average of the lung cancer mortality rates for never, current, and former smokers. The excess rate is obtained by taking the difference between the rate for the scenario and the rate for never smokers. Multiplying this by the population gives the number
of lung cancer deaths avoided for a given age, and taking the sum over all ages provides the overall number of lung cancer deaths avoided.
Birth Cohort and Period Temporal Perspectives
The models used to estimate the fundamental parameters of smoking initiation, cessation, intensity, and ever-smoker prevalence were derived from the birth cohort perspective. This captures the life course of different generations, and it provides useful summaries of the groups that would have experienced a change in the MLA at a point in life in which they are most likely to initiate cigarette smoking. Viewed from this perspective, we determined life expectancy, premature deaths from smoking, and excess lung cancer deaths caused by smoking from the temporal perspective of following these individuals through life. Because these individuals would be classified as belonging to a group upon enactment of a change in the MLA, the model assumptions would result in no further changes in the birth cohort smoking history, which would result in constant age-specific death rates for all causes and specific causes. Any changes in the number of subjects affected reflect trends in the size and the age structure of the population.
Results are also presented from the period or calendar year perspective, which describe the view experienced by the health community. Mortality rates differ little in absolute magnitude until after age 40, and diseases like lung cancer have long latency. Hence, the effect of changing MLA would not be discernable until decades after enactment of a change. However, once the effect becomes observable, it will continue to increase until it reaches steady state. The summaries from the period perspective include estimates of the number of premature deaths from all causes or from a specific cause in a given calendar year. Life expectancy estimates given for a period represent a summary of the age-specific death rates in a given year, which is identical to the traditional demographic summary that is commonly used as one summary measure of the health of the country. In contrast to the estimates derived from the cohort perspective, this summary does not correspond to the life course of a population.
SIMSMOKE (BY LEVY)
The U.S. SimSmoke Model
SimSmoke divides the population in 1965 into (1) never smokers (Neversmokers, indicated in subscripts by “ns”), (2) smokers (Smoker, indicated in subscripts by “s”), and (3) 15 categories of former smokers (Formersmokersk, where k = 1, …, 14, 15+, corresponding to the year quit). Individuals are classified as never smokers from birth until they initi-
ate smoking or die, as shown below, where t is the year and a is the age of the individual:
Neversmokerst,a =
Neversmokerst–1,a–1 * (1 – MortRatet–1,a–1,ns)*(1 – Initiation ratet–1,a–1).
Never smokers can become smokers through initiation. Once they have become smokers, individuals continue in that category until they quit or die. Former smokers continue in that category until they die or re-enter the group of smokers through relapse. The number of smokers is tracked as:
Smokerst,a =
Smokerst–1,a–1*(1 – MortRatet–1,a–1,s)*(1 – Cessation ratet–1,a–1)
+ ∑15+k=2 Former smokerst−1, a−1,k*(1 – MortRatet–1,a–1,k)*(Relapse ratea–1,k)
+ Neversmokerst–1,a–1*(1 – MortRate t–1,a–1,ns)*Initiation ratet–1,a–1.
First-year former smokers are determined by the first-year cessation rate applied to surviving smokers in the previous year. After the first year quit, individuals who have been former smokers for k = 2, …, 14 are defined as:
Former smokerst,a,k =
Former smokerst–1,a–1,k–1*(1 – MortRatea,k)*(1 – Relapse ratea,k–1).
For those who have quit smoking for 15 or more years, 15+, the equation above includes all individuals who have quit more than 15 years from the previous year.
Data on smoking rates are from Holford et al. (2014a) and are based on NHIS. Smoking prevalence is defined as the percentage of people in the population who have smoked 100 cigarettes during their lifetime and currently smoke. Initiation rates through age 30 are based on responses for age of initiation and having smoked 100 cigarettes. Cessation is tracked from age 16, because data from NHIS on cessation begins at that age. Cessation rates are defined in terms of having quit for 2 years, which reflects a trade-off between higher cessation rates in the first year and relapse in later years. After 1965, relapse rates are also distinguished by age and gender, and the number of years since quitting (HHS, 1990; Hughes et al., 2008). The SimSmoke model status quo initiation and cessation rates are available on the CISNET resources website.2
________________
2 See https://resources.cisnet.cancer.gov/projects/#shg/iomr.
Smoking-Attributable Deaths
To estimate smoking-attributable deaths (SADs), we used age- and gender-specific current and never-smoker mortality rates used by Holford et al. (2014b) based on the Cancer Prevention Studies (CPS-I and CPS-II) and the Nutrition Follow-up to CPS-II. For smokers, SADs are defined in terms of the excess death rate of current smokers (smoker mortality rate minus never-smoker mortality rate). Mortality rates for former smokers decrease progressively from the current smoker toward the never-smoker level as years since quitting increase, according to CPS-II data (Burns et al., 1997). SADs are estimated for current and former smokers by age (a), gender (g), and year (t) by summing over age (a) as:
∑85a=40 excess death riska,g,t * prevalencea,g,t * projected populationa,g,t.
Policy Analysis
Separate policy modules estimate the effects of past tax changes, smoke-free air laws, health warnings, advertising restrictions, mass media, cessation treatment, and youth access policies. The original policy parameters used to generate the predicted effects are based on thorough reviews of the literature and the advice of an expert panel (Friend and Levy, 2001, 2002; Levy and Friend, 2000, 2001, 2002a,b; Levy et al., 2000a,b, 2001a,b, 2004). The policy effects (PEs) are calculated in percentage terms, i.e., PE = (post-policy rate – initial rate)/initial rate, with PE < 0, assuming an effective policy where the post-policy rate is less than the initial rate. For most policies, the greatest effect will occur in the first few years in which the policy is in effect, modeled as a permanent additive effect on smoking prevalence, i.e., Smokerst,a * (1 + PPEi,t,a) for policy i at time t, age a, with PPE defined as the prevalence of PE. If the policy is maintained, the effects of the policy are sustained throughout future years as: Initiation ratea * (1 + IPEi,a), with IPE defined as the initiation PE. The effect of a maintained policy increase in the cessation rate over time is given as: Cessation ratea * (1 – CPEi,t,a), with CPE defined as the cessation PE. SimSmoke projects smoking rates through 2014, based on policies that were implemented over the period 1964–2014. The effect sizes are shown in Table D-1.
Data on the levels of policies were input into the SimSmoke model for the years 1965 through 2012. We calibrated model cessation rates against data on smoking prevalence through 1985, leading to a reduction in those rates of 9 percent for females, 10 percent for males ages 55–64, and 20 percent for males of ages 65 and above. Table D-2 shows the sources and specifications for the data used in SimSmoke in this report.
TABLE D-1 Policy Inputs and Effect Sizes in SimSmoke
| Policy | Description | Potential Percentage Effecta |
| Cigarette Taxes (Levy et al., 2000a) | ||
| Cigarette price | The state level average price for a pack of cigarettes (including branded and generic), including state and federal excise taxes. Tobacco Institute (Orzechowski and Walker, 2012), adjusted for inflation using the consumer price index (www.bls.gov/cpi/home.htm) | For each 10% price increase: 6% reduction ages 15–17, 4% reduction ages 18–24, 2% reduction ages 25–34, and 1% reduction ages 35 and above |
| Smoke-free Air Laws (Levy et al., 2001b) | ||
| Worksite ban, well-enforced | Smoking banned in all indoor worksites in all areas | 6% reduction |
| Worksite restrictions, weak | Smoking in restricted areas only | 2% reduction |
| Restaurant and bar ban, well-enforced | Ban in all indoor restaurants in all areas | 2% reduction |
| Restaurant ban, weak | Smoking in restricted areas only | 1% reduction |
| Other places bans | Ban in three of four (retail stores, arenas, public transportation, and elevators) | 1% reduction |
| Enforcement and publicity | Compliance reflecting norms and publicity as tobacco control campaign variable | Effects reduced by as much as 50% if no compliance or publicity |
| Fairness Doctrine and Advertising Restrictions (Lewit et al., 1981; Warner, 1989; Warner and Murt, 1983) | ||
| Existence of fairness doctrine | Airing of antismoking messages on radio and television from July 1, 1967, to January 1, 1971, and banning of cigarette advertising on radio in 1970 and television in 1971 | 39% reduction in initiation rates, 8% increase in cessation rates |
| Tobacco Control Campaigns (Levy and Friend, 2001) | ||
| Well-funded campaign | Campaign expenditures meeting the pre-2009 CDC minimum recommended | 6.5% reduction |
| Moderately funded campaign | Campaign expenditures meeting 50% of the pre-2009 minimum recommended | 3.6% reduction |
| Low funded campaign | Campaign expenditures meeting <25% of the pre-2009 minimum recommended | 1.2% reduction |
| Policy | Description | Potential Percentage Effecta | |
| Health Warnings (Azagba and Sharaf, 2013; Hammond et al., 2007; Huang et al., 2014) | |||
| Weak health warnings | Non-graphic warning covers less than one-third of the package. Reports, score = 2 | 1% reduction in prevalence and 2% increase in cessation only | |
| Cessation Treatment Programs (Levy and Friend, 2002a; Levy et al., 2010b) | |||
| Availability of NRT and Bupropion | If NRT is provided by either general store or pharmacy with Rx = 1 and = 2 If NRT is provided by general store or pharmacy (no Rx required). If Bupropion is provided by either general store or pharmacy with Rx = 1. | 1% reduction if score of 3b | |
| Provision of treatments | Types of facilities distinguished, specified as primary care facilities, hospitals, offices of health professionals. Community and other. MPOWER: 0 = None, Yes in some = 1, Yes in most = 2. | 2.25% reduction if indicator = 2 for all facilities and program is well publicizedb | |
| Quit line | Operating active quit line | 0.5% reductionb | |
| Comprehensive cessation treatment | A proactive quit line with NRT, complete treatment coverage through insurance | ~3% reduction in prevalence, and 20% increase in cessationb | |
| Youth Access Restrictions (Levy et al., 2001a) | |||
| Strongly enforced and publicized | Compliance checks are conducted 4 times per year per outlet, penalties are potent and enforced, and with heavy publicity and community involvement | 20% reduction for those ages 16–17 and 30% reduction for those age <16c | |
| Moderate enforcement | Compliance checks are conducted at least once per year per outlet, penalties are moderate, and with some publicity | 10% reduction for those ages 16–17 and 15% reduction for those age <16c | |
| Low enforcement | Compliance checks are conducted sporadically, penalties are weak, there is little merchant awareness and minimal community participation | 2.5% reduction for those ages 16–17 and 4% reduction for those age <16c | |
a The effect sizes are shown relative to the absence of any policy. Unless otherwise specified, the same percentage effect is applied as a percentage reduction in the prevalence in the initial year and as a percentage reduction in initiation rate and a percentage increase in the cessation rate in future years, and is applied to all ages and both genders.
b Applied to prevalence and first year quit rates only.
c Applied to initiation and prevalence only.
TABLE D-2 Data Used in SimSmoke
| Variable | Current Source | Current Specifications |
|
I. Population model |
||
|
A. Population |
1965–2065 Census and Census Projections and Projections by Ted Holford from 2066 through 2100 | Breakdowns by age and gender |
|
B. Mortality rates |
1965–2065 Multiple Cause-of-Death File and Cancer Prevention Study I and II and the Nutrition Follow-up to CPS-II Projected U.S. mortality rates based on the Lee-Carter model (Sprague, 2009) | Breakdowns by age, gender, and smoking status (current, former, never) |
|
II. Smoking model—initialized in 1965, with future changes in initiation and cessation rates due to policies through policy modules |
||
|
A. Baseline smoking rates for current and ex-smokers |
1965 National Health Interview Survey (NHIS) for age 10+ | 100+ cigarettes lifetime, distinguished by current and former smokers. (<1, 1–2, 3–5, 6–10, 11–14, 15+ years) by age and gender |
|
B. Initiation rates |
1965 National Health Interview Survey (NHIS) for age 10+ | Breakdowns by age and gender |
|
C. First year cessation rates |
1965 National Health Interview Survey (NHIS) for age 16+ | Breakdowns by age and gender |
|
D. Relapse rates |
Previous studies (Gilpin et al., 1997; HHS, 1990; Hughes et al., 2008) | Breakdowns by age and gender |
|
E. Excess death risks of smokers and ex-smokers |
1965–2100 death rates by current, former, and never smokers as developed by CISNET (Holford et al., 2014b) | Breakdowns by age, gender, and smoking status |
|
III. Policy modules—levels from 1965–2014 |
||
|
A. Price and taxes |
Orzechowski and Walker, (2013) www.bls.gov/cpi/home.htm | Prices and CPI for 1965–2014 |
|
B. Smoke-free air laws |
www2.cdc.gov/nccdphp/osh/state/report_index.asp and www.impacteen.org | Different types of laws and their stringency and compliance rates |
|
C. Media and other educational campaigns |
CDC and tobaccofreekids.org | Expenditures per capita by state |
|
D. Cessation treatment programs |
MPOWER Reports (Levy et al., 2010b; WHO, 2008, 2013) | Indicators of when pharmacotherapies became available, cessation treatment locations and quitlines |
| Variable | Current Source | Current Specifications |
|
E. Health warnings |
HHS (2014) | Indicator of strength |
|
F. Fairness doctrine |
Warner (Warner, 1989; Warner and Murt, 1983) | Indicator of extent of implementation |
|
G. Youth access enforcement |
CDC, SAMHSA (Levy et al., 2001a) | Enforcement checks, penalties, community campaigns, self-service and vending machine bans |
The percent changes in smoking prevalence from SimSmoke were validated against the percent change in NHIS rates for four age groups (18–24, 25–44, 45–64, 65+) over the period 1965–2012. By 2012 male adult smoking prevalence (18 and above) from both NHIS and SimSmoke showed a decline of 61 percent relative to the initial 1965 level. Female smoking prevalence from the NHIS declined 54 percent, compared with 53 percent from SimSmoke. Generally, SimSmoke predicted prevalence rates for females and males that were similar to the NHIS rates, except for underestimating the reduction for males between the late 1970s and late 1990s. By 2012 SimSmoke obtains estimates for male smoking prevalence by age group that are very similar to the NHIS estimates, but it underestimated rates during the 1980s and early 1990s. For females, SimSmoke predicted the relative decline in smoking prevalence by 2012 well for all age groups, except for the 65-and-above age group.
The effects of a change in the MLA are modeled through initiation rates beginning in 2015. The 2015 initiation rates used to predict the effects of the change in the MLA are those derived from SimSmoke based on the policy effects applied to changes in policy levels between 1965 through 2014. The initiation rates are constant from 2015 through 2100.
Estimating Smoking-Attributable Birth Outcomes3
SimSmoke considers three smoking-attributable adverse birth outcomes (SAABOs): sudden infant death syndrome (SIDS), low birth weight (LBW), and pre-term birth (PTB). To calculate the number of cases of modeled SAABO, we use the method employed in the Smoking-Attributable Mortality, Morbidity, and Economic Costs (SAMMEC) software (Melvin et al.,
__________________
3 The methods and data regarding maternal and child health outcomes are presented in more detail than other outcomes for transparency, because they have not yet been published.
2000). SAFs, based on the attributable-fraction formula originally described by Levin (1953) and expanded upon by Lilienfeld (1980), are multiplied by the total number of events of each modeled outcome. Separate estimates are calculated for each year (t) by age group (a), i.e, for each outcome.
SAABOa,t = Number of Observed Events a,t × SAFa,t
Number of Observed Events represents the total observed adverse birth cases for a given outcome in the population, including those for both smoking and nonsmoking mothers. Measures of outcome prevalence are multiplied by the size of the corresponding population. In SimSmoke, the number of outcomes is available for each smoking outcome by age of the mother for SIDS, LBW, and PTB as well as for others aggregated over all maternal ages. SAFs are calculated using the smoking prevalence and relative risk of current maternal smokers aged 15–49, or some subset thereof. SAFs for each outcome by year (t) and age group (a) are derived using the following formula:
SAFa,t = [(1 – pa,t) + pa,t × RR - 1] / [(1 – pa,t) + pa,t × RR], where
p = percentage of pregnant women who are nonsmokers during pregnancy, and
RR = relative risk of outcome where maternal smokers relative to nonsmokers.
While the maternal smoking prevalence can vary by age and year in the above formulation, we assume that relative risks are constant over time and by age since past studies do not adequately distinguish by age. Summing across age categories for a particular year (t) provides the estimate of SAABO for each health outcome for that year.
Figure D-1 provides a flowchart of the estimation process for maternal and child health (MCH) outcomes.
Data
Adverse MCH outcomes For LBW and PTB, National Center for Health Statistics (NCHS) data on adverse MCH outcomes by age and gender for 2012 were obtained from CDC Wonder, the epidemiological database operated by the Centers for Disease Control and Prevention (CDC) (HHS et al., 2014b). For SIDS, data were obtained for all ages from CDC Wonder for 2011 (the most recent year) (HHS et al., 2014a), and the proportions by age group were based on overall infant mortality (Matthews and MacDorman, 2013). Because overall rates for each MCH outcome have been relatively constant in recent years, the percent of maternal outcomes in 2012 is maintained for all future years. The data by age are presented in Table D-3. LBW, PTB, and SIDS are highest at younger ages and for above
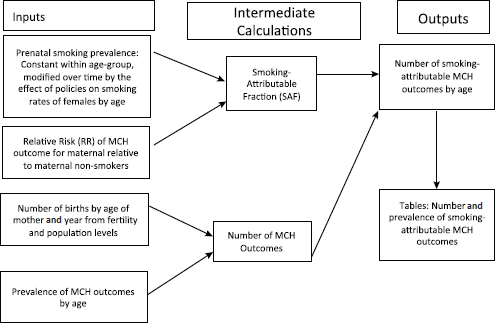
FIGURE D-1 Relationship of the components for each maternal and child health (MCH) outcome.
TABLE D-3 Gestational Age and Birth Weight, 2012
| Age group | PTB, LBW | PTB NW | FTB, LBW | All PTB | All LBW | FTB, NW | Total |
| <15 | 8.8% | 12.1% | 3.7% | 20.9% | 12.5% | 75.4% | 3,657 |
| 15–19 | 7.3% | 7.3% | 3.5% | 14.6% | 10.8% | 81.9% | 309,849 |
| 20–24 | 5.1% | 6.4% | 3.2% | 11.6% | 8.3% | 85.2% | 904,623 |
| 25–29 | 5.4% | 5.7% | 2.5% | 11.2% | 7.9% | 86.3% | 1,130,250 |
| 30–34 | 5.1% | 5.9% | 2.4% | 10.9% | 7.5% | 86.7% | 1,011,765 |
| 35–39 | 6.0% | 6.8% | 2.6% | 12.8% | 8.6% | 84.6% | 471,499 |
| 40–44 | 8.3% | 8.7% | 3.4% | 17.0% | 11.7% | 79.6% | 103,127 |
| 45–49 | 14.0% | 10.7% | 5.1% | 24.7% | 19.1% | 70.2% | 7,122 |
NOTE: FTB = non-preterm; LBW = low birth weight; NW = normal weight; PTB = pre-term birth.
age 40. In addition, it should be noted that there is overlap between PTB and LBW, especially at younger ages. We assume that the rates are constant from 2012 onward, but the model is flexible enough to allow for trends in the prevalence of MCH outcomes over time.
The total number of adverse MCH outcomes over time depends on fertility rates. The fertility rates were obtained from the NCHS through CDC WONDER (U.S. Department of Health and Human Services for the year 2012 categorized by age of the mother) (HHS et al., 2014b). We use projected fertility rates by the United States (CDC, 2014; USCB, 2014) through 2060 to extrapolate for future years through 2100. The projections show fertility rates that are slowly decreasing over time, and it is assumed that rates after 2060 stay constant. Since the projected rates are not distinguished by age, the age distribution from 2012 is assumed to remain constant. The fertility rates are multiplied by the projected population used in the model (see above) to obtain the total number of births by age.
Relative risks to MCH The estimates of relative risks to MCH are based on reviews (Cnattingius, 2004; HHS, 2004) and recent studies (Aliyu et al., 2010, 2011; Anderka et al., 2010; Dietz et al., 2010; Steyn et al., 2006; van den Berg et al., 2013; Zhang and Wang, 2013) for each of the outcomes: PTB, LBW, and SIDS. We estimate a relative risk of 1.4 for PTBs, 2.0 for LBW and 2.5 for SIDS. We assumed the same relative risks for all women (ages 15 to 49) and for all years. In addition, we do not distinguish risks by smoking intensity or by the month of quitting if the women stopped smoking at some point during pregnancy. The relative risks used to estimate MCH outcomes are shown in Table D-4.
Maternal smoking prevalence Data were developed based on women reporting smoking while pregnant. Data on the prevalence of pregnant women for the United States were obtained from NCHS for 2012 disaggregated by age-group (15–19, 20–24, …, 40–44, 45–49) (HHS et al., 2014b). These data are based on birth certificates and now cover most of the states. Many states were excluded after the 2003 revision in how
TABLE D-4 Relative Risks Used in Estimating Maternal and Child Health Outcomes in SimSmoke
| MCH Outcome | Best Estimate | Lower Bound | Upper Bound |
| Pre-term Birth (PTB) | 1.4 | 1.1 | 1.7 |
| Low Birth Weight (LBW) | 2.0 | 1.5 | 2.5 |
| Sudden Infant Death Syndrome (SIDS) | 2.5 | 1.4 | 4.0 |
tobacco was reported because they did not adopt the 2003 revision, but by 2012 only 13 states (Alabama, Alaska, Arizona, Arkansas, Connecticut, Hawaii, Maine, Michigan, Mississippi, New Jersey, Rhode Island, Virginia, and West Virginia) were excluded. We confined the analysis to the year 2012, when most states’ reports had adopted the 2003 revisions, and project forward from that year. The data are shown in Table D-5.
After comparing the prenatal smoking rates from NCHS to estimates from the Pregnancy Risk Assessment Monitoring System (PRAMS) and the National Survey on Drug Use and Health (NSDUH) for 2011, the most recent year for which data from all three datasets are available, we found the rates from NCHS (9.0 percent) were lower than from PRAMS (10.5 percent) and NSDUH (15.9 percent). The NCHS data and also the PRAMS data are known to consistently underestimate smoking rates because of underreporting. For example, Tong et al. (2013) analyzed the PRAMS 2008 questionnaire and the eight states that also used the 2003 BC revision. Using the same age stratification, the 20–24 age group again had the highest prevalence in both the BC and PRAMS prevalence, but the combined prevalence for the <20 age group had a slightly higher prevalence (22.6 percent compared to 22.5 percent). Tong and colleagues also found that the NCHS data understated smoking prevalence compared to the combined estimates by 65 per-
TABLE D-5 Tobacco Use by Pregnant Women by Age of Mother, Data from NCHS
| Age Group | 2012 | ||||||||
| <15 | 15–19 | 20–24 | 25–29 | 30–34 | 35–39 | 40–44 | 45–49 | Total | |
| Totalb births* | 3.0 | 254.4 | 761.8 | 939.5 | 846.6 | 395.7 | 91.8 | 6.1 | 3,298.8 |
| % | 2.8% | 10.9% | 13.5% | 8.9% | 5.6% | 4.3% | 4.2% | 2.6% | 8.6% |
| tobacco use | |||||||||
| % | 2.6% | 2.0% | 2.0% | 1.7% | 1.6% | 1.7% | 1.8% | 2.2% | 1.7% |
| not stated | |||||||||
| % | 17.1% | 16.7% | 16.9% | 16.4% | 16.5% | 16.2% | 16.2% | 15.4% | 16.5% |
| births, tobacco use not reported | |||||||||
* In thousands; “total births” limited to births in those states for which tobacco use is reported. Births in states that used incompatible birth certificates version are omitted from the “total births.” “% births, tobacco use not reported” is the percentage of all births from all states for that year.
cent for the <20 age group (13.7 percent in NCHS versus. 22.6 percent combined), by 35 percent for the 20–24 age group (16.7 percent in NCHS versus. 22.5 percent combined), by 27 percent for the 25–29 age group (13.2 percent NCHS versus. 16.7 percent combined) and by 30 percent for the 30 and above group (6 percent NCHS versus. 7.8 percent combined). We applied these correction factors to the NCHS data.
We calibrated the 2012 smoking prevalence from SimSmoke to the adjusted NCHS maternal smoking prevalence by determining adjustment factors that equilibrated the smoking prevalence to the adjusted maternal prevalence by 5-year age groups (15–19, 20–24, …, 45–49). In SimSmoke, estimates of prenatal smoking prevalence may change as a result of policies through changes in prevalence, initiation or cessation rates (see above). For changes in the MLA, the changes only take place through the initiation rate.
Detailed Results for the MLA from SimSmoke
The status quo policy level for smoking rates among female adults (age 18 and above) is predicted to decline from 15 percent in 2015 to 10.8 percent in 2065 and then to remain steady at that rate. The prevalence shows little fluctuation throughout the years for females in age group 15–17, with only small reductions for those ages 18–20 and 21–24.
The results for changes in the MLA are based on best estimates of their effects with the lower and upper plausible ranges in parentheses. The relative percentage reductions in smoking rates for each age group increase with the MLA. For example, by implementing the new MLA in 2015, the smoking prevalence of adult (ages 18 and above) females in the year 2010 is projected to fall relative to the status quo by 3.1 percent (range 2.2 to 4.1 percent) under an MLA of 19, 11.6 percent (range 9.4 to 14.2 percent) under MLA 21, and 16.5 percent (range 11.7 to 23.2 percent) under MLA 25. Due to the assumption of a 2-year initiation rebound for MLA 19 and MLA 21, slight increases in smoking prevalence and MCH outcomes for the age of the MLA and the next age are predicted in the early years.
LBW Under the status quo, in 2015 the incidence rate of smoking-attributable LBW babies is about 0.8 percent among the total births for all the women of childbearing age (ages 14–49), but 1.3 percent for the ages 20–24 years. The rates decrease after 2015, except for the maternal age group 15–19, in which the rate increases to 1.6 percent in 2100 due to the sustained growth of the fertility rate. For all women of childbearing age, an estimated 3.8 million LBW infants are projected to be born between 2015 and 2100 because of the mother’s prenatal smoking.
By raising the MLA to 19, SimSmoke estimates that there will be a cumulative total of 2,000 LBW outcomes averted (range 1,200–2,800)
in the first 5 years (2015–2020), 60,700 (range 44,600–79,000) within 50 years, and 122,800 (range 90,700–159,200) within 85 years. If the MLA is increased to 21, the number of averted cases each year will be more than twice as high as for MLA 19. For all women of childbearing age, an MLA of 21 is predicted to avert about 217,900 LBW cases (range 176,700–267,000) from 2015 to 2065 and about 435,100 cases (range 353,500–532,600) between 2015 and 2100. Increasing the MLA to 25 is predicted to avert a total of 593,000 LBW cases averted (range 419,100–842,800) within 85 years.
PTB Under the status quo, the smoking-attributable PTB incidence rate for mothers of age 15–19 increases slightly, from 0.94 percent in 2015 to 0.95 percent in 2100, while the rates for other age groups all show slight declines. For all women of childbearing age, the incidence rate is 0.51 percent in 2015, decreasing to 0.49 percent by 2100. Because of escalating birth rates, however, the number of smoking-attributable PTBs is estimated to increase from 20,800 in 2015 to 28,200 in 2065 and 33,500 in 2100. A total of about 2,307,000 smoking-attributable PTBs are predicted between 2015 and 2100.
An MLA of 19 is estimated to prevent a total of 1,300 smoking-attributable PTBs (range 810–1,880) for all women of childbearing age compared to the status quo level over the first 5 years, an additional 39,000 (range 29,500–52,000) within 50 years, and a total of 81,000 (range 60,000–105,000) for the entire span from 2015 to 2100. By increasing the MLA to 21, the number of averted cases is predicted to be more than two times higher than for an MLA of 19 for the age group 15–19 and more than three times higher for age groups 20–24, 25–34, and 35–49. For all women, MLA 21 is predicted to prevent a total of about 142,000 PTB cases (range 116,000–174,000) by 2065 and 283,300 cases (range 231,000–346,000) by 2100. Increasing the MLA to 25 is predicted to prevent a total of 385,000 PTBs (range 273,000–543,000) between 2015 and 2100.
SIDS Under the status quo policy, the incidence rate of smoking-attributable SIDS for the maternal age group 15–49 is 0.008 percent in 2015. Since birth rates are projected to increase, the estimated smoking-attributable SIDS cases will slightly increase over time. From 2015 to 2100, the total number of annual SIDS cases will increase by about 200 (from 320 to 520), with a total of 35,600 smoking-attributable deaths over that period.
Over the period from 2015 to 2100, SimSmoke predicts a total of 1,100 (range 832–1,455) SIDS deaths would be averted by raising the MLA to 19; a total of 3,980 (range 3,200–4,900) deaths would be averted (range 3,200–4,900) under MLA 21; and 5,400 (range 3,800–7,700) deaths would be averted under MLA 25.
In summary, raising the MLA to 19, 21, or 25 is projected to have an increasingly larger impact on LBW, PTB, and SIDS, especially in raising the MLA to 21. Between 2015 and 2100, about 122,800 LBW cases, 80,900 PTBs, and 1,100 SIDS cases are projected to be averted under MLA 19; this would increase to 435,100 LBW cases, 283,300 PTBs, and 3,980 SIDS cases under MLA 21; and it would become 593,000 LBW cases, 384,600 PTBs, and 5,400 SIDS cases under MLA 25. Thus, about three times more cases would be averted under MLA 21 than MLA 19, and about 1.35 times more cases would be prevented under MLA 25 than MLA 21.
In applying SimSmoke to estimate adverse birth outcomes, five limitations merit consideration: (1) The analysis does not distinguish the overlap in diagnosis between LBW babies and PTBs. Consequently, the sum of the two outcomes is an overstatement. (2) The analysis does not specifically incorporate the time quit or the amount of cigarettes smoked by those who continue smoking while pregnant. The analyses can be extended to consider these factors as well as to allow for age-specific variations in relative risks as better information becomes available. (3) In examining maternal smoking over time, important differences in smoking behaviors by socioeconomic status were not considered. (4) The under-diagnosis and underreporting of adverse MCH outcomes merit further consideration as they apply to estimating smoking-attributable risks. (5) The model does not directly incorporate changes in policies that target pregnant smokers such as smoking cessation and other health care–related programs.
RESULTS FROM UPPER AND LOWER SCENARIOS FOR INITIATION RATE ASSUMPTIONS FOR DIFFERENT MLA POLICY OPTIONS
We present smoking prevalence, mortality, and health outcome projections from both models under the upper and lower initiation scenarios. Corresponding figures and tables for the mid-initiation scenario are shown in Chapter 8. Figures D-2 through D-5 show projections of smoking prevalence from 2015 to 2100. Tables D-6 through D-9 show premature deaths prevented for selected years for both models. Tables D-10 through D-13 show projected years of life lost for the CISNET model. Figures D-6 and D-7 show projected cumulative lung cancer deaths prevented according to the CISNET model.
ADDITIONAL MODEL OUTPUTS
In this section we present additional outcomes from the CISNET model. Figures D-8 and D-9 show projections of premature deaths due to smoking from 2000 to 2100 by gender for all initiation scenarios. The figures also
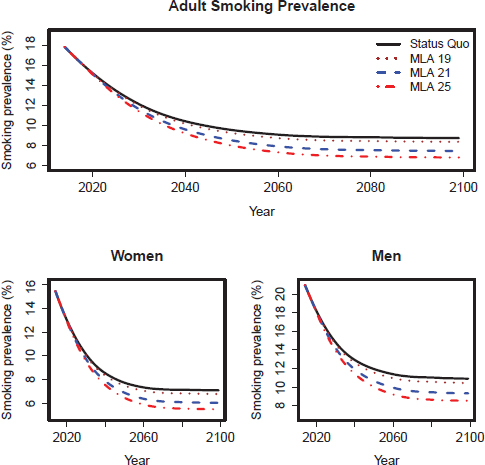
FIGURE D-2 CISNET model–projected smoking prevalence for the upper scenarios of the three MLA policy options for adults (18+), adult women, and adult men in the United States for 2014–2100.
show projections under an idealized scenario where all smoking initiation stops in 2015 (Ideal).
Figures D-10 and D-11 show projected mean-pack years for adults ages 40 or older for all initiation scenarios.
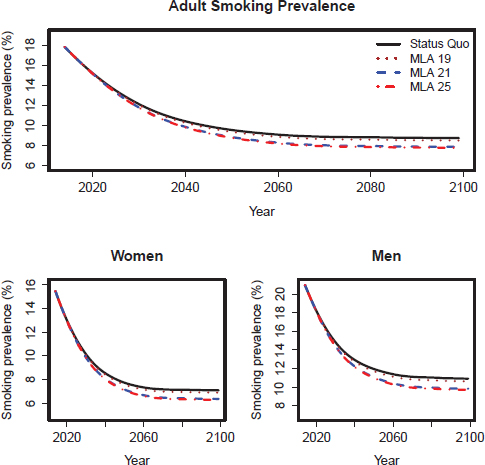
FIGURE D-3 CISNET model–projected smoking prevalence for the lower scenarios of the three MLA policy options for adults (18+), adult women, and adult men in the United States for 2014–2100.
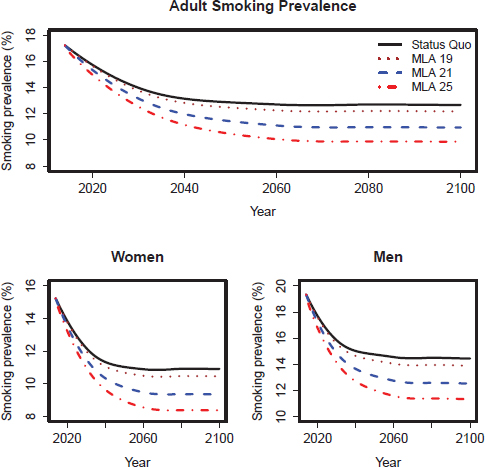
FIGURE D-4 SimSmoke model–projected smoking prevalence for the upper scenarios of the three MLA policy options for adults (18+), adult women, and adult men in the United States for 2014–2100.
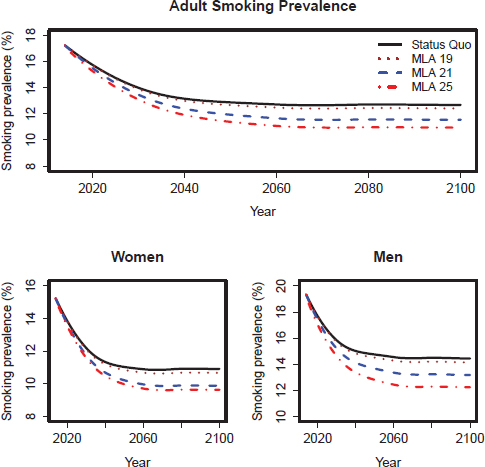
FIGURE D-5 SimSmoke model–projected smoking prevalence for the lower scenarios of the three MLA policy options for adults (18+), adult women, and adult men in the United States for 2014–2100.
TABLE D-6 Cumulative Premature Deaths Expected and Prevented by Period: CISNET Upper Scenarios
| MLA/Outcome | 2020–2039 | 2040–2059 | 2060–2079 | 2080–2099 | 2015–2100 |
| Status Quo | |||||
| Premature deaths expected | 6,782,000 | 4,568,000 | 2,927,000 | 1,996,000 | 18,978,000 |
| MLA 19 | |||||
| Deaths prevented | — | 4,000 | 26,000 | 57,000 | 87,000 |
| Percentage reduction | 0.0% | 0.1% | 0.9% | 2.9% | 0.5% |
| MLA 21 | |||||
| Deaths prevented | — | 13,000 | 91,000 | 199,000 | 304,000 |
| Percentage reduction | 0.0% | 0.3% | 3.1% | 10.0% | 1.6% |
| MLA 25 | |||||
| Deaths prevented | — | 20,000 | 140,000 | 306,000 | 465,000 |
| Percentage reduction | 0.0% | 0.4% | 4.8% | 15.3% | 2.4% |
NOTE: Assumes upper scenarios and that the policy is implemented in 2015. Although the table carries many significant figures to aid in reproducibility, precision is limited to one or two digits.
TABLE D-7 Cumulative Premature Deaths Expected and Prevented by Period: CISNET Lower Scenarios
| MLA/Outcome | 2020–2039 | 2040–2059 | 2060–2079 | 2080–2099 | 2015–2100 |
| Status Quo | |||||
| Premature deaths expected | 6,782,000 | 4,568,000 | 2,927,000 | 1,996,000 | 18,978,000 |
| MLA 19 | |||||
| Deaths prevented | — | 2,000 | 16,000 | 36,000 | 55,000 |
| Percentage reduction | 0.0% | 0.0% | 0.5% | 1.8% | 0.2% |
| MLA 21 | |||||
| Deaths prevented | — | 9,000 | 62,000 | 136,000 | 207,000 |
| Percentage reduction | 0.0% | 0.2% | 2.1% | 6.8% | 1.1% |
| MLA 25 | |||||
| Deaths prevented | — | 10,000 | 70,000 | 154,000 | 234,000 |
| Percentage reduction | 0.0% | 0.2% | 2.4% | 7.7% | 1.2% |
NOTE: Assumes lower scenarios and that the policy is implemented in 2015. Although the table carries many significant figures to aid in reproducibility, precision is limited to one or two digits.
TABLE D-8 Cumulative Premature Deaths Expected and Prevented by Period: SimSmoke Upper Scenarios
| MLA/Outcome | 2020–2039 | 2040–2059 | 2060–2079 | 2080–2099 | 2015–2100 |
| Status Quo | |||||
| Premature deaths expected | 8,108,000 | 6,393,000 | 4,963,000 | 4,277,000 | 26,840,000 |
| MLA 19 | |||||
| Deaths prevented | — | 14,000 | 71,000 | 142,000 | 226,000 |
| Percentage reduction | 0.0% | 0.2% | 1.4% | 3.3% | 0.8% |
| MLA 21 | |||||
| Deaths prevented | 1,000 | 65,000 | 285,000 | 521,000 | 873,000 |
| Percentage reduction | 0.0% | 1.0% | 5.7% | 12.2% | 3.3% |
| MLA 25 | |||||
| Deaths prevented | 5,000 | 139,000 | 528,000 | 873,000 | 1,546,000 |
| Percentage reduction | 0.1% | 2.2% | 10.6% | 20.4% | 5.8% |
NOTE: Assumes upper scenarios and that the policy is implemented in 2015. Although the table carries many significant figures to aid in reproducibility, precision is limited to one or two digits.
TABLE D-9 Cumulative Premature Deaths Expected and Prevented by Period: SimSmoke Lower Scenarios
| MLA/Outcome | 2020–2039 | 2040–2059 | 2060–2079 | 2080–2099 | 2015–2100 |
| Status Quo | |||||
| Premature deaths expected | 8,108,000 | 6,393,000 | 4,963,000 | 4,277,000 | 26,840,000 |
| MLA 19 | |||||
| Deaths prevented | — | 5,000 | 32,000 | 73,000 | 109,000 |
| Percentage reduction | 0.0% | 0.1% | 0.6% | 1.7% | 0.4% |
| MLA 21 | |||||
| Deaths prevented | — | 39,000 | 180,000 | 341,000 | 561,000 |
| Percentage reduction | 0.0% | 0.6% | 3.6% | 8.0% | 2.1% |
| MLA 25 | |||||
| Deaths prevented | 4,000 | 92,000 | 339,000 | 550,000 | 985,000 |
| Percentage reduction | 0.0% | 1.4% | 6.8% | 12.9% | 3.7% |
NOTE: Assumes lower scenarios and that the policy is implemented in 2015. Although the table carries many significant figures to aid in reproducibility, precision is limited to one or two digits.
TABLE D-10 Years of Life Lost (YLL) by Period: CISNET Model, Upper Scenario
| Status Quo | YLL Under MLA 19 Upper Scenario | MLA 19 % Reduction | YLL Under MLA 21 Upper Scenario | MLA 21 % Reduction | YLL Under MLA 25 Upper Scenario | MLA 25 % Reduction | |
| 2000–2019 | 134,823,000 | — | 0.0% | — | 0.0% | — | 0.0% |
| 2020–2039 | 106,126,000 | — | 0.0% | — | 0.0% | — | 0.0% |
| 2040–2059 | 68,217,000 | 128,000 | 0.2% | 429,000 | 0.6% | 662,000 | 1.0% |
| 2060–2079 | 46,490,000 | 7,212,000 | 1.6% | 2,416,000 | 5.2% | 3,731,000 | 8.0% |
| 2080–2099 | 36,688,000 | 1,240,000 | 3.4% | 4,152,000 | 11.3% | 6,416,000 | 17.5% |
NOTE: Although the table carries many significant figures to aid in reproducibility, precision is limited to one or two digits.
TABLE D-11 Lifetime Years of Life Lost (YLL) by Cohort: CISNET Model, Upper Scenario
| Status Quo | YLL Under MLA 19 Upper Scenario | MLA 19 % Reduction | YLL Under MLA 21 Upper Scenario | MLA 21 % Reduction | YLL Under MLA 25 Upper Scenario | MLA 25 % Reduction | |
| 2000–2019 | 40,116,000 | 1,518,000 | 3.8% | 5,082,000 | 12.7% | 7,855,000 | 19.6% |
| 2020–2039 | 36,447,000 | 1,459,000 | 4.0% | 4,884,000 | 13.4% | 7,547,000 | 20.7% |
| 2040–2059 | 36,084,000 | 1,445,000 | 4.0% | 4,837,000 | 13.4% | 7,475,000 | 20.7% |
| 2060–2079 | 37,412,000 | 1,498,000 | 4.0% | 5,015,000 | 13.4% | 7,750,000 | 20.7% |
| 2080–2099 | 38,874,000 | 1,557,000 | 4.0% | 5,211,000 | 13.4% | 8,053,000 | 20.7% |
NOTE: Although the table carries many significant figures to aid in reproducibility, precision is limited to one or two digits.
TABLE D-12 Years of Life Lost (YLL) by Period: CISNET Model, Lower Scenario
| Status Quo | YLL Under MLA 19 Lower Scenario | MLA 19 % Reduction | YLL Under MLA 21 Lower Scenario | MLA 21 % Reduction | YLL Under MLA 25 Lower Scenario | MLA 25 % Reduction | |
| 2000–2019 | 134,823,000 | — | 0.0% | — | 0.0% | — | 0.0% |
| 2020–2039 | 106,126,000 | — | 0.0% | — | 0.0% | — | 0.0% |
| 2040–2059 | 68,217,000 | 83,000 | 0.1% | 292,000 | 0.4% | 333,000 | 0.5% |
| 2060–2079 | 46,490,000 | 467,000 | 1.0% | 1,645,000 | 3.5% | 1,875,000 | 4.0% |
| 2080–2099 | 36,688,000 | 803,000 | 2.2% | 2,827,000 | 7.7% | 3,224,000 | 8.8% |
NOTE: Although the table carries many significant figures to aid in reproducibility, precision is limited to one or two digits.
TABLE D-13 Lifetime Years of Life Lost (YLL) by Cohort: CISNET Model, Lower Scenario
| Status Quo | YLL Under MLA 19 Lower Scenario | MLA 19 % Reduction | YLL Under MLA 21 Lower Scenario | MLA 21 % Reduction | YLL Under MLA 25 Lower Scenario | MLA 25 % Reduction | |
| 2000–2019 | 40,116,000 | 982,000 | 2.4% | 3,459,000 | 8.6% | 3,946,000 | 9.8% |
| 2020–2039 | 36,447,000 | 944,000 | 2.6% | 3,324,000 | 9.1% | 3,792,000 | 10.4% |
| 2040–2059 | 36,084,000 | 935,000 | 2.6% | 3,292,000 | 9.1% | 3,755,000 | 10.4% |
| 2060–2079 | 37,412,000 | 970,000 | 2.6% | 3,414,000 | 9.1% | 3,894,000 | 10.4% |
| 2080–2099 | 38,874,000 | 1,007,000 | 2.6% | 3,547,000 | 9.1% | 4,046,000 | 10.4% |
NOTE: Although the table carries many significant figures to aid in reproducibility, precision is limited to one or two digits.
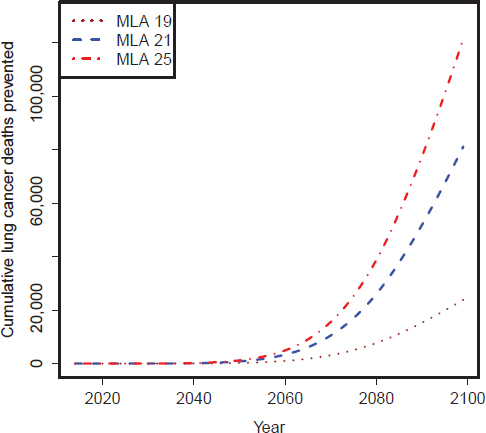
FIGURE D-6 CISNET model–estimated number of cumulative lung cancer deaths prevented per year for the three MLA policy options: Upper scenarios.
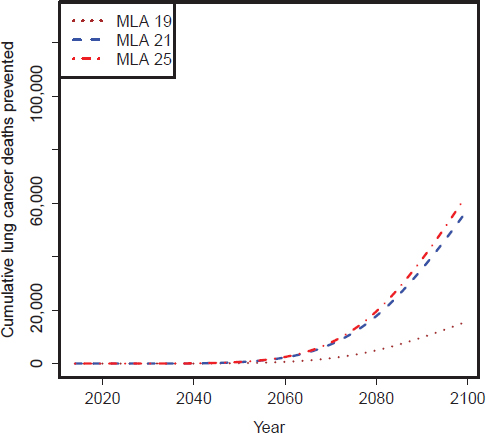
FIGURE D-7 CISNET model–estimated number of cumulative lung cancer deaths prevented per year for the three MLA policy options: Lower scenarios.
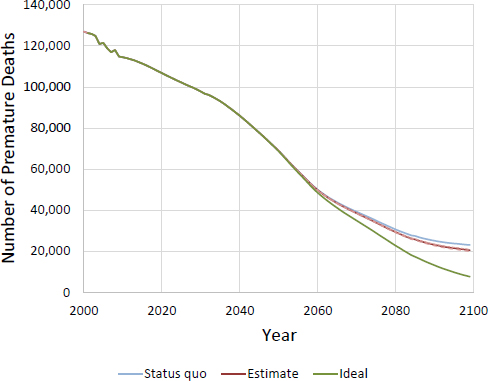
FIGURE D-8 CISNET model–projected number of female deaths prevented per year for MLA 21. Ideal represents a scenario where no smoking initiation occurs after 2015.
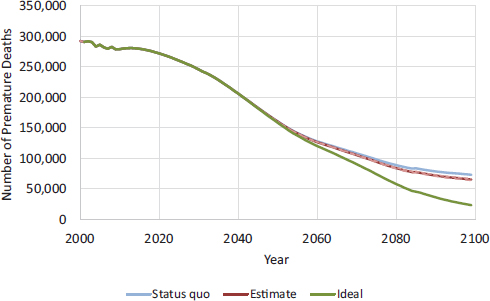
FIGURE D-9 CISNET model–projected number of male deaths prevented per year for MLA 21. Ideal represents a scenario where no smoking initiation occurs after 2015.
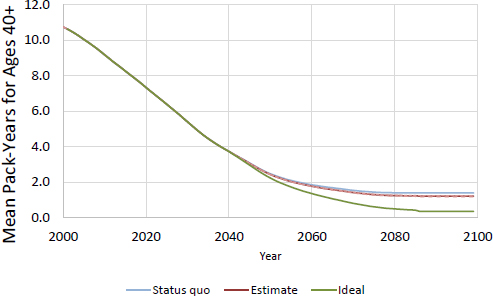
FIGURE D-10 CISNET model–projected mean smoking pack-years for women age 40 or older for MLA 21.
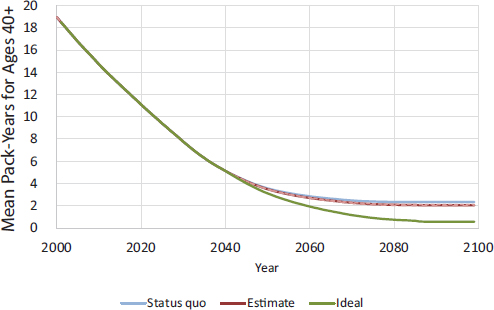
FIGURE D-11 CISNET model–projected mean smoking pack-years for men age 40 or older for MLA 21.
REFERENCES
Aliyu, M. H., O. Lynch, R. Saidu, A. P. Alio, P. J. Marty, and H. M. Salihu. 2010. Intrauterine exposure to tobacco and risk of medically indicated and spontaneous preterm birth. American Journal of Perinatology 27(5):405–410.
Aliyu, M. H., O. Lynch, R. E. Wilson, A. P. Alio, S. Kristensen, P. J. Marty, V. E. Whiteman, and H. M. Salihu. 2011. Association between tobacco use in pregnancy and placenta-associated syndromes: A population-based study. Archives of Gynecology and Obstetrics 283(4):729–734.
Anderka, M., P. A. Romitti, L. Sun, C. Druschel, S. Carmichael, G. Shaw, and National Birth Defects Prevention Study. 2010. Patterns of tobacco exposure before and during pregnancy. Acta Obstetricia et Gynecologica Scandinavica 89(4):505–514.
Anderson, C. M., D. M. Burns, K. W. Dodd, and E. J. Feuer. 2012. Chapter 2: Birth-cohort-specific estimates of smoking behaviors for the U.S. population. Risk Analysis 32(Suppl 1):S14–S24.
Azagba, S., and M. F. Sharaf. 2013. The effect of graphic cigarette warning labels on smoking behavior: Evidence from the Canadian experience. Nicotine & Tobacco Research 15(3):708–717.
Burns, D., L. Garfinkel, and J. Samet (eds.). 1997. Changes in cigarette-related disease risks and their implication for prevention and control. Bethesda, MD: National Cancer Institute.
CDC (Centers for Disease Control and Prevention). 2014. CDC WONDER. http://wonder.cdc.gov (accessed January 16, 2015).
Cnattingius, S. 2004. The epidemiology of smoking during pregnancy: Smoking prevalence, maternal characteristics, and pregnancy outcomes. Nicotine & Tobacco Research 6(Suppl 2):S125–S140.
de Koning, H. J., R. Meza, S. K. Plevritis, K. ten Haaf, V. N. Munshi, J. Jeon, S. A. Erdogan, C. Y. Kong, S. S. Han, J. van Rosmalen, S. E. Choi, P. F. Pinsky, A. Berrington de Gonzalez, C. D. Berg, W. C. Black, M. C. Tammemagi, W. D. Hazelton, E. J. Feuer, and P. M. McMahon. 2014. Benefits and harms of computed tomography lung cancer screening strategies: A comparative modeling study for the U.S. Preventive Services Task Force. Annals of Internal Medicine 160(5):311–320.
Dietz, P. M., L. J. England, C. K. Shapiro-Mendoza, V. T. Tong, S. L. Farr, and W. M. Callaghan. 2010. Infant morbidity and mortality attributable to prenatal smoking in the U.S. American Journal of Preventive Medicine 39(1):45–52.
Friend, K., and D. T. Levy. 2001. Smoking treatment interventions and policies to promote their use: A critical review. Nicotine & Tobacco Research 3(4):299–310.
———. 2002. Reductions in smoking prevalence and cigarette consumption associated with mass-media campaigns. Health Education Research 17(1):85–98.
Gilpin, E. A., J. P. Pierce, and A. J. Farkas. 1997. Duration of smoking abstinence and success in quitting. Journal of the National Cancer Institute 89(8):572–576.
Hammond, D., G. T. Fong, R. Borland, K. M. Cummings, A. McNeill, and P. Driezen. 2007. Text and graphic warnings on cigarette packages: Findings from the International Tobacco Control Four Country Study. American Journal of Preventive Medicine 32(3):202–209.
Hazelton, W. D., J. Jeon, R. Meza, and S. H. Moolgavkar. 2012. Chapter 8: The FHCRC lung cancer model. Risk Analysis 32(Suppl 1):S99–S116.
HHS (Department of Health and Human Services). 1990. The health benefits of smoking cessation: A report of the Surgeon General. Atlanta Georgia: U.S. Department of Health and Human Services, Public Health Service, Centers for Disease Control, Office on Smoking and Health.
———. 2004. The health consequences of smoking: A report of the Surgeon General. Atlanta, GA: U.S. Department of Health and Human Services, Centers for Disease Control and Prevention, National Center for Chronic Disease Prevention and Health Promotion, Office on Smoking and Health.
———. 2014. The health consequences of smoking—50 years of progress: A report of the Surgeon General. Atlanta, GA: U.S. Department of Health and Human Services, Centers for Disease Control and Prevention, National Center for Chronic Disease Prevention and Health Promotion, Office on Smoking and Health.
HHS, CDC, NCHS, and DVS (Department of Health and Human Services, Centers for Disease Control and Prevention, National Center for Health Statistics, and Department of Vital Statistics). 2014a. CDC WONDER: Linked birth/infant death records for 2011. http://wonder.cdc.gov/lbd.html (accessed February 25, 2015).
———. 2014b. CDC WONDER: Natality public-use data for 2012. http://wonder.cdc.gov/natality-current.html (accessed February 25, 2015).
Holford, T. R., and L. Clark. 2012. Chapter 4: Development of the counterfactual smoking histories used to assess the effects of tobacco control. Risk Analysis 32(Suppl 1):S39–S50.
Holford, T. R., D. T. Levy, L. A. McKay, L. Clarke, B. Racine, R. Meza, S. Land, J. Jeon, and E. J. Feuer. 2014a. Patterns of birth cohort-specific smoking histories, 1965–2009. American Journal of Preventive Medicine 46(2):e31–e37.
Holford, T. R., R. Meza, K. E. Warner, C. Meernik, J. Jeon, S. H. Moolgavkar, and D. T. Levy. 2014b. Tobacco control and the reduction in smoking-related premature deaths in the United States, 1964–2012. JAMA 311(2):164–171.
Huang, J., F. J. Chaloupka, and G. T. Fong. 2014. Cigarette graphic warning labels and smoking prevalence in Canada: A critical examination and reformulation of the FDA regulatory impact analysis. Tobacco Control 23(Suppl 1):i7–i12.
Hughes, J. R., E. N. Peters, and S. Naud. 2008. Relapse to smoking after 1 year of abstinence: A meta-analysis. Addictive Behaviors 33(12):1516–1520.
Jeon, J., R. Meza, M. Krapcho, L. D. Clarke, J. Byrne, and D. T. Levy. 2012. Chapter 5: Actual and counterfactual smoking prevalence rates in the U.S. population via microsimulation. Risk Analysis 32(Suppl 1):S51–S68.
Levin, M. 1953. The occurrence of lung cancer in man. Acta Unio Internationalis Contra Cancrum 9(3):531–541.
Levy, D. T., and K. B. Friend. 2000. A simulation model of tobacco youth access policies. Journal of Health Politics, Policy and Law 25(6):1023–1050.
———. 2001. A computer simulation model of mass media interventions directed at tobacco use. Preventive Medicine 32(3):284–294.
———. 2002a. Examining the effects of tobacco treatment policies on smoking rates and smoking related deaths using the SimSmoke computer simulation model. Tobacco Control 11(1):47–54.
———. 2002b. A simulation model of policies directed at treating tobacco use and dependence. Medical Decision Making 22(1):6–17.
Levy, D. T., K. M. Cummings, and A. Hyland. 2000a. Increasing taxes as a strategy to reduce cigarette use and deaths: Results of a simulation model. Preventive Medicine 31(3):279–286.
———. 2000b. A simulation of the effects of youth initiation policies on overall cigarette use. American Journal of Public Health 90(8):1311–1314.
Levy, D. T., K. B. Friend, H. Holder, and M. Carmona. 2001a. Effect of policies directed at youth access to smoking: Results from the SimSmoke computer simulation model. Tobacco Control 10(2):108–116.
Levy, D. T., K. B. Friend, and E. Polishchuk. 2001b. Effect of clean indoor air laws on smokers: The clean air module of the SimSmoke computer simulation model. Tobacco Control 10(4):345–351.
Levy, D. T., F. Chaloupka, and J. G. Gitchell. 2004. The effects of tobacco control policies on smoking rates: A tobacco control scorecard. Journal of Public Health Management and Practice 10(4):338–353.
Levy, D. T., N. Nikolayev, and E. A. Mumford. 2005. Recent trends in smoking and the role of public policies: Results from the SimSmoke tobacco control policy simulation model. Addiction 10(10):1526–1537.
Levy, D. T., A. Hyland, C. Higbee, L. Remer, and C. Compton. 2007. The role of public policies in reducing smoking prevalence in California: Results from the California tobacco policy simulation model. Health Policy 82(2):167–185.
Levy, D. T., C. Tworek, E. J. Hahn, and R. E. Davis. 2008. The Kentucky SimSmoke tobacco policy simulation model: Reaching Healthy People 2010 goals through policy change. Southern Medical Journal 101(5):503–507.
Levy, D. T., S. I. Cho, Y. M. Kim, S. Park, M. K. Suh, and S. Kam. 2010a. SimSmoke model evaluation of the effect of tobacco control policies in Korea: The unknown success story. American Journal of Public Health 100(7):1267–1273.
Levy, D. T., A. L. Graham, P. L. Mabry, D. B. Abrams, and C. T. Orleans. 2010b. Modeling the impact of smoking cessation treatment policies on quit rates. American Journal of Preventive Medicine 38(3S):S364–S372.
Levy, D., L. M. de Almeida, and A. Szklo. 2012a. The Brazil SimSmoke policy simulation model: The effect of strong tobacco control policies on smoking prevalence and smoking-attributable deaths in a middle income nation. PLoS Medicine 9(11): e1001336.
Levy, D. T., R. G. Boyle, and D. B. Abrams. 2012b. The role of public policies in reducing smoking: The Minnesota SimSmoke tobacco policy model. American Journal of Preventive Medicine 43(5 Suppl 3):S179–S186.
Levy, D. T., K. Blackman, L. M. Currie, and U. Mons. 2013a. Germany SimSmoke: The effect of tobacco control policies on future smoking prevalence and smoking-attributable deaths in Germany. Nicotine & Tobacco Research 15(2):465–473.
Levy, D. T., L. Currie, and L. Clancy. 2013b. Tobacco control policy in the UK: Blueprint for the rest of Europe? European Journal of Public Health 23(2):201–206.
Levy, D., R. L. Rodriguez-Buno, T. W. Hu, and A. E. Moran. 2014. The potential effects of tobacco control in China: Projections from the China SimSmoke simulation model. BMJ 348:g1134.
Levy, D., K. Blackman, G. T. Fong, and F. Chaloupka (eds.). In press. The role of tobacco control policies in reducing smoking and deaths in the eighteen heavy burden nations: Results from the MPOWER SimSmoke tobacco control policy model. In National Cancer Institute monograph Tobacco control policies in low and middle income nations, edited by G. Fong, F. Chaloupka, and A. Yurekli. Rockville, MD: National Cancer Institute.
Lewit, E. M., D. Coate, and M. Grossman. 1981. The effects of government regulation on teenage smoking. Journal of Law and Economics 24(3):545–569.
Lilienfeld, A. M. 1980. Advances in quantitative methods in epidemiology. Public Health Reports 95(5):462–469.
Matthews, T. J., and M. F. MacDorman. 2013. Infant mortality statistics from the 2010 period linked birth/infant death data set. National Vital Statistics Reports 62(8):1–26.
McMahon, P. M., R. Meza, S. K. Plevritis, W. C. Black, C. M. Tammemagi, A. Erdogan, K. ten Haaf, W. Hazelton, T. R. Holford, J. Jeon, L. Clarke, C. Y. Kong, S. E. Choi, V. N. Munshi, S. S. Han, J. van Rosmalen, P. F. Pinsky, S. Moolgavkar, H. J. de Koning, and E. J. Feuer. 2014. Comparing benefits from many possible computed tomography lung cancer screening programs: Extrapolating from the National Lung Screening Trial using comparative modeling. PLoS ONE 9(6):e99978.
Melvin, C. L., E. K. Adams, and V. Miller. 2000. Costs of smoking during pregnancy: Development of the Maternal and Child Health Smoking Attributable Mortality, Morbidity and Economic Costs (MCHSAMMEC) software. Tobacco Control 9(Suppl 3):iii12–iii15.
Meza, R., W. D. Hazelton, G. A. Colditz, and S. H. Moolgavkar. 2008. Analysis of lung cancer incidence in the Nurses’ Health and the Health Professionals’ Follow-Up Studies using a multistage carcinogenesis model. Cancer Causes and Control 19(3):317–328.
Meza, R., K. ten Haaf, C. Y. Kong, A. Erdogan, W. C. Black, M. C. Tammemagi, S. E. Choi, J. Jeon, S. S. Han, V. Munshi, J. van Rosmalen, P. Pinsky, P. M. McMahon, H. J. de Koning, E. J. Feuer, W. D. Hazelton, and S. K. Plevritis. 2014. Comparative analysis of 5 lung cancer natural history and screening models that reproduce outcomes of the NLST and PLCO trials. Cancer 120(11):1713–1724.
Moolgavkar, S. H., T. R. Holford, D. T. Levy, C. Y. Kong, M. Foy, L. Clarke, J. Jeon, W. D. Hazelton, R. Meza, F. Schultz, W. McCarthy, R. Boer, O. Gorlova, G. S. Gazelle, M. Kimmel, P. M. McMahon, H. J. de Koning, and E. J. Feuer. 2012. Impact of reduced tobacco smoking on lung cancer mortality in the United States during 1975–2000. Journal of the National Cancer Institute 104(7):541–548.
Orzechowski, W., and R. C. Walker. 2012. The tax burden on tobacco: Historical compilation, Vol. 47, 2012. Arlington, VA: Orzechowski and Walker. http://www.taxadmin.org/fta/tobacco/papers/tax_burden_2012.pdf (accessed February 23, 2015).
———. 2013. The tax burden on tobacco: Historical compilation, Vol. 48, 2013. Arlington, VA: Orzechowski and Walker. http://www.taxadmin.org/fta/tobacco/papers/tax_burden_2013. pdf (accessed March 20, 2015).
Rosenberg, M. A., E. J. Feuer, B. Yu, J. Sun, S. J. Henley, T. G. Shanks, C. M. Anderson, P. M. McMahon, M. J. Thun, and D. M. Burns. 2012. Chapter 3: Cohort life tables by smoking status, removing lung cancer as a cause of death. Risk Analysis 32 (Suppl 1):S25–538.
Sprague, W. W. 2009. LCFIT: The Lee–Carter fitter (Web-based software for estimating the Lee–Carter method for modeling and forecasting mortality). http://lcfit.demog.berkeley.edu (accessed January 16, 2015).
Steyn, K., T. De Wet, Y. Saloojee, H. Nel, and D. Yach. 2006. The influence of maternal cigarette smoking, snuff use and passive smoking on pregnancy outcomes: The Birth to Ten Study. Paediatric and Perinatal Epidemiology 20(2):90–99.
Tong, V. T., P. M. Dietz, S. L. Farr, D. V. D’Angelo, and L. J. England. 2013. Estimates of smoking before and during pregnancy, and smoking cessation during pregnancy: Comparing two population-based data sources. Public Health Reports 128(3):179–188.
USCB (U.S. Census Bureau). 2013a. Annual estimates of the resident population by single year of age and sex for the United States, states, and Puerto Rico commonwealth: April 1, 2010 to July 1, 2012. http://factfinder.census.gov/faces/tableservices/jsf/pages/productview.xhtml?src=bkmk (accessed November 26, 2014).
———. 2013b. National estimates by age, sex, race: 1900–1979. https://www.census.gov/popest/data/national/asrh/pre-1980/PE-11.html (accessed November 26, 2014).
———. 2014. Methodology, assumptions, and inputs for the 2014 national projections. http://www.census.gov/population/projections/files/methodology/methodstatement14.pdf (accessed February 23, 2015).
van den Berg, G., M. van Eijsden, F. Galindo-Garre, T. G. Vrijkotte, and R. J. Gemke. 2013. Smoking overrules many other risk factors for small for gestational age birth in less educated mothers. Early Human Development 89(7):497–501.
Warner, K. 1989. Effects of the antismoking campaign: An update. American Journal of Public Health 79(2):144–151.
Warner, K. E., and H. A. Murt. 1983. Premature deaths avoided by the antismoking campaign. American Journal of Public Health 73(6):672–677.
WHO (World Health Organization). 2008. WHO report on the global tobacco epidemic, 2008: The MPOWER package. Geneva: World Health Organization.
———. 2013. WHO report on the global tobacco epidemic, 2013: Enforcing bans on tobacco advertising, promotion and sponsorship. Geneva: World Health Organization.
Zhang, K., and X. Wang. 2013. Maternal smoking and increased risk of sudden infant death syndrome: A meta-analysis. Legal Medicine 15(3):115–121.


