
2
Population Aging in a
Heterogeneous Society
POPULATION AGING IN THE UNITED STATES
Populations around the world are aging as the effects of low fertility and increasing longevity reduce population growth rates at younger ages, while growth accelerates at older ages. This process is also occurring in the United States: U.S. life expectancy rose by 32 years from 1900 to 2012, and fertility has remained near or below the replacement level of 2.1 births per woman since the mid-1970s. For decades, the large baby boom generations kept the population relatively young, but now they are moving into older ages and will usher in rapid population aging over the coming decades. The growth rate of the labor force has slowed from 2.7 percent per year in the 1970s to 0.7 percent for 2000 to 2009, despite rising rates of immigration, and is expected to be close to 0.5 percent in coming decades.
Looking to the future, it seems likely that fertility will rebound from the lows that have been associated with the recent recession, but if instead it remains near 1.9, then future aging would deepen. As for life expectancy, the Phase I report (National Research Council, 2012, henceforth “the 2012 report”) foresees it rising steadily to 84.5 years in 2050, over 1.6 years more than assumed in the 2014 Social Security Trustees Report (Board of Trustees, Federal Old-Age and Survivors Insurance and Federal Disability Insurance Trust Funds, 2014).1
________________
1Although immigration also affects population aging, this effect is weaker than is sometimes suggested. For example, the old-age dependency ratio (defined as the population aged 65 and older, relative to the population aged 20 to 64) is projected in the 2012 report to rise from about 0.20 in 2010 to 0.39 in 2050. To reduce that by 10 percent (from 0.39 to 0.35) would
Because of its history of higher fertility, the U.S. population will age less than populations of other rich industrial nations in Europe and East Asia. While U.S. fertility has been near replacement in recent decades, fertility in Europe and Japan has been a half child lower, on average (around 1.6), with some countries temporarily in the 1.0-1.2 range. The 2012 report projected global population aging with the population of each country weighted by its projected level of per capita income. The U.S. old-age dependency ratio is projected to be close to the global average in 2010 and 2050 but higher in the intervening years. The 2012 report noted that the more rapid aging in the rich countries should lead to international flows of capital from them to younger, lower-income countries.
The macroeconomic and fiscal effects may be very different depending on whether the years of life gained as mortality falls are healthy, vigorous years or frail years with chronic illness and need for personal care. The prevalence of disability at older ages declined between 1980 and 2000, but it appears that since 2000 the decline ended for those aged 65 to 85, and there was actually an increase in disability at ages 40 to 64 (Freedman et al., 2004; Schoeni et al., 2008; Seeman et al., 2010). This clouds the outlook for the coming decades. Nonetheless, the earlier declines mean that older people generally are in better health than before. For example, the 2012 report (p. 90) notes that the self-reported health of a 69-year-old in the 2000s is similar to that of a 60-year-old in the 1970s.
WHY POPULATION AGING HAS IMPORTANT ECONOMIC CONSEQUENCES
The macroeconomic consequences of aging depend in part on consumption and saving responses and in part on labor supply. One simple metric with which to evaluate the impact of population aging on consumption comes through the weighted support ratio of hypothetical earners to hypothetical consumers; roughly speaking, this ratio provides a proxy for the earnings capability of workers relative to society’s consumption needs.2 The weighted support ratio for the United States is projected to decline by 12 percent between 2010 and 2050. Other things being equal, this would mean that total consumption would need to be 12 percent lower in 2050
________________
require 1 million additional net immigrants each year between now and then. To achieve this change through higher fertility would require an additional half child per woman. Probabilistic projections in the 2012 report (pp. 56-59) indicate that it is virtually certain that there will be substantial population aging by 2050, and there is only a 1 in 40 chance that the old-age dependency ratio will rise less than 60 percent by 2050.
2Hypothetical earners are the weighted sum of labor income by age in some base period multiplied by the population age distribution in a given year, and hypothetical consumers are similarly defined (see Cutler et al., 1990).
than otherwise, or equivalently that consumption would grow about 0.3 percent per year less rapidly than otherwise. Changes in labor supply could offset part of this effect by changing the support ratio itself.
With no changes in labor supply, population aging tends to raise the share of national output devoted to support of the elderly so long as their per capita consumption does not decline relative to the rest of the population. Estimates of consumption by the elderly reported in the 2012 report (p. 48, Figure 3-10) show that relative per capita consumption by the elderly did not decline relative to the non-elderly during the period 1960 to 2007. Indeed, instead of declining, elderly per capita consumption relative to the non-elderly increased dramatically during that time period. For example, consumption by an 80-year-old relative to a 20-year-old doubled from 1960 to 2007. The biggest relative increase was in public expenditures on health care, but increased private expenditures on health care and increased other private consumption at older ages also contributed. The estimates in the 2012 report include both private household expenditures (allocated to individual household members) and public in-kind transfers. They do not include government cash transfers, because these are not necessarily consumed, and if consumed they would then be double counted, showing up also in private consumption expenditures.
The age profiles of U.S. consumption shown in Figure 3-10 of the 2012 report and others for intermediate years can be multiplied by the population age distribution of each year and summed to find total aggregate consumption by the elderly aged 65 and above. This aggregate elder consumption can then be expressed as a share of total consumption, which is shown here in Figure 2-1. In 1960, elder consumption was 9.4 percent of total consumption; this share grew roughly linearly, pausing in the 1990s, to a level of 18.9 percent in 2011, double the 1960 share. Over this same period, the percentage share of the elderly in the population rose from 9 percent in 1960 to 13 percent in 2010, an increase of 45 percent, and is projected to rise to 21 percent by 2050 (Board of Trustees, Federal Old-Age and Survivors Insurance and Federal Disability Insurance Trust Funds, 2014). Evidently both population aging and the tilt in the age profile of consumption contributed to this increased share of aggregate consumption, and these two demographic pressures will intensify in the coming decades. If the age profile of consumption has the same shape in 2050 as it does today, then with the projected population age distribution of 2050, the elder share of consumption will increase further to 29.8 percent. Similar committee calculations for the aggregate share of elder consumption in gross domestic product (GDP) found that it more than doubled between 1960 and 2011 from 6.8 percent to 16.0 percent.
One potential response that would mitigate these effects is longer work lives, which would attenuate the change in the support ratio as the popula-
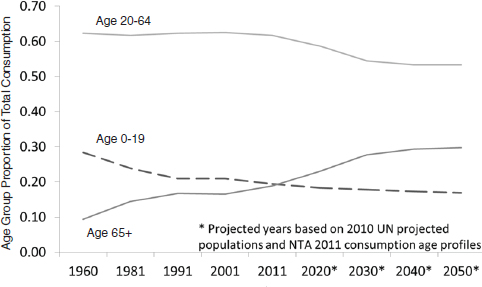
FIGURE 2-1 Share of total U.S. consumption for three age groups, 1960-2050.
SOURCE: Ronald Lee and Gretchen Donehower, personal communication to the committee, August 2014, using United Nations (UN) data and data from the National Transfer Accounts (NTA) project; see Lee and Mason (2011, Chapter 9) for details and methods.
tion ages. There is significant potential for such increases in working lives. In particular, although disability rates rise strongly with age, health is not the main limitation on work at older ages for most workers. More than half of males aged 65 to 69 who are not working have no health impairment, as do half of those aged 70 to 74. Based on data from 2000 to 2003, labor force participation could have been about 50 percent higher than it was for males who completed high school or less, and also for those with any college (2012 report, p. 91). The 2012 report (pp. 90-93) also included projections of the potential labor force aged 20 to 74, incorporating trends in age, education, occupation, ethnicity, obesity, diabetes, and other major and minor impairments. These projections indicate that if disability rates for each characteristic stay the same, then the proportion able to work will also stay approximately the same through 2050, despite population aging. The implication is that there is considerable room for older people to postpone retirement, should they so choose.
Another dimension of the effects of population aging is its impact on the federal budget through the major U.S. entitlement programs. Policy
makers have long recognized the need for entitlement reform in the face of an aging population and rising health care costs per beneficiary. The Congressional Budget Office (CBO), in its 2014 Long-Term Budget Outlook, estimates that without policy changes, federal debt will rise from 74 percent of GDP at the end of 2014 to 106 percent at the end of 2039. During that period, Social Security spending is projected to rise from 4.9 percent of GDP to 6.3 percent, while Medicare, Medicaid, and other health expenditures by the federal government are projected to rise from 4.9 percent of GDP to 8.0 percent (Congressional Budget Office, 2014a).
As the CBO (2014a, p. 5) notes:
[T]he unsustainable nature of the federal tax and spending policies specified in current law presents lawmakers and the public with difficult choices…. To put the federal budget on a sustainable path for the long term, lawmakers would have to make significant changes to tax and spending policies: reducing spending for large benefit programs below the projected levels, letting revenues rise more than they would under current law, or adopting some combination of those approaches.
This report delves neither into detail on the underlying causes of the nation’s long-term fiscal gap nor into the wide array of policy options available for addressing it (see Box 2-1 for a consideration of potential Medicare reforms). These topics have been amply covered elsewhere. Instead, the committee’s focus is on the causes of the growing historical and projected gap in life expectancy among people with different long-term earnings histories, the effects of that growing gap on the distribution of benefits under the major entitlement programs, and the implications of the growing gap for some possible policies to address the fiscal sustainability problem. These issues would be important topics even if the nation’s long-term fiscal imbalance did not exist.
INDIVIDUAL HETEROGENEITY IN AN AGING POPULATION
In the context of a population that is aging and the need for entitlement reform, a core focus of this report is on the growing heterogeneity in life expectancy by socioeconomic status. This heterogeneity is important because the demography and behavior of various groups within the population can potentially affect the aggregate numbers. Similarly, those groups can be affected by a change in policy in vastly different ways. Different groups within the U.S. population have systematically greater chances of living longer than others, with important implications for policies whose impacts depend on the number of years lived. This aspect of heterogeneity, the relation of mortality to socioeconomic status, is known as the “mortality gradient.”
BOX 2-1
Medicare Reform
Despite recent slowdowns in spending growth, Medicare spending is still of great concern for policy. The Congressional Budget Office (CBO) projects that—without policy intervention—Medicare will account for 5.7 percent of GDP by 2035 (Congressional Budget Office, 2014a). The increase in Medicare spending, which currently accounts for 14 percent of federal outlays, is a major factor in projected growth of the national debt. The Patient Protection and Affordable Care Act of 2010 (Affordable Care Act) introduced a number of policy changes to constrain Medicare cost growth. The CBO’s analysis suggested the largest savings would come from reductions in payments to Medicare Advantage plans (private plans that have historically received more funding per enrollee than traditional fee-for-service Medicare) and reductions in annual payment increases for certain types of providers, including hospitals. A problem with such reimbursement rate reductions is that some studies suggest that lower provider fees may increase the volume of services provided and also cause private payers to raise their prices, reducing the efficacy of these policies as a cost containment option over the long term (see, e.g., Nguyen and Derrick, 1997). The CBO (2007) has estimated that a decline in physician payment rates that generate a $1,000 decline in physician revenues per year would cause physicians to boost volumes or intensity sufficiently to offset $280 of that decline. Other research, however, does not support these estimates (e.g., White, 2013).
Perhaps more importantly, the Affordable Care Act also included many changes (such as Accountable Care Organizations and bundled payments) intended to shift Medicare’s payment structure over time away from fee-for-service reimbursement. Some observers have argued that, without policies that fundamentally change Medicare’s payment structure, Medicare expenditure growth will be difficult to contain over time (Holtz-Eakin and Ramlet, 2010; Orszag and Emanuel, 2010).
Although actual and projected life expectancy has continued to rise in recent decades, the gains have been different for different population subgroups, as this report explores in Chapter 3. Women have higher life expectancy than men, but their rate of increase in life expectancy has fallen well below that of men, probably because of delayed effects of their later uptake of smoking (National Research Council, 2011). Hummer and Hernandez (2013, p. 6) note that a number of studies have been carried out using data since the 1980s, and they summarize the results as follows:
Even with a variety of data sets and methodological approaches, all arrived at the same general and important conclusion: Educational differences in mortality and life expectancy have widened over the past 20 to 25 years.
In fact, age-specific mortality rates among black and white women who did not complete high school actually increased over the past two decades. Moreover, the pace of mortality decline has been steepest among highly educated individuals in most age, sex, and racial/ethnic groups.
Waldron (2007) and Bosworth and Burke (2014) analyzed gains in life expectancy by decile of lifetime earnings and found, as summarized in the latter, “life expectancy is rising for those at the top of the distribution of individuals ranked by alternative measures of socio-economic status, but it is stagnant or falling for those at the bottom” (Bosworth and Burke, 2014, p. 16).
The social science literature features several well-known and complementary approaches for measuring population health and projecting future disease burden and mortality (see, for example, Manton et al., 1993; Lee, 2000; Hayward and Warner, 2005). Perhaps not surprisingly, the models display an underlying trade-off between data complexity and the applicability of the model. For example, early life-table approaches such as those of Sullivan (1971) require only age-specific population data and disability rates at those ages; these elements are all present in cross-sectional data. The straightforward data requirements, however, come at a cost, because the Sullivan method appears too insensitive to large changes in disability and mortality and may thus underestimate future trends in population health (Bonneux et al., 1994). Multistate life-table models and microsimulation models that exploit longitudinal data can accommodate richer dynamics than Sullivan’s method and thus provide more flexibility in modeling the dynamic interplay between morbidity, disability, and mortality. Such dynamic models obtain population health trends as aggregates from individual stochastic processes underlying these outcomes.
To explore the fiscal and distributional consequences of changes in mortality and longevity, the committee needed a model that links health and mortality to economic outcomes across socioeconomic strata and that could track economic outcomes across individuals. After exploring several possible options (see Box 2-2), the committee decided that the Future Elderly Model (FEM) was well suited to its purpose. The primary benefit of the FEM was that it was capable of examining mortality heterogeneity and estimating the impact on major entitlement programs such as Medicare, Medicaid, and Social Security. The FEM, a microsimulation model developed and maintained by the Roybal Center for Health Policy and Economics at the University of Southern California, tracks representative cohorts of Americans over age 50 to project their health status and economic
BOX 2-2
Choice of the FEM Model
The committee considered a number of approaches to implementing the experimental simulations, as summarized below.
- Congressional Budget Office Long Term (CBOLT) is a microsimulation program developed and used by the Congressional Budget Office (CBO). The Phase I committee had looked into using this program for its work but received a discouraging response from CBO staff to the effect that they would not have the time needed to tailor the model for the committee’s purposes. The Phase II committee also made inquiries and concluded that it would not have access to the CBOLT model. Therefore, although CBOLT appeared to be a suitable platform for the experimental simulations needed for this report, it was not available for that purpose.
- Modeling Income in the Near Term (MINT) is a microsimulation program developed and used by the Social Security Administration. It has many but not all of the capabilities that were needed for the experimental simulations. For instance, it supports simulation of taxes and of Old-Age, Survivors, and Disability Insurance benefits, Supplemental Security Income benefits, Medicare and Medicaid eligibility, and out-of-pocket expenses, but unfortunately MINT does not include simulation of actual Medicare and Medicaid benefits received.
- The Tax Policy Center model (committee member William Gale codirects the Tax Policy Center) was considered, but it did not solve the need to estimate individual earnings trajectories before age 50.
- Because it was not feasible to use either CBOLT or MINT, the committee considered use of a macrosimulation approach derived from National Transfer Accounts methods (a project codirected by Ronald Lee, cochair of the committee), in which tax and benefit age profiles would be estimated for long-term earnings quintiles in a recent base year and then these profiles would be projected forward. The committee viewed macrosimulation as a second-best approach to the approach using the Future Elderly Model (FEM).
- The committee learned of the capabilities and workings of the FEM from committee member Dana Goldman, director of the Future Elderly Model project. A FEM capability of particular appeal to the committee was that, in addition to detailed modeling of health state transitions and use of Medicare, Medicaid, and Disability Insurance programs, it also included non–health-related benefits such as Social Security retirement benefits. After confirming that the model could carry out the required simulations and calculations, the committee decided to use the FEM for the experimental simulations.
outcomes. Developed with funding from the Centers for Medicare & Medicaid Services, the National Institute on Aging, the Department of Labor, and the MacArthur Foundation, the FEM is a well-established simulation model,3 and has a wide variety of policy uses. It has been used to investigate the economic consequences of delaying disease and disability (Goldman et al., 2013), the costs of obesity in older Americans (Lakdawalla et al., 2005), future disability trends (Chernew et al., 2005), fiscal consequences of worsening population health (Goldman et al., 2010), the costs of cancer (Bhattacharya et al., 2005), the health and economic value of preventing disease after age 65 (Goldman et al., 2006), the value of cardiovascular risk reduction (Goldman et al., 2006, 2009), long-term health outcomes from medical innovation (Lakdawalla et al., 2009; Goldman et al., 2005), the health consequences of price controls (Lakdawalla et al., 2009), and the financial risk in Medicare spending from new medical technologies (Goldman et al., 2005).
The committee worked with the FEM staff to refine or extend certain aspects of the model to carry out the specific analytic tasks required for the committee’s work. For a detailed description of the FEM methodology and assumptions, see Appendix B and the accompanying Excel workbook, which are available to download at nap.edu/GrowingGap under the Resources tab.
Overview
At its core, the FEM is well equipped to analyze the effect of longevity gaps on public support, because it allows for complex interactions between multidimensional measures of health and economic outcomes; this was a key reason the committee chose to use the FEM. The model was used to estimate and project a set of average outcomes given the policy environment that persisted over the period for which data were observed; within that policy environment, we then focus on how a change in the mortality gradient affects outcomes under Medicare, Medicaid, Social Security, and other entitlement programs.4 It is important to note that the FEM takes a “reduced-form” approach. That is, it does not directly model the behavioral
________________
4The period of observation varies somewhat with the outcome and the data source, but it is most usefully thought of as the last decade prior to the introduction of the Affordable Care Act.
3Further information on the FEM may be found at https://roybalhealthpolicy.usc.edu/fem/ [August 2015].
response to policy changes; a reduced-form approach makes full welfare calculations infeasible.5
The FEM takes a cohort of Americans at age 50—each of whom has a measure of lifetime income and an initial health status—and simulates their lifetime net benefits in a baseline scenario. The model starts in 2010 with the policy environment observed in that year and assumed to persist throughout the simulation.6 The model is run biennially until everyone in the cohort has died, and lifetime benefits and other outcomes are tracked. The model also generates taxes paid at age 50 and thereafter; the present value of these taxes are subtracted from the present value of benefits to generate a “net benefit.” As discussed further below, this “net benefit” is not a full measure of the net benefits from the relevant programs because the measure, out of necessity given the structure of the FEM, does not include taxes before age 50. The committee had for this reason originally focused on benefits alone. Because we focus mostly on how net benefits change when the mortality gradient changes, rather than the level of such net benefits, including taxes paid at age 50 and beyond does not fundamentally alter any of the key findings of this report relative to studying benefits by themselves.7 For that same reason, including taxes paid before age 50, even if that were feasible within the FEM, would have almost no effect; if the focus is how mortality changes after age 50 affect net benefits, then including taxes paid before age 50 would have no effect. (In other words, including taxes paid before age 50 would affect the level of lifetime net benefits but would not have any appreciable effect on the change in those lifetime net benefits as mortality after age 50 changed.) Appendix B is a comprehensive and technical appendix with model details and is available online as noted above; within the body of the report, the committee provides only the most salient details.
________________
5To do such calculations, economists would typically rely on so-called “structural” approaches that explicitly model utility and economic behavior in response to policy changes. These models often make many simplifying assumptions to maintain tractability and necessarily lose some of the diversity about individual health and outcomes available in the FEM. A useful example of a structural approach can be found in Rust and Phelan (1997). An annex to Chapter 5 provides further discussion of the reduced form and structural approaches.
6It is not feasible to try to predict policy outcomes throughout the simulation, which can run for more than 50 years into the future.
7Also, taxes paid at and after age 50 finance all government activities, not just the programs considered here. These computations establish a baseline scenario against which other scenarios can be compared, such as: (1) what would happen if mortality differences changed by income group, or (2) what would happen if program eligibility or benefits changed.
Assigning an Earnings Quintile
The FEM classifies respondents in the Health and Retirement Study (HRS) based on their Social Security earnings histories. The analyses in this report used an earnings measure similar to that of Waldron (2007, 2013) and Bosworth and Burke (2014): the average of a respondent’s nonzero earnings between the ages of 41 and 50.8 For households with two individuals, following Bosworth and Burke (2014), we divided the total household earnings by the square root of 2 to reflect economies of scale in consumption and assigned this value to both individuals in the household. The Social Security earnings records file we used begins in 1951. Thus we could only construct the earnings measure for individuals born in 1910 or later. For those unobserved, we imputed the household earnings measure. Respondents are then classified into earnings quintiles by birth decade and gender.
Measuring Initial Health of the Age 50 Cohorts
There are important differences in the underlying health status of various cohorts of the same age. As noted earlier, although some research has shown improved health and disability among Americans aged 65 and over, the same improvements have not been found among the population aged 40 to 64 (Reynolds et al., 1998; Lakdawalla et al., 2004; Martin et al., 2010a, 2010b). This report relies on predicted outcomes for various cohorts of 50-year-olds; thus, the committee sought to account for these observed differences. The FEM contains an initial-cohorts module to calibrate data from the HRS to population trends observed in the National Health Interview Study (NHIS). Use of this module allowed the committee to generate lifetime outcomes for a cohort of 50-year-olds starting in 2010, but assuming they had the health status of the cohorts born in 1930, 1960, or, in some scenarios, 1990. Table 2-1 describes the differences in cohorts with these different health status assumptions.
Estimating Mortality
Analysis of the effect of the mortality gradient on lifetime benefits requires the full association of mortality and lifetime income class without taking into account the health conditions that may lead to the mortality differentials. The committee conducted an exhaustive comparison of mortality predictions by earnings quintile using the literature summarized
________________
8Waldron (2007, 2013) used ages 45-55 rather than 41-50. She explains at length why measures of this sort are preferable to using average indexed monthly earnings (AIME) as defined by the Social Security Administration (see http://www.ssa.gov/oact/cola/Benefits.html and the discussion in Chapter 3).
TABLE 2-1 Future Elderly Model Assignment of Health Status and Risk Factors at Age 50 for Three Birth Cohorts
| Health Status at 50 | Risk Factors at 50 | |
| 1930 Birth Cohort | Heart disease, diabetes, and hypertension prevalences are assigned to match historic NHANES II (1976-1980) rates for 45- to 55-year-olds. | Smoking status and BMI are assigned to match historic NHANES II rates. |
| 1960 Birth Cohort | Standard FEM method based on trends in NHIS, NHANES, and the literature (see Appendix B) | Standard FEM method based on trends in NHIS, NHANES, and the literature (see Appendix B) |
| 1990 Birth Cohort | Standard FEM method based on trends in NHIS, NHANES, and the literature (see Appendix B) | Standard FEM method based on trends in NHIS, NHANES, and the literature (see Appendix B) |
NOTE: BMI = body mass index, FEM = Future Elderly Model, NHANES = National Health and Nutrition Examination Survey, NHIS = National Health Interview Survey.
in Chapter 3. We chose to employ a specification that captures this full association between earnings quintile and mortality. Thus, a 2-year mortality probit is specified as a function of age, a linear time trend, earnings quintile, and quintile-specific linear time trends. The model is fully interacted with gender.9 With age as the time scale, we adjusted the baseline hazard rate by birth year, earnings quintile, and the interaction of birth year and earnings quintile. Men and women were modeled separately. Overall, our model produced life expectancy values that are consistent with other forecasts. This estimation, which is independent of the FEM, was nonetheless tailored to provide the necessary mortality input for the FEM simulations.
Estimating Health Status
The FEM contains a transition module to calculate the probabilities of entering and exiting various health states and the likelihood of various financial outcomes. The module takes as inputs risk factors such as smoking, weight, age, and education, along with lagged health and financial states. This allows for a great deal of heterogeneity and fairly general feedback
________________
9In addition to modeling 2-year mortality incidence, we also explored modeling mortality parametrically using a Weibull survival model. Simulation results were similar between the two methods (2-year mortality incidence and Weibull survival model).
effects. The transition probabilities are estimated from the longitudinal data in the HRS. These probabilities are then used to simulate the path of individuals in the simulation. Appendix B contains details on the estimation of these probabilities and a goodness-of-fit exercise.
Estimating Health Care Spending
The committee estimated health expenditure using data from the Medical Expenditure Panel Survey and the Medicare Current Beneficiary Survey. We imputed earnings quintile for respondents in these two surveys using a model estimated on the HRS. This model includes the following variables: 5-year age category dummy, non-Hispanic black, education (less than a high school degree, completed high school degree, and at least some college), single, and widowed. The model is fully interacted by gender. As with mortality, we used reduced-form models for this report. Costs are estimated as functions of age, mortality, and earnings quintile. The models are fully interacted by gender (see the technical documentation in Appendix B for model estimates).
Estimating Benefits and Other Economic Outcomes
A policy-outcomes module aggregates projections about individual-level outcomes into policy outcomes such as taxes, medical care costs, pension benefits paid, and disability benefits. This component takes account of public and private program rules to the extent allowed by the available outcomes. Because the committee had access to HRS-linked restricted data from Social Security records and employer pension plans, we were able to model retirement benefit receipt. We calibrated our 2004 projections on administrative aggregates to ensure that totals matched those figures. Labor force participation, Social Security claiming for old-age and survivor benefits, and disability insurance receipt are specified in ways similar to mortality. Briefly, we replaced demographic variables with earnings quintile, interacted with gender. The lagged state-of-health-related variables are included in the transition models. Instead of age, we included yearly dummy variables for age relative to Social Security’s normal retirement age to allow policy changes to influence labor force and program participation.
The committee would have liked to calculate the net present value of net government benefits by lifetime earnings, but we lacked information on tax payments before the age of 50. For individuals with earlier earnings records, perhaps taxes could be imputed, but for many the earnings histories did not reach back far enough. Out of necessity, the committee therefore opted to compute a “net benefit” calculation that only includes taxes paid at age 50 and older. The results, in terms of the effect of differential mor-
tality, are not substantially affected if the analysis is instead focused solely on the present value of lifetime benefits received, excluding all taxes paid. Furthermore, even if it were feasible to include taxes paid before age 50, it is unlikely that doing so would have much if any effect on the principal focus, which is how differential mortality trends have changed the present value of net benefits by earnings categories. Such differential trends should have only minimal effects across earnings categories on taxes paid before age 50, so whether such taxes are excluded (as they are here, out of modeling necessity) or included should have little if any effect on the results.
In summary, we are not able to calculate the full generational accounts for each generation under the different mortality regimes and policy scenarios, as was done by Auerbach and colleagues (1991), because we lack taxes paid before age 50. We were, however, able to calculate the generational account for benefits, which is the present value of survival-weighted benefits, or lifetime benefits for short. Because most mortality occurs at older ages, the mortality differences by lifetime income are unlikely to have much effect on survival-weighted lifetime earnings in any case.
Another perspective on the same point is that the generational account by income quintile is the present value of survival-weighted benefits over the adult years, say after age 18, minus the present value of survival-weighted tax payments. The committee was not able to calculate these generational accounts because we lacked data for taxes before age 50 (along with information about benefits before that age, for that matter). However, our interest is in the way changes in mortality by income quintile lead to changes in the generational accounts. Because mortality is low in the young adult years and rises very rapidly thereafter, the vast majority of the changes in mortality from cohort to cohort will affect survival after age 50. For this reason, although we are not able to estimate the actual generational accounts, we can estimate a close approximation to the changes in these accounts that are due to changes in mortality by looking at the effect on benefits of changes in mortality after age 50 minus the effect on taxes of changes in mortality after 50.
Estimating Taxes and Net Benefits
The FEM accounts for the most important sources of income for both individuals and the federal government. In particular, the income tax and the payroll tax account for 80 percent of federal revenue (Center on Budget and Policy Priorities, 2015), and these are accounted for in the simulation. Missing from the tax calculations of federal revenue are the corporate income tax (11%) and another 9 percent in miscellaneous taxes—mainly estate taxes and excise taxes paid when purchases are made on specific goods, such as alcohol or gasoline. For individuals, taking into account all
the sources we model including Medicare and Medicaid, the FEM accounts for approximately 82 percent of before-tax income.10 Missing from the income calculations are capital gains (9%) and some sources of business and other income.
The FEM calculates income—both work and in-kind—from three general sources:
- Work income is computed as income from any of the following sources: wages, salaries, bonuses, overtime pay, commissions, tips, second job or military reserve earnings, professional practice or trade income, or self-employment income. It is first modeled as a probit regression for whether a person is working for pay (estimates are in Table 32 of the Excel workbook). If the person is working, then his or her earnings are modeled using the inverse hyperbolic sine—with suitable retransformation—to account for the skewed distribution (the transformation is discussed in Section 4.1 of Appendix B, and estimates are presented in Table 14 of the Excel workbook). Because pension income is an important source of income for older individuals, it is modeled separately. A probit regression models whether or not a person is receiving any pension income from all sources. If the person is claiming a pension, then this income is added to earnings for the purposes of computing taxes.
- Government income transfers include income from the three largest income transfer programs: Social Security, Disability Insurance, and Supplemental Security Income. The model first estimates claiming behavior for each; that is, whether the person has any income from any of these programs. The levels of benefits are then computed in different ways for each program. Social Security and Disability Insurance benefits are computed using algorithms based on the estimated AIME and quarters worked, both of which are derived from simulated and actual work histories. For Supplemental Security Income, benefits for those who claim it are $350/month for those aged 65 and older and $450/month for those under age 65.
________________
10This estimate is based on 2011 data from a CBO (2014b) report on the distribution of household income and federal taxes. Note there is some uncertainty about this estimate for several reasons. First, CBO looks at in-kind transfers, especially Medicare and Medicaid. Second, 7 percent of before-tax income is classified as “other income” by CBO and 6 percent is classified as “business income.” Some “business income” is captured by HRS questions on self-employment income. Some “other income” is also captured by HRS categories such as annuities. Thus, the HRS measures we use cover between 76 percent and 89 percent of income; we use the midpoint. Another way to put this is that capital income is only 8 percent of before-tax income, and that is the big category we omit.
- Government in-kind transfers include Medicare and Medicaid. Transfers are computed using the data sources noted previously. Medicare spending includes government spending for Parts A, B, and D. For Parts B and D, the model estimates enrollment using a probit as a function of demographics, health status, earnings, and program participation. For those who enroll, a linear model is used to estimate covered health spending. For Medicaid, eligibility is computed as a function of age, gender, and earnings; the level of spending is computed in a similar manner for Parts B and D.
We then compute the two major sources of federal revenue:
- Income taxes are computed using policies summarized by OECD (2005). Couples are assumed to file jointly, and deductions are based on marital status and age. Social Security benefits are partially taxed, with the taxable amount increasing with other income from 50 percent to 85 percent. Low-income elderly have access to a special tax credit, and the earned income tax credit is applied for individuals younger than 65.
- Payroll taxes are computed based on the nonpension portion of labor income, following the tax rules currently in place. For Old-Age, Survivors, and Disability Insurance, both the employer and employee contribution are computed as 6.2 percent of earnings up to the earnings cap. For Medicare, both the employer and employee tax (1.45%) are applied to all earnings, with an additional 0.9 percent paid by the employee for nonpension income above a certain threshold as authorized by the Affordable Care Act.
Net Benefits in a given year are computed as benefits less taxes paid. Benefits include government income transfers (Social Security, Disability Income, and Supplemental Security Income) and government in-kind transfers (Medicare and Medicaid). Taxes paid include income and payroll taxes. For lifetime computations, all benefits and taxes are discounted by 2.9 percent annually.
Estimating Progressivity
The committee was charged, among other tasks, with analyzing how the “growing gaps in income and life expectancy affect national public programs such as Social Security, Medicare, and Medicaid.” To do so requires some measure of how gaps in income and life expectancy affect benefits under those programs. The committee was also charged with construction
of estimates “by lifetime income or education for different population cohorts under different policy regimes.”11
These assignments require some measure of lifetime net benefits from programs such as Social Security, Medicare, and Medicaid. The literature on Social Security commonly includes such estimates; estimates of Medicare have been more infrequent; those involving Medicaid are rarer still. Within the Social Security literature, Smith et al. (2003) examine the lifetime present value of Old-Age and Survivors Insurance benefits, while dividing individuals into groups based on various measures of lifetime earnings. Liebman (2002) constructs expected lifetime benefits under Social Security between ages 60 and 100 and then divides beneficiaries into groups based on lifetime earnings. Hurd and Shoven (1983) similarly compute the expected present value of benefits minus the present value of payroll taxes over a lifetime. The committee concluded that assessing the impact of changes in life expectancy on programs such as Social Security similarly required an estimate of lifetime net benefits.
The question then became how changes in lifetime net benefits should be assessed across income or education categories. Multiple methodologies exist for evaluating such a concept of “progressivity.” The committee came to the conclusion that the most insightful such measure reflects the ratio of program net benefits to a broad measure of wealth, because that broad measure represents the resources available for consumption or other purposes (including bequests). The proportion of net benefits to such wealth provides a proxy for how important the net benefits are to those available resources. Thus, if program net benefits as a share of wealth rise more for lower earners than higher earners, we say the change is “progressive” and if the reverse is true, the change is “regressive.” Our broad measure of wealth combines assets at age 50 in the HRS, the present value of projected earnings (net of taxes) after age 50, and the present value of projected total benefits received after age 50. Total benefits include Medicare, Medicaid, Social Security Retirement, Supplemental Security Income, and Disability Insurance.
Conducting Simulations
Several thought experiments undergird many of the estimates presented in this report. The FEM takes a cohort of Americans at age 50—each of
________________
11The charge was to construct generational accounts differentiated by lifetime income or education for this purpose. Because the committee concluded that the FEM was the most appropriate model for purposes of the study task but that model lacks taxes paid before age 50, the committee was not able to construct full generational accounts. The report’s measure of lifetime net benefits was the best we could do under the modeling constraints the committee faced.
TABLE 2-2 Summary Characteristics of Policy Simulations in Chapter 5
| Social Security (SS) | Medicare | ||||
| Scenario | Early Entitlement Age (EEA) | Normal Retirement Age (NRA) | Primary Insurance Amount (PIA) | Other | Eligibility Age |
| Baseline scenario | 62 | 67 | Current SS Policya | 65 | |
| Exp. 1: Increase EEA to 64, keep NRA at 67 | 64 | 67 | Current SS Policy | 65 | |
| Exp. 2: Keep EEA at 62, increase NRA to 70 | 62 | 70 | Current SS Policy | 65 | |
| Exp. 3: Increase EEA to 64, increase NRA to 70 | 64 | 70 | Current SS Policy | 65 | |
| Exp. 4: Superlative | 62 | 67 | Current SS Policy | After age 62, annual SS benefits are reduced by 0.2% in real terms | 65 |
| Exp. 5: Reduce the highest PIA factor by 1/3 | 62 | 67 | PIA = 0.90*MIN(AIME, BP1) + 0.32*MAX(0, MIN(AIME, BP2) - BP1) + 0.1*MAX(0, AIME-BP2) | 65 | |
| Exp. 6: Lower the second bend point in the PIA calculation and remove benefits above it | 62 | 67 | PIA = 0.90*MIN(AIME, BP1) + 0.32*MAX(0, MIN(AIME, BP2) - BP1) where BP2 is the median AIME | 65 | |
| Exp. 7: Raise the Medicare eligibility age to 67 | 62 | 67 | Current SS Policy | 67 | |
aUnder current SS policy, PIA = 0.90*MIN(AIME, BP1) + 0.32*MAX(0, MIN(AIME, BP2) - BP1) + 0.15*MAX(0, AIME-BP2), where BP1 and BP2 are the bend points from SS policy.
whom has a measure of lifetime income and an initial health status—and simulates their projected lifetime net benefits12 in the baseline scenario. The model starts in 2010 with the policy environment observed in that year, which is assumed to persist throughout the simulation. The model was run biennially until everyone in the cohort had died. The committee then examined three types of scenarios:
- Change mortality risks. Here the committee asked how lifetime net benefits change if the same cohort faced the mortality profile of an earlier or later generation.13 For example, for the cohort of Americans born in 1960—who reached age 50 in 2010—we asked, “How would lifetime net benefits change if these 50-year-olds faced the mortality risks of those born 30 years earlier?” These scenarios isolate the impact of mortality trends on this cohort, which are then reported and compared across earnings groups.
- Change federal policy rules. The committee then asked how salient changes in policies surrounding Social Security—and to a lesser extent Medicare—would impact lifetime outcomes. For example, we asked, “How would changing the normal retirement age for Social Security affect lifetime net benefits?” The results are then reported and compared by earnings group. The policy experiments are summarized in Table 2-2.
- Interactions between policy scenarios and mortality changes. One interest of the committee was whether plausible policy changes could offset the impact of the changes in mortality differentials on the pattern of lifetime benefits, if policy makers chose to do so. For this purpose, we assessed to what extent a policy change would reduce or augment the lifetime generosity of net benefits by earnings group.
________________
12The committee modeled the major benefits programs: Social Security (each of disability and old-age and survivor), Medicare, Medicaid, and Supplemental Security Income.
13We also allowed the initial health of the 50-year-olds to change because observed health conditions and behaviors are driving these differences. Additional analysis made it clear that the results are not driven by the observed changes in morbidity, and so we focus on mortality in this report.


