
According to many studies, life expectancy has been rising fastest for people with higher education or income, so the gap in longevity by socioeconomic status has been increasing. This trend is important in itself, but it also means that higher-income people will increasingly collect government benefits such as Social Security over more years than will lower-income people. It also means that some proposed policy changes to make programs fiscally sustainable, such as raising the normal retirement age for Social Security or raising the eligibility age for Medicare, might disproportionately affect those with lower incomes.
These topics are discussed in this report. The study first reviews the literature on differences in longevity by education and by income and on trends in these differences; the committee then constructs some new estimates of our own. Next the report discusses the conceptual background for these issues and why they are important. We go on to evaluate the way that the widening income differences in mortality affect the value of net lifetime benefits for different income groups from Social Security retirement and spousal benefits, Disability Insurance, Survivors Insurance, Medicare, Medicaid, and Supplemental Security Income. Finally, we consider how the differential changes in mortality would affect analyses of some possible reforms to government programs for the elderly in the face of population aging. We consider the consequences of policies such as raising the earliest eligibility age and the normal retirement age under Social Security, raising the age of eligibility for Medicare, basing the cost-of-living adjustment on a different kind of consumer price index, and changing the formula for how benefits are calculated for higher-income beneficiaries.
Life expectancy has risen markedly in the United States over the past century. It has long been the case, furthermore, that better-educated, higher-income people live longer, on average, than less-educated, lower-income people. In recent decades, however, the gap in life expectancy between higher-income individuals and those lower on the socioeconomic distribution has been expanding.
How have larger historical and projected gaps in life expectancy by income and education affected lifetime benefits under programs such as Medicare and Social Security? The analysis presented here examines the impact of a steeper mortality gradient by income on the major federal entitlement programs: Medicare, Medicaid, Social Security retirement, Disability Insurance, and Supplemental Security Income. The results show a considerable change in the overall distribution of these government benefits, driven by the growing gap in life expectancy by income and education.
Taking into account the widening gaps in longevity by lifetime earnings classes that have been found by a variety of other studies and that are confirmed by the analyses made for this report, the committee provides estimates of projected benefits under the major entitlement programs by lifetime earnings categories and also analyzes potential policy interventions from that perspective. As the report documents, changes in the distribution of life expectancy alter the distribution of lifetime net benefits from some of this nation’s most important public programs. In essence, actual and projected changes in life expectancy mean that major federal entitlement programs will unexpectedly come to deliver disproportionately larger lifetime benefits to higher-income people who, on average, will increasingly collect those benefits over more years than those with lower incomes.
TRENDS IN LIFE EXPECTANCY: THE GROWING GAP BY LIFETIME EARNINGS
The starting point for the committee’s analysis is trends in mortality. Using Social Security earnings history data linked to the Health and Retirement Study, we estimate mortality patterns based on life expectancies at age 50 for males and females in different generations by quintile of lifetime earnings. Our “lifetime earnings” measure is average nonzero earnings, as reported to Social Security, between ages 41 and 50. In our analysis of public programs, we compare the consequences of the mortality regime at ages above 50 for the generation born in 1930 to the mortality regime we project for the generation born in 1960.
Our results confirm numerous other studies showing that the gradient in life expectancy by income has been rising over time. Even among those born in 1930, people who wound up in the top quintile of lifetime earnings (i.e., they were in the top fifth of earners, based on how much they earned
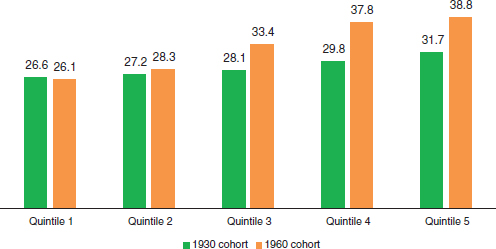
FIGURE S-1 Estimated and projected life expectancy at age 50 for males born in 1930 and 1960, by income quintile.
SOURCE: Committee generated from Health and Retirement Study data.
at ages 41 to 50) have longer life expectancy at age 50 on average than those in the bottom quintile. The gap, though, is estimated to have risen substantially since then because life expectancy of generations at the bottom of the earnings distribution is relatively flat or even declining, whereas life expectancy is rising rapidly at the top.
For example, consider male workers in the bottom fifth of lifetime earnings. Under the study’s mortality regime of those born in 1930 and surviving to age 50, they would have an additional life expectancy of 26.6 years, so they could expect to live to age 77, on average (see Figure S-1). Under the study’s mortality regime of those born in 1960, on the assumption that trends in mean and in dispersion continue, life expectancy at age 50 is slightly lower, at 26.1 years.1 In other words, for a period of more than 30 years, there will have been no net gains in life expectancy at age 50 for males at the bottom of the earnings distribution, if these projections hold.
The story is different at the top of the earnings distribution. For males in the top earnings quintile, life expectancy at age 50 for the 1930 birth cohort is 31.7 years. For those born in 1960, life expectancy at age 50 is projected to rise to 38.8 years. In other words, between the 1930 cohort
________________
1Mortality above age 50 for the 1960 generation is not observed in our dataset; mortality and life expectancy are projected using a model that is fit to the experience of generations born up to 1953, as explained in Chapter 3. Mortality for those born in 1930 is observed from ages 62 to 78 and is projected to older ages using our fitted model.
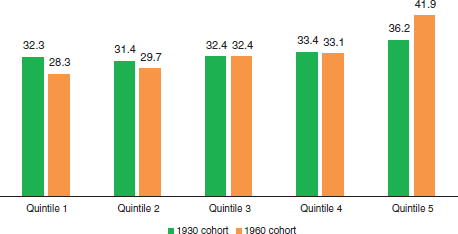
FIGURE S-2 Estimated and projected life expectancy at age 50 for females born in 1930 and 1960, by income quintile.
SOURCE: Committee generated from Health and Retirement Study data.
and the 1960 cohort, according to these estimates and projections, life expectancy is roughly unchanged for males at the bottom of the earnings distribution but increases by more than 7 years for those at the top.
The implication of these differential trends is that the gap in life expectancies is expanding rapidly. For males born in the 1930 cohort, the highest quintile’s life expectancy at age 50 is 5.1 years longer than the lowest quintile’s. For males born in the 1960 cohort, the projected gap widens to 12.7 years.
For females, the results appear even more pronounced (see Figure S-2), although the estimates are less reliable. The committee estimates suggest that life expectancy at age 50 for females at the bottom of the earnings distribution declines markedly between those born in 1930 and the projections for those born in 1960, from 32.3 years to 28.3 years. At the top of the female earnings distribution, however, life expectancy is projected to rise by more than 5 years. The result is that the gap in life expectancy between high-earning females and low-earning females is projected to expand from 4 years to 13.6 years.
IMPACT OF GROWING GAP IN LIFE EXPECTANCY ON BENEFITS FROM MAJOR ENTITLEMENT PROGRAMS
Given these substantial increases in projected life expectancy differentials, it is not surprising that the committee’s estimates also suggest a
TABLE S-1 Present Value of Entitlement Program Benefits at Age 50, by Sex, for People Under the Mortality Regimes of the 1930 and 1960 Birth Cohorts
| Present value of benefits at age 50 based on the mortality profile for those | ||
| Earnings Quintile | Born in 1930 | Born in 1960 |
| Males | ||
|
Lowest |
$402,000 | $391,000 |
|
2 |
347,000 | 366,000 |
|
3 |
344,000 | 432,000 |
|
4 |
364,000 | 499,000 |
|
Highest |
402,000 | 522,000 |
|
Gap, High-Low |
$0 | $132,000 |
|
Ratio, High/Low |
1.00 | 1.34 |
| Females | ||
|
Lowest |
$539,000 | $452,000 |
|
2 |
405,000 | 373,000 |
|
3 |
394,000 | 386,000 |
|
4 |
373,000 | 357,000 |
|
Highest |
410,000 | 480,000 |
|
Gap, High-Low |
−$129,000 | −$28,000 |
|
Ratio, High/Low |
0.76 | 1.06 |
growing gap in projected lifetime benefits under programs such as Social Security and Medicare because higher earners are increasingly more likely to receive such benefits over longer periods of time relative to lower earners. Table S-1 reports the present value of Medicare, Medicaid, Social Security (including retirement and disability), and Supplemental Security Income benefits by income quintile, derived from simulations using the Future Elderly Model (described in Chapter 2). The simulations perform a hypothetical experiment examining the impact of changing mortality on lifetime benefits, assuming that the policy parameters for those programs are fixed at their current levels (2010 for program structures).2 This allows the analysis to focus on the effects of mortality differences by quintile. The
________________
2Health changes affect economic outcomes between the two cohorts; in particular, health status affects earnings, workforce participation, and benefit claiming behavior. Both these effects and the pure mortality rate differences will affect results when comparing the 1930 and 1960 cohorts.
columns in Table S-1 provide insight into the marginal effect of the changes in actual and projected life expectancy by lifetime earnings.
As Table S-1 shows, these major entitlement programs generated benefits that, in present value at age 50, are either evenly distributed across lifetime earnings categories (for males) or somewhat tilted toward lower earners (for females). In particular, for males under the 1930 regime, total lifetime benefits accruing to those in both the lowest and the highest earnings category average roughly $400,000 in present value at age 50. The overall picture is one of relative neutrality across the earnings distribution. As discussed in Chapter 4, this pattern arises from a balance between Social Security retirement benefits (which were larger in absolute dollar amounts for higher earners than lower earners), Medicare benefits (which were about the same on average across the earnings distribution), and Medicaid, Disability Insurance, and Supplemental Security Income benefits (which were larger in absolute dollar amounts for lower earners than higher ones).
For females, the distribution of benefits by lifetime earnings for those under the 1930 regime is such that the top quintile had lower average benefit levels (in present value dollars) than the bottom quintile. The biggest source of the difference in the patterns between males and females is that Medicaid benefits (which were larger at the bottom than at the top for both males and females) are on average much larger for females than males, tilting total benefits toward those at the bottom of the earnings distribution.
As life expectancy gaps increase, however, this pattern changes markedly. For males under the 1960 mortality regime, lifetime benefits in present value at age 50 are projected to be significantly larger in the top earnings category than at the bottom, in contrast to the roughly neutral 1930 distributional pattern. For females, the distribution of lifetime benefits is projected to evolve to being roughly neutral across the earnings distribution, in contrast to the tilt toward lower earnings in the 1930 cohort. So, for example, the gap in present value of benefits between the highest quintile and the lowest quintile under the 1930 regime is zero for males and −$129,000 for females. Under the 1960 regime, the gap is projected to become $132,000 for males and $28,000 for females.
The results in Table S-1 are for benefits alone, but one should also be interested in benefits minus taxes paid. Because of modeling limitations (the model used by the committee lacks data on taxes paid before age 50), the analyses for this study were only able to include taxes paid after age 50. The committee’s simulation experiment calculates the net present value of expected taxes paid and government benefits received by a generation over the rest of its life starting at age 50. The program rules are assumed to remain as defined in 2010 and to persist through subsequent years until all members of the generation have died. The taxes and benefits by age are projected forward, conditional on these rules and on additional assump-
tions including income growth and health care cost grow (the net benefit measure is discussed in Chapter 2, and the committee’s simulation experiment is explained in greater depth in Chapter 5). Table S-2 presents the net present value results.
The results in Table S-2 illustrate that although the level of net benefits is clearly different from the level of gross benefits, the changes across the cohorts as mortality changes, which are the primary focus of this study, are similar. The gap between the top quintile and the bottom quintile, for example, widens by approximately $125,000 for males and $150,000 for femails, regardless of whether gross or net benefits are used, as life expectancy shifts from that of those born in 1930 to the projections for those born in 1960. The reason is that taxes paid after age 50 are not substantially affected in our model by the changes in mortality, so the changes across the total regimes are not significantly affected by whether or not taxes are subtracted from benefits.
TABLE S-2 Present Value of Net Benefits (benefits received minus taxes paid after age 50) at Age 50, by Sex, for People Under the Mortality Regimes of the 1930 and 1960 Birth Cohorts
| Present value of benefits at age 50 based on the mortality profile for those | ||
| Earnings Quintile | Born in 1930 | Born in 1960 |
| Males | ||
|
Lowest |
$319,000 | $310,000 |
|
2 |
246,000 | 266,000 |
|
3 |
217,000 | 301,000 |
|
4 |
202,000 | 331,000 |
|
Highest |
189,000 | 306,000 |
|
Gap, High-Low |
$130,000 | $4,000 |
|
Ratio, High/Low |
0.59 | 0.99 |
| Females | ||
|
Lowest |
$487,000 | $402,000 |
|
2 |
341,000 | 310,000 |
|
3 |
296,000 | 290,000 |
|
4 |
251,000 | 236,000 |
|
Highest |
240,000 | 310,000 |
|
Gap, High-Low |
−$247,000 | −$92,000 |
|
Ratio, High/Low |
0.49 | 0.77 |
Another perspective on the change in mortality is to examine how lifetime benefits compare to baseline wealth. As seen in Table S-3, the difference in mortality regime has a notable effect on the distribution of lifetime net benefits relative to an inclusive measure of wealth (which includes wealth at age 50, after-tax earnings after age 50, in present value at age 50, and total benefits in present value received after age 50). The share of wealth accruing from these net benefits rises by 7 percentage points for the top quintile of male earners but falls slightly for the lowest quintile. For females, the share rises by 5.4 percentage points for the top earners and falls by 3.6 percentage points for the bottom earners. As a result—whatever the baseline pattern of progressivity—the overall progressivity of lifetime benefits as defined by this measure declines markedly for both males and females. To put the point another way, the switch to the 1960 mortality regime increases the fraction of wealth represented by entitlement benefits by 5 to 7 percent for top earners, and reduces those resources by 0 to 4 percent for the lowest earners.
Two observations about these findings are noteworthy. First, the preceding discussion focused mostly on the top versus the bottom quintile.
TABLE S-3 Present Value of Net Benefits as a Share of Present Value of Inclusive Wealth
| Present value of net benefits at age 50, relative to inclusive wealth, based on the mortality profile for those | ||||
| Earnings Quintile | Born in 1930 (%) | Born in 1960 (%) | Percentage Point Change | |
| Males | ||||
|
Lowest |
45.7 |
45.6 |
–0.1 |
|
|
2 |
34.9 |
36.8 |
1.9 |
|
|
3 |
26.9 |
33.3 |
6.4 |
|
|
4 |
20.0 |
28.9 |
8.8 |
|
|
Highest |
14.4 |
21.4 |
6.9 |
|
| Females | ||||
|
Lowest |
69.0 |
65.4 |
–3.6 |
|
|
2 |
56.6 |
54.8 |
–1.8 |
|
|
3 |
45.3 |
44.9 |
–0.4 |
|
|
4 |
34.7 |
33.5 |
–1.3 |
|
|
Highest |
25.4 |
30.8 |
5.4 |
|
But the comparison for males applies also to roughly the top half of the earnings distribution relative to the bottom half. Life expectancy for males in even the third and fourth quintiles of lifetime earnings is projected to rise substantially; for those in the bottom and second quintile, it is largely flat. That pattern is also reflected in the present value of net benefits also. Second, the increased gaps in the present value of net benefits are driven primarily by Social Security (where the absolute level of present value dollars for top earners is projected to rise significantly relative to bottom earners) and Medicare (where the program is projected to move from being roughly neutral with regard to lifetime earnings to one in which the present value of benefits for higher-earning males is much larger than for lower earners).
Actual and projected population aging raise the costs of government programs for the elderly, leading to fiscal pressures and a likely policy response. The report analyzes the way that changing mortality differentials would interact with some possible policy responses. Most policy analysis, to the extent it includes any distributional analysis, either focuses solely on Social Security (where the analysis often includes a lifetime perspective) or on the progressivity of annual benefit flows (without taking into account differences in life expectancy and therefore lifetime benefits). By contrast, this report evaluates a number of policy changes from the perspective of the impact of differential trends in mortality on lifetime benefits by earnings quintile, a perspective that has rarely been applied in previous policy analyses.
The committee considers six potential policy reforms to the Social Security program and one to Medicare. The reforms were analyzed to determine how they would interact with projected changes in life expectancy by income quintile. These potential reforms were selected from a long list of possible changes that have emerged from policy discussions during past years. The committee’s selection for analysis of these particular policy reforms is not indicative of committee preferences or recommendations of them.
The Social Security simulations include raising the early eligibility age (EEA) by 2 years (to age 64); raising the Social Security normal retirement age (NRA) by 3 years (to age 70): raising both the EEA and NRA; reducing the cost-of-living adjustment applied to benefits by 0.2 percent per year (starting at age 62); reducing the top primary insurance amount (PIA) factor by one-third; and reducing the top PIA factor to zero. We also simulate raising the Medicare eligibility age by 2 years (to age 67).
The committee examines the effect on the present value of benefits relative to wealth for the top and bottom income quintiles and finds that most of these policy changes would make overall net benefits more progressive. The exceptions are those for raising the EEA for Social Security from age 62 to 64 or raising the Medicare eligibility age to 67. In terms of the impact of these changes on program solvency, the most significant effects
are seen with regard to raising the NRA by itself or raising the EEA and NRA jointly. The simulations for both these changes suggest a reduction in present-value benefits on the order of 22-23 percent for males and 14-15 percent for females.
In summary, the report finds that the United States is experiencing a substantial widening of differences in life expectancy at age 50 by lifetime earnings. According to the model and projections used for the analyses, these gaps will, in turn, exert a substantial influence on the pattern of lifetime benefits under programs such as Medicare, Medicaid, and Social Security. The report also provides analyses of several recent policy proposals from the perspective of their impact on the distribution of lifetime benefits, given the findings on life expectancy.
The analysis in this report is forward looking and necessarily requires projections of mortality by income quintile and birth cohort. Thus, there is unavoidable uncertainty in the numerical results presented; this uncertainty is discussed at length in Chapter 3 and revisited in the concluding Chapter 6. To summarize that discussion, the committee cannot be certain that the trends in mortality inequality that have been widely observed in the literature and that we have confirmed in the analyses presented here will in fact continue over the coming decades and not reverse. Nonetheless, the widening of mortality differences by education and lifetime income in past decades has been well established by many studies. Our analyses find that smaller increases in mortality inequality would simply imply proportionately smaller effects on lifetime net benefits. And while we cannot provide probability distributions reflecting a numerical measure of the uncertainty in our estimates of the size of effects, the committee does have a relatively high degree of confidence that effects of the sort we describe are taking place. Given the impact that such effects can exert on the nation’s most important social insurance programs, the increasing inequality in life expectancy at different points of the earnings distribution is an issue worthy of attention from policy makers and researchers alike.


