
Measuring the Size of the Illicit Tobacco Market
Quantifying any illegal activity is rife with complications as, by its very nature, the activity is obfuscated. This is true not only of tobacco (Merriman et al., 2000; Joossens et al., 2010; Bouchard and Ouellet, 2013), but also of other illegal markets (see, e.g., Bouchard and Tremblay, 2005a). An additional challenge for estimating the size of the illegal tobacco market (relative to strictly illegal drugs) is differentiating between products that originate from legal sources from the minority of products originating from illegal ones.1
A number of methods have been used to grapple with these difficulties and produce estimates of the global size of the illicit tobacco market, as well as estimates for specific countries. The first section of this chapter describes and assesses seven different methods and provides estimates derived from each. The second section presents the committee’s own (lower-bound) estimate of the size of the illicit market in the United States. The chapter concludes by offering recommendations for improving future estimates.
As noted above, seven methods have predominantly been used to measure the size of the illicit tobacco market. These methods can be grouped
_______________
1 In Colorado and Washington, there are now legal and illegal markets for recreational marijuana, which may mirror the situation for tobacco. There is not yet enough evidence to determine how users will respond to the opening of new legal markets: Will its legality attract first-time users or will users used to making illegal purchases switch to the legal market?
into three categories: residual methods, direct measurement, and expert opinion. Residual methods—such as trade gap analyses, comparisons of self-reported consumption and tax-paid sales, and econometric modeling—combine two or more sources of data on the illicit and licit markets to infer the scale of the illicit market. Direct measurement estimates, quantifying a particular segment of the illicit market, are based on such methods as empty pack collections and pack observation, return, and swap surveys, which are typically conducted in neighborhoods or cities. Larger-scale direct measurement estimates are derived from representative surveys of tobacco users’ purchasing behavior that ask specific questions about illicit purchases. Methods using expert opinion are based on polls of a number of informed sources to compile data from which an estimate can be extrapolated.
Residual Methods
One way to measure the size of the illicit tobacco market is to identify discrepancies among data from different datasets. The underlying idea in residual methods is that one measure captures both formal and informal market activity, and the other measure captures only legal market activity. This residual method of estimating illegal markets is common in many studies of informal economic activity. To measure the underground economy, for example, one can compare the total amount of money spent by a country’s residents (which is assumed to capture all market activity) to the total amount they earned (which is assumed to only record earnings in the formal sector), or one can compare a country’s officially recorded gross domestic product, which reflects the legal or formal market activity with that country’s total energy use, which is necessary for both formal and illicit activity. These methods are best characterized as indirect, as there are almost always other, nonillicit, reasons for different sources to yield different results, and researchers typically have to make assumptions about unknown factors to produce estimates of the size and growth of the illicit market. For tobacco, three basic residual approaches have been used: one based on the trade gap, one that compares tax-paid sales and self-reported consumption measures, and one that uses econometric modeling.
Trade Gap
Analyses of the trade gap can be used to estimate the scale of the illicit tobacco market, specifically, tobacco that is labeled as intended “for export” (and thus not subject to most taxes), even though it will be sold domestically. These analyses compare the total recorded exports and the total recorded imports; the difference reflects diversion to illegal markets while in transit. This method was first used by Bhagwati (1974) and Simkin
(1974) in studies of, respectively, various Turkish and Indonesian imports and exports. Joossens (1998) applied the method to cigarette imports and exports, finding that global exports consistently exceeded imports in 1996 by about 400 billion cigarettes, suggesting that one-third of global cigarette exports were smuggled. Merriman and colleagues (2000) also used this method in the mid-1990s and found similar results—nearly one-third of recorded exported cigarettes did not appear in recorded imports, which amounted to about 6 percent of global consumption.
Other global commodities also demonstrate discrepancies in recorded imports and recorded exports, and smuggling is not the only explanation for these statistical discrepancies (Feenstra et al., 1999). Factors that may contribute to such discrepancies include errors of commodity classification; time lags; misallocation of country of origin by the receiving country; and overinvoicing by the exporting country (Bhagwati, 1974; International Agency for Research on Cancer, 2011). However, cigarettes remain unique in that exports consistently and greatly exceed imports, with the gap appearing to fluctuate around policy changes. Thus, according to Merriman and colleagues (2000), the most reasonable explanation for the differences in recorded cigarette imports and recorded exports is diversion to illicit markets.
At the global level, a trade gap analysis assumes that all smuggled products pass initially through the legal export channel and are then diverted. Therefore, it does not capture small-scale smuggling (bootlegging). At the country level, the trade gap analysis has only one additional assumption: that all exported products destined for a particular country are, in fact, smuggled into that country and not diverted to some other country. As a result, this method does not capture illicitly traded cigarettes that are manufactured domestically. Therefore, this approach, both at the global and country levels, must be complemented by other methods to capture bootlegging and illegally manufactured domestic cigarettes.
Comparing Tax-Paid Sales and Self-Reported Consumption Measures
Levels of tax avoidance and tax evasion can be found by comparing the reported sales on which taxes were paid and self-reported cigarette consumption based on population surveys. Of course, there are many reasons why tax-paid sales and self-reported consumption may differ, such as underreporting of smoking prevalence and consumption by smokers, failure to include certain segments of the population in surveys (e.g., institutionalized populations, military), and random statistical variation. This method was used in two different studies in the United Kingdom. For the year 2000, one study estimated that nearly 18 percent of total consumption in the United Kingdom was illicit (Her Majesty’s Customs and Excise, 2000;
see also DTZ Pieda Consulting, 2000). (The committee used an adapted version of this method for its calculation of the size of the illicit U.S. market: see below.)
The numbers derived from using this method often reflect particular biases. Tax-paid sales usually account for shipments at the factory or wholesale level and not actual consumption (Merriman, 2001). Most self-reported consumption surveys (e.g., the Tobacco Use Supplement to the Current Population Survey and the National Health Interview Survey) only ask participants general questions about tobacco use and not specific questions that could be used to estimate the prevalence of illicit activity, such as location and price of last purchase. In addition, survey participants often underreport their use behaviors. If adjustments to the data for underreporting are not made, estimates using this method will underestimate the size of the illicit market (Warner, 1978; Farrelly et al., 2012b).
Econometric Modeling
Econometric modeling of cigarette demand can be used to estimate levels of both individual cross-border shopping and small-scale smuggling. Using data from neighboring jurisdictions, this method estimates predicted tax-paid sales on the basis of variables for incentives and opportunities for tax avoidance and evasion, such as differences in prices across jurisdictions, population distributions near borders, and the extent of cross-border tourist traffic. The difference between predicted tax-paid sales and actual tax-paid sales results in estimates for tax avoidance and tax evasion in a given location.
Econometric modeling has been used extensively to estimate the scale of the illicit tobacco market in the United States (see Becker et al., 1994; Yurekli and Zhang, 2000; Farrelly et al., 2003). The Mackinac Center for Public Policy also estimates rates of smuggling in each state using econometric modeling, though their results generally present higher rates than the other studies. For example, their results indicate 51.8 percent and 47.5 percent of the cigarettes consumed in Arizona and New York, respectively, were illicit in 2009 (Lafaive and Nesbit, 2010). (See discussion below for further comparison of the committee’s and the Mackinac Center’s methods.2)
Econometric modeling is a valuable tool for estimating levels of bootlegging and cross-border shopping, but it is typically not used in a way that would capture large-scale smuggling. In addition, compared with the meth-
_______________
2 Data from the Mackinac Center for Public Policy; see http://www.mackinac.org/18128 [January 2015] and http://taxfoundation.org/article/cigarette-taxes-and-cigarette-smuggling-state [January 2015].
ods discussed above, econometric modeling of cigarette demand requires a high level of expertise and is subject to the availability of appropriate data.
Direct Measurement
Arguably the most conceptually straightforward way to measure the size of the illicit tobacco market is to directly measure it. Population-based surveys that ask smokers about where they purchased their cigarettes can capture information about participants on both the demand side of the market (i.e., consumer data) and the supply side of the market (i.e., where and from whom illicit cigarettes can be purchased). Observations of actual cigarette packs can often reveal the extent of tax avoidance and evasion, as well as the prevalence of counterfeit cigarette sales in a market (which might otherwise be undetected by smokers). Attempts to directly measure the illicit market also include empty pack collections, and pack observation, return, and swap studies.
Population Survey Methods
Representative surveys of tobacco users’ purchasing behavior can be useful in assessing the extent of certain forms of tax avoidance and tax evasion (see Emery et al., 2002; Taylor et al., 2005; Chiou and Muehlegger, 2008; Callaghan et al., 2009; Luk et al., 2009; DeCicca et al., 2010; Leatherdale et al., 2011). These surveys are more useful than self-reported consumption surveys because they ask specific questions that can be used to quantify the prevalence of participation in the illicit tobacco market among smokers, not simply the prevalence of smoking. Surveys, such as the International Tobacco Control Policy Evaluation Study (ITC), which includes questions on cross-border, duty-free, Indian reservation, and Internet purchases and other options that potentially reflect untaxed or lower-taxed purchases (such as purchases from street vendors), can be used to determine the prevalence of cross-border shopping, direct purchasing, and duty-free purchasing. Because there are few laws against purchasing illicit tobacco products, tobacco purchasers have little or no legal incentive to conceal their behavior.
Joossens and colleagues (2014a) conducted an in-person survey with a cigarette pack inspection component to estimate illicit tobacco consumption across 18 European countries. The in-person portion of the study was conducted between January and July 2010 among approximately 18,056 individuals, representative of each European country in terms of age, sex, habitat, and socioeconomic status. During the in-person survey, interviewers asked current cigarette smokers questions to ascertain participants’ sociodemographic status, smoking status, and number of cigarettes smoked
per day. Interviewers also asked participants to show their latest purchased pack of cigarettes or hand-rolled tobacco.
Cigarette packs were inspected and identified as illicit if they carried a minimum of one of four criteria: (1) it was bought from illicit sources (as reported by smokers); (2) it had an inappropriate tax stamp (i.e., a pack with a foreign stamp or one that had no tax stamp unless the pack had been bought over the Internet, in another country, or in a duty-free shop); (3) it had an inappropriate health warning (i.e., a pack with health warnings in a foreign language or without health warnings, unless the pack had been bought over the Internet, in another country, or in a duty-free shop); or (4) its price was substantially below the known price in the participant’s market.
The results of this study showed that 6.5 percent of all packs sampled were illicit, with the highest prevalence of illicit packs in Latvia (37.8 percent), and illicit packs were more frequent among those living in a country that shared a land or sea border with Belarus, Moldova, Russia, or Ukraine.
Guindon and colleagues (2013), using this method and the ITC survey, found that 10 percent of smokers in Canada, France, and the United Kingdom reported that their last cigarette purchase came from a low-tax or untaxed source, whereas the prevalence estimates in Malaysia suggested much higher levels of tax avoidance and tax evasion. Similarly, researchers used the ITC surveys and the Ontario Tobacco Survey to gauge the size of the illicit market in Canada, which is detailed in the next section.
Loomis and colleagues (2010) analyzed data from the 2005-2009 New York Adult Tobacco Survey, encompassing the period in which an increase of $1.25 to the excise tax on cigarettes was enacted (in 2008). They found that (1) between 25 and 32 percent of smokers purchased cigarettes at Indian reservations, (2) between 2 and 5 percent of smokers made cigarette purchases over the Internet; and (3) both of these behaviors increased following the tax increase.
This method, as with other methods using self-reported survey data, is limited in a number of ways. According to Guindon and colleagues (2013), the smaller estimates found in their study as compared with pack inspection studies (e.g., Fix et al., 2013) may be explained by social desirability bias or imperfect recall. Also, because it is known that the prevalence of tax-avoidance behavior increases with smoking frequency, a sample limited to heavy or regular smokers will result in higher proportions of this behavior. In addition, especially when people are asked about illegal behaviors, though the surveys may be anonymous and though penalties and enforcement are generally minor, respondents may be less likely to report illegal purchases, and consumers are often unsure as to the legality of their purchases.
Empty Pack Collections
Empty pack collections estimate levels of tax avoidance and tax evasion in a particular area through observation. Researchers collect the packages of tobacco products and examine them for the presence of appropriate tax stamps, local warning labels, and other pack markings, and they also determine the product constituents to identify products that do not bear the appropriate stamps, labels, and markings or that may differ from those in locally produced products. This method was used in Poland as part of the ITC survey (International Agency for Research on Cancer, 2008); Wilson and colleagues (2009) surveyed discarded cigarette packs in New Zealand; Merriman (2010) used this method in Chicago, collecting littered packs in order to estimate the levels of tax evasion and tax avoidance of Cook County’s and the city of Chicago’s tobacco taxes; and Kurti and colleagues (2012) collected littered packs in the South Bronx.
In Chicago, Merriman (2010) collected both littered cigarette packs and those that had been properly disposed in representative random sample areas in the city and surrounding jurisdictions. Researchers collected littered packs from 100 transportation analysis zones (TAZs),3 which were selected using a weighted random sample with preference for locations with higher populations and employment. Pack collection occurred between mid-May and mid-June 2007: teams of at least two data collectors walked precisely along each selected route and picked up every littered pack. Collected packs were then coded to record the location found and the affixed tax stamps. The data were then compared to point-of-purchase data from select locations and census data on commuting patterns. The study found high rates of noncompliance: three-fourths of packs collected in Chicago did not have Chicago tax stamps. Compliance increased as the distance from low-tax borders increased.
Chernick and Merriman (2011) organized a littered pack collection in New York City just before the 2009 federal tax increase and found that 15 percent of the packs collected had no tax stamps from the state. The next data collection, after the tax increase, yielded a significantly higher prevalence rate of packs with no tax stamps, 24 percent. Two additional waves of data collection in subsequent months yielded similar results, suggesting that the tax-avoidance rate stabilized.
Davis and colleagues (2013) used the littered cigarette pack collection method to estimate tax avoidance and evasion in five northeastern cities: Boston; New York City; Philadelphia; Providence, Rhode Island;
_______________
3 For transportation planning, Chicago is divided into 930 TAZs. In the city and neighboring jurisdictions, TAZs closely follow traditional township boundaries and usually are one-half-mile rectangles. Census data were matched to each TAZ using geographical information systems to overlay census tract maps on TAZ maps (Merriman, 2010).
and Washington, D.C. The researchers randomly selected 30 census tracts weighted by population and employment in each city, similar to the Merriman (2010) study in Chicago. Littered packs were collected by walking the periphery of the census tracts for 45 minutes or until nine littered packs were found. The study found that 58.7 percent of cigarette packs collected had nonlocal tax stamps, foreign tax stamps, or no tax stamps.
Empty pack surveys have also been used by the tobacco industry to estimate the size of the illicit tobacco market. However, researchers have questioned their findings and methodologies. In an assessment of industry-conducted empty pack surveys in the United Kingdom, Rowell and colleagues (2014) found industry estimates to be “inconsistent with historical trends and recent independent data . . . whose methodology and validity remain uncertain” (p. 1). The analysis compared industry data—mostly compiled through empty pack surveys—with data from Her Majesty’s Revenue and Customs and the Pricing Policies and Control of Tobacco in Europe Consortium (PPACTE). Industry claims that the market share of illicit cigarettes increased from 6 percent in 2007 to 16 percent in 2010 were unsubstantiated by independent data that showed no change. Stoklosa and Ross (2013) used data from discarded packs on streets and surveys of packs in personal possession to estimate the size of the illicit trade in Poland and compared them with industry estimates. Commissioned by four major tobacco companies (British American Tobacco, Imperial Tobacco Group, Japan Tobacco International, and Philip Morris International), the Almares Research Group found that 22.9 percent of cigarette packs in Warsaw were not meant for the Polish domestic market. Stoklosa and Ross (2013) concluded that industry estimates of tax avoidance and tax evasion in Poland were higher than their estimates (14.6 and 15.6 percent) by nearly half.
Because this approach focuses on tax avoidance and tax evasion at the community level, estimates using this method are difficult to extrapolate into the aggregate (Fix et al., 2013). Tax-avoidance rates vary widely by neighborhood in New York City and elsewhere, where poor areas and those that are closer to Indian reservations have higher rates of avoidance. For instance, a discarded pack study conducted by Kurti and colleagues (2012) in the South Bronx found that 42 percent of the sampled cigarette packs did not have a tax stamp, 15.9 percent possessed counterfeit tax stamps, and for 18.3 percent taxes were paid outside of New York City: this estimated the prevalence of contraband to be much higher than that found by Chernick and Merriman (2011).
Though empty pack collections are useful in that researchers are able to identify the pack’s purchase location based upon markings and use location based on location of the littered pack, it is difficult to define a representative sample area for collections. The method is also limited by the fact that commuting patterns and tourism may inflate results and that the times of
purchase and of consumption of the littered packs are unknown. In addition, this method may overestimate tax avoidance and tax evasion if smokers who purchase contraband are more likely to litter. However, results from one study comparing littered packs to packs appropriately discarded in public garbage cans in Chicago found no consistent differences between the litter samples and the garbage samples (Merriman, 2010).
Pack Observation, Return, and Swap Studies
Pack observation surveys have been used in a number of countries, including Thailand and Poland (see Sarntisart, 2003; Stoklosa and Ross, 2013). To conduct these surveys, researchers choose an area with heavy foot traffic and examine passing smokers’ packs of cigarettes. They interview participants to gather information, including demographic information and smoking status, and they examine the packs on the spot to determine if all taxes have been paid. Unlike empty pack surveys, pack observation surveys gather information about the smoker, enabling researchers to account for tourism and commuting patterns.
Sarntisart (2003), using a small sample size, found that about 13 percent of all cigarettes consumed in Thailand were illicit. Stoklosa and Ross (2013) (as discussed above) used a population-based survey with a pack observation aspect and found that 14 to 15 percent of cigarettes in Poland were illicit.
Pack observation surveys have a number of limitations. Researchers must carefully select the location where they will conduct the street interviews. The area that is chosen needs to be representative of tobacco sales in the market as a whole. If a chosen place is known to be where smuggled cigarettes are sold, the results of the survey will overestimate the prevalence of illicit purchases. Moreover, it is often challenging to engage a representative sample of the smoking population in these types of surveys. In general, elderly people and those who are ill are less likely to be walking on the street. Other people who may be less likely to agree to a street interview are those with higher incomes, employed people, underage smokers, and those whose native language is different from their current place of residence. Once smokers have consented to the interview and pack examination, it is sometimes difficult for even trained researchers to determine whether or not taxes have been paid on a particular pack of cigarettes. Despite these limitations, pack observation surveys can be useful in determining low-end estimates of the market penetration of illicit cigarettes. If similar surveys are conducted over time, the relative scale of the illicit tobacco market may also be gauged.
Pack return and pack swap surveys have been conducted in Europe and the United States. In general, when conducting a pack return survey,
researchers ask smokers to mail in empty packages of tobacco in exchange for some form of compensation. Using the postal code from which the pack was mailed, researchers examine the packages to determine if the proper jurisdictional taxes were paid.
Fix and colleagues (2013) conducted a pack return survey to estimate tax avoidance and tax evasion in the United States using the 2009 and 2010 ITC survey. Smokers who reported smoking five or more cigarettes per day and who reported that they smoked factory-made or mostly factory-made cigarettes were asked to participate in the pack collection aspect of the study. Eligible participants were asked to mail an unopened pack of their usual brand of cigarettes and were sent a data collection kit and $25 as compensation. Researchers conducted a visual inspection of the returned cigarette packs to determine whether the pack was taxed or untaxed in the participants’ state of residence. The study found that approximately one-fifth (20 percent in 2009 and 21 percent in 2010) of cigarette packs returned for data collection did not have the appropriate tax stamp (Fix et al., 2013).
Like pack observation surveys, pack return and pack swap surveys share similar limitations. Though the pack return study conducted by Fix and colleagues (2013) uses smokers from a nationally representative survey, the researchers limited their scope to include only smokers who smoked more than 5 cigarettes daily (in 2010) or more than 10 cigarettes daily (in 2009). Because heavy smokers have greater incentive to seek cheaper alternatives, it is possible that limiting participants in this way overestimates the prevalence of illicit tobacco users. Furthermore, researchers may not be able to determine if taxes were paid in full on the returned packs. Another limitation of these kinds of studies is that collecting returned packs from a representative sample of the smoking population may be difficult because participation requires some labor and the received compensation negates a participant’s ability to remain anonymous.
Expert Opinion
A number of published estimates of the size and growth of the illicit tobacco market are based on surveying experts—customs and law enforcement officials, industry representatives, researchers, tobacco control professionals, and other informed parties. Estimates based on this method often appear in trade and government publications (Merriman, 2001), and they can be useful in assessing the size of the illicit tobacco market. Essentially, measures of the size of the illicit tobacco market produced by canvassing experts are weighted averages of other estimates of market size, including both direct observation (sometimes by the experts themselves over a number of years) and residual methods, where the “weights” assigned to
any given measure are determined by the expert’s sense of the quality or validity of the particular measure. Several notable studies use this method: Market Tracking International’s serial World Tobacco File, which estimates smuggling as a percentage of total cigarette sales in various countries; Euromonitor International estimates both the number of illicit cigarettes and the market share of illicit cigarettes in various countries; and Joossens and colleagues (2010) compiled estimates for select European countries using official and nonofficial data.
Joossens and colleagues (2010) derived country-specific estimates by reviewing a variety of sources, including academic articles, government reports, estimates from market research companies, and newspaper articles. Acknowledging that the quality of the estimates for each individual country varied widely, they estimated that in 2007 annual illicit consumption in the 84 countries studied was 657 billion cigarettes, or about 11.6 percent of total consumption. As a percentage of the total market, the Republic of Georgia (49 percent), Albania (40-50 percent), Bosnia and Herzegovina (35-45 percent), and Hong Kong (30 percent) exhibited the highest illicit share. In terms of absolute size, China was greatest with 214 billion illicit cigarettes smoked (8-10 percent of the total market), followed by Russia (76 billion, 19 percent of the total market), and the United States (62 billion, 13-25 percent of the total market).
The International Agency for Research on Cancer (2008) notes that estimates from experts are subjective and may have biases based on the individual expert’s position and interests. For instance, estimates derived from the tobacco industry typically overstate the scale of the illicit market. Industry representatives may possess specific knowledge of the illicit trade of cigarettes, but they also have an inherent financial conflict of interest in that warnings about the growth of the illicit market are used to deter enactment of tax increases and more stringent regulations, which drive down sales; see Box 4-1. Other expert opinions may also contain bias. Tobacco control advocates may have an interest in underestimating the extent of the illicit tobacco market in order to support their efforts to enact higher tobacco taxes. Law enforcement officials may have an interest in reporting higher levels of illicit trade in order to procure continued funding for enforcement efforts, or they may report lower levels of illicit trade in order to argue that their enforcement efforts have been effective (International Agency for Research on Cancer, 2011). In addition, because interviewers and experts tend to vary across studies and from year to year, comparing estimates that use this method is unreliable (Merriman, 2013). However, estimates based on experts’ opinions in certain instances have been shown to be consistent with estimates derived from other methods, and thus provide valuable background and corroborating information (International Agency for Research on Cancer, 2008).
BOX 4-1
Industry-Sponsored Estimates of the Illicit Tobacco Market
Studies estimating the size of the illicit tobacco market sponsored by the tobacco industry have been subject to numerous critiques on several issues: the transparency of their methodology; their methodological approach; the treatment or neglect of evidence; inconsistencies with estimates from academic or other studies; and nondisclosure of the source of funding. For example, the industry’s methodological reliance on litter or empty pack surveys, used to estimate the magnitude of nondomestic and counterfeit cigarettes, may lead to inflated estimates of illicitly traded tobacco due to their urban sampling bias and the inclusion of legal consumption that appears illicit because of tourism or commuting patterns (see discussion of empty pack surveys in the text).
Philip Morris International (PMI), in ending litigation with the European Union regarding its involvement in supplying contraband tobacco products to the black market, agreed in 2004 to pay $1.25 billion over 12 years. As part of the settlement, the company funds an annual report on illicit trade in Europe, Project Star, which is based on studies conducted by KPMG. These reports have been produced since 2006, but were not made public until 2011. PMI has used findings from Project Star to help in its “Regulatory Litigation Action Plan” against the UK government’s proposed pointofsale display ban.* A study that reviewed the method underlying this annual report noted that PMI inflated estimates of illicitly traded tobacco (Gilmore et al., 2013).
Specifically, in comparing data from Project Star and estimates of the Pricing Policies and Control of Tobacco in Europe Consortium (PPACTE), Gilmore and colleagues (2013) found that Project Star estimates that the illicit trade in France accounts for 13.7 percent of the tobacco market while PPACTE estimates a 2.4 percent share. The differences are seen for many countries: in Finland, the Project Star estimate of 15.9 percent is higher than the one from PPACTE, 3.5 percent; in Ireland, Project Star estimates 19.3 percent and PPACTE estimates 4.6 percent; and in the United Kingdom, Project Star estimates 10.5 percent and the PPACTE estimates 3.4 percent.
The study documented various ways in which Project Star reports not only lacked adequate methodological details, transparency, and external validation, but also relied unnecessarily on PMI data. For estimates of smoking prevalence, Project Star draws on PMI’s Global Consumer Tracking Survey (the method used in this survey is not known) instead of readily available data from the World Health Organization or OECD. The result has been that “much of the prevalence data appears inaccurate and biased in a way that would tend to overestimate illicit in Western compared with Eastern Europe” (Gilmore et al., 2013, p. 8). The failure to use publicly available and accepted data sources is noteworthy and highlights the importance of transparent and independent approaches to conducting research on the illicit tobacco market.
_____________
*This plan was supposed to be confidential, but it was published and can be found at http://www.tobaccotactics.org/index.php?title=Philip_Morris%27_Regulatory_Litigation_Action_Plan_Against_the_Display_Ban [October 2014].
Analysis and Conclusions: Methods
Estimates of the size of the illicit tobacco market vary based on the type of method used to derive estimates, at least in part because the different approaches capture different combinations of tax avoidance and tax evasion, and it is difficult to separate the two activities, especially in the United States. Methods based on self-reports or purchase behavior typically yield lower estimates than pack inspection survey methods, while littered pack studies typically (though not always) produce the highest estimates.
Residual methods are much better at capturing changes in the market over time rather than levels at a particular moment. Surveys may not be able to reach subpopulations of heavy smokers in prison or living on the streets, and they are limited by inaccuracies from a variety of factors, including social desirability bias and recall (Guindon et al., 2013). Empty pack studies, like other direct measurement methodologies, compensate for some of these limitations, but have limitations of their own in assessing the size of the market, including the fact that many packs are unidentifiable, the data collection is generally limited to specific areas of a city, and include packs legally purchased by their users that are simply discarded in the study area.
These methods differ in sample sizes, time periods covered, and scientific rigor, and they yield different estimates and have different sources of error. In light of these factors, it is important to consider estimates from multiple methods in order to obtain the most comprehensive picture of the scale of the illicit tobacco market for a specific location and time. As shown in Table 4-1, each method has its own set of limitations, which influence the estimates in both directions.
As the table shows, each method captures data on the demand side of the illicit market—that is, they attempt to gauge the size of the illicit market by piecing together information about the users and the frequency of their use. In contrast, though some expert opinion analyses gather data from tobacco industry participants, little else is known about participants on the supply side of the market. One effort on the supply side is being undertaken by the New York City Sheriff’s Department, as part of its strategic anti-contraband tobacco enforcement. A representative from the office informed the committee that it collects data on the number of licensed retailers in the city, maps where illegal sales or other violations occur, and documents the number and severity of violations at each retail establishment.4 Similar to these efforts in New York City, consistent data could be collected across law enforcement agencies and jurisdictions and used to estimate the amount
_______________
4New York City Sheriff’s Office (2014).
TABLE 4-1 Methods for Estimating the Illicit Tobacco Markets: Data Requirements and Availability, Strengths, and Weaknesses
| Estimation Method | Data Requirements | Data Availability | Strengths | Weaknesses |
| Trade Gap | Data on exports and imports by country and product | Appropriate data available in most countries | Very low cost; provable and reproducible; “common-sense” results are easy to explain | Does not detect bootlegging; relies on a questionable assumption about “lost” exports; difficult to determine local-level (i.e., country) estimates |
| Comparing Tax-Paid Sales and Self-Reported Consumption Measures | Data on tax-paid sales and a variety of income, demographic, and population characteristics in neighboring areas | Appropriate data available in some countries; primary collection of data on cigarette smoking necessary in some countries | Provable and reproducible; “commonsense” results easy to explain; comparable to similar data in other countries | High cost if cigarette consumption surveys not available; results may be inaccurate in countries with changing perceptions about smoking |
| Econometric Modeling | Data on tax-paid sales and a variety of income, demographic, and population characteristics in neighboring areas | Appropriate data available in most countries | Low cost if appropriate expertise used; provable and reproducible; comparable to similar data in other countries | Does not detect large-scale smuggling; requires high level of expertise |
| Population-Based Surveys | Consumer surveys follow a precise and established process | Primary collection of data necessary in most countries | Provable and reproducible; potential bias discernable to those who carefully study the methodology | Very high cost; requires high level of expertise to select appropriate survey locations; smuggling may be underestimated in countries with strict legal codes; does not capture illicit transactions that respondents believe to be licit |
| Empty Pack Collections | Data on collected tobacco products in a given area | Primary collection of data necessary in most countries | Low cost if appropriate expertise used; produces neighborhood and community-level estimates | Requires high level of expertise to select appropriate survey locations; can be difficult to determine if appropriate taxes were paid; does not capture loosies |
| Pack Observation, Return, and Swap | Data on collected tobacco products in a given area | Primary collection of data necessary in most countries | Able to reach subpopulations of smokers not reached in survey-based methods; eliminates social desirability bias and recall bias | Requires high level of expertise to engage representative samples of smokers; can be difficult to determine if appropriate taxes were paid |
| Expert Opinion | Open-ended survey of experts | Primary collection of data necessary in most countries | Low cost; provides an agreeable, “commonsense” view; highly specialized training not required | Difficult to establish constant and consistent selection of experts; results may not be objective and cannot be replicated |
NOTE: See text for discussion.
SOURCE: Adapted from Merriman (2013).
of cigarettes or other tobacco products entering the illicit market. This would provide another dataset to use in a methodological triangulation.
ESTIMATES FOR THE UNITED STATES
The committee developed its own estimate of the size of the illicit market in the United States for multiple reasons. As detailed above, there are a number of estimates of the size of the illicit tobacco market in the United States that are derived from multiple methods, each with different time spans and sample sizes and of varying scientific rigor. The committee’s estimate adds an important, recent calculation, and it provides an estimate of the absolute size of the illicit tobacco market. Estimating the absolute size of the market allowed the committee to describe trends in the market and make comparisons among countries, where there are different rates of smoking.
The committee decided not to undertake a similar calculation of the size of the global illicit tobacco market for several reasons. Joossens and colleagues (2010) produced such an estimate (finding that 11.6 percent of the global market is illicit), and there are inherent challenges in calculating a global estimate. A global estimate, drawing on existing country-specific estimates, would potentially compound the limitations of each method (detailed above). Country-level data are varied in their availability and objectivity, and not all studies describe their methods or limitations clearly.
Specific country estimates may be important points of reference for American policy makers, as they could provide a sort of scorecard by which to judge any possible interventions in the illicit tobacco market. The committee highlights Canada because its experience with the illicit tobacco market is particularly informative for the United States: see Box 4-2. However, as noted throughout this report, the illicit tobacco market is dynamic and takes different forms in each country. Any estimates of the size of the market provide only a snapshot, and thus, they can be informative on the country level but provide limited use on a global scale.
Methods, Data, and Measures
Methods
To develop its own estimate of the size of the illicit tobacco market in the United States, the committee used a residual method, specifically, comparing tax-paid sales and self-reported consumption measures. The committee chose to use this method for four reasons: (1) time constraints and data availability made this the most feasible approach for calculating a recent estimate; (2) the data allow for the calculation of both state and
BOX 4-2
Estimating the Size of the Illicit Tobacco Market in Canada
Canada’s experience with the illicit tobacco market is informative for the United States: the two markets are similar in that provincial tax differences are analogous to state tax differentials and taxexempt sales to nonNatives are sources of tax evasion in both countries. There is an extensive literature on the size of the illicit tobacco industry in Canada, perhaps because that industry is relatively large. Joossens and colleagues (2010) estimate 15 to 20 percent as the proportion of illegal purchases in Canada. Our review of the literature suggests that the rates can change rapidly from lows of 4 to 5 percent to highs of 25 to 30 percent (or more, depending on the data source) in just a few years, and that the 15 to 20 percent figure appears to be a reasonable “mean rate” in between such variations.
The most conservative numbers are typically derived from gap analyses (7.6 to 14.7 percent in 2010; see Physicians for a SmokeFree Canada, 2011), while higher rates are found using “discarded cigarette butt studies,” like the ones regularly conducted by the Canadian Convenience Stores Association (30 to 36 percent; see Canadian Convenience Stores Association, 2007, 2008). The oftcited figure of a 20 to 30 percent market share of illegal tobacco for Canada comes from a market research company, the GfK Group (2006, 2008): their pack swap studies showed an increase from 16.5 to 32.7 percent in a matter of just 2 years.
More standard surveys also contribute some estimates. Drawing from general population surveys, official data on legal tobacco sales, and Statistics Canada’s Survey of Household Spending, Terefe and colleagues (2011) estimated that illegal tobacco accounted for a 19.4 percent share of all tobacco transactions in 2008. Some Canadian surveys do ask if respondents purchased their cigarettes on Native reserves. Using the Ontario Tobacco Survey, Luk and colleagues (2009) found that 25.8 percent of respondents reported recent contraband cigarette purchases from reserves, accounting for 14 percent of total cigarette consumption in Ontario in 2006. Heavy smoking was the main predictor of recent purchase on Native reserves. Similar percentages of illicit market participation were found in studies of the youth population (see Callaghan et al., 2009, 2010).
The most recent, conservative estimate of the size of the illicit tobacco industry in Canada for 2010 is from Physicians for a SmokeFree Canada (2011), which estimated a 7.6 to 14.7 percent range. This is the range used by the committee to represent what is known on the size of the Canadian illicit tobacco industry. This range comes from the 7.6 percent estimate derived from the Canadian Tobacco Use Monitoring Survey (CTUMS) and the 14.7 percent estimate derived from the Canadian Community Health Survey (CCHS). The 11 percent midpoint estimate nicely matches the estimate by Guindon and colleagues (2013) of 10 percent from the survey by the International Tobacco Control Policy Evaluation Project (ITC) for Canada for this time period.
Physicians for a SmokeFree Canada (2011) estimated the Canadian illicit tobacco market by calculating the difference between total cigarette consumption and legal consumption. Total consumption was measured by taking the number of smokers in the CTUMS and the CCHS surveys and multiplying it by the number
of cigarettes an average smoker consumes. Total legal cigarette sales were obtained from Health Canada reports, which publish the aggregate volume of legal sales for each province and territory. These figures are obtained from tobacco companies, which are required to report the number of cigarettes produced or the volume of manufactured tobacco to Health Canada.
Figure B4-2 presents the PFSFC estimates of the proportion of cigarette consumption that is attributed to the illicit market (using the more conservative CTUMS survey for this illustration). The committee added data from two other sources, all taken directly from PFSFC (2011): the GfK Group, Research and Dynamics and British American Tobacco’s (GfKRD/BAT) pack swap studies and Euromonitor data.* All three series are consistent on trends, at least for the years for which they overlap. The PFSFC series suggests a very small illegal market from 2003 to 2005, before a sudden increase was observed between 2006 and 2009. In 2010, the illicit market appeared to have lost momentum. Euromonitor data through 2013 show a continued decline: 18.6 percent in 2011, 17.7 percent in 2012, and 16.9 percent in 2013.
In Figure B4-2, the committee compares these trends in illicit consumption to trends in seizures obtained from the Royal Canadian Mounted Police (RCMP) (2012). The trends are strikingly similar, even if the RCMP seizure data are likely to be influenced by arbitrary factors (e.g., special investigative projects) and random large seizures. The RCMP seizure data do seem to reflect, to some extent, the market forces in the illicit tobacco industry for the period under study. At the same time, it is likely that one feeds the other, as the lag in the peaks for the 2009 seizure series and the 2007 PFSFC series suggest: that is, the bigger the illicit tobacco market, the more resources invested by the RCMP in this market.
_____________
*Euromonitor International is an independent consumer markets research organization (see http://www.euromonitor.com/tobacco [January 2015]).
national estimates; (3) it is provable and reproducible; and (4) it allows calculation of time trends.
It is important to note that because of the size of the cigarette tax differentials among states, tax-paid sales in any given state are unlikely to reflect cigarette consumption by smokers in that state. In a state with a relatively high tax, smokers will seek out lower-cost alternatives in neighboring states, on tribal lands, or online. Also, the state tax differences may provide incentives for some people to purchase and transport large quantities of cigarettes from low- to high-tax jurisdictions for resale through informal street sales or sales in brick and mortar stores. Thus, the estimates for low-tax states will include these illicit purchases for smokers outside the
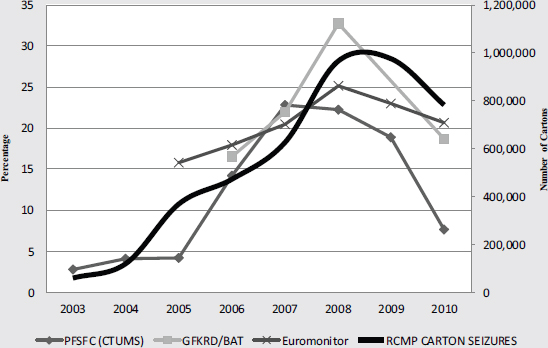
FIGURE B4-2 Estimates of the proportion of cigarette consumption that is attributed to the illicit market and seizures by the Royal Canadian Mounted Police, 20032010.
NOTES: PFSFC = Physicians for a SmokeFree Canada; CTUMS = Canadian Tobacco Use Monitoring Survey; GfKRD = GfK Group, Research and Dynamics; BAT = British American Tobacco; RCMP = Royal Canadian Mounted Police.
SOURCE: Adapted from Physicians for a SmokeFree Canada (2011).
state. Building on methods by Farrelly and colleagues (2012), the committee developed state-level estimates of self-reported consumption and compared them with tax-paid sales. When consumption is higher than sales, the deficit indicates that cigarettes are being purchased from out of the state for consumption in the state. When the reverse is true, the state with higher sales than consumption is considered to be a source for cigarettes being consumed elsewhere. With the exception of sales on military bases and some cigarettes produced on tribal lands, the sum of all state-level tax-paid sales should capture total U.S. cigarette sales and consumption. The committee then estimated cigarette tax evasion and avoidance by summing both state-level deficits and surpluses between sales and self-reported consumption.
Data
The committee used data from an 18-year time span from the National Cancer Institute-sponsored Tobacco Use Supplement to the Current Population Survey (TUS-CPS), covering 1992-1993 through 2010-2011. The TUS-CPS, administered by the U.S. Census Bureau, estimates state-level adult smoking prevalence and aggregate self-reported cigarette consumption. The committee limited the data to self-respondents ages 18 and older from civilian households. The committee obtained state-level tax-paid sales of cigarettes from Orzechowski and Walker (2012), and the committee obtained data on state-level population from the U.S. Census Bureau’s Population Estimates Program.
Measures
The committee defined current smokers as those who have smoked 100 cigarettes lifetime and currently smoked some days or every day at the time of the interview. The committee then multiplied a state’s population of those ages 18 and older by the state-level prevalence to derive the number of smokers in each state. The committee estimated self-reported consumption of cigarettes by using TUS-CPS responses to the question “On the average, how many cigarettes did you usually smoke each day?” In the 2010-2011 TUS-CPS, responses from everyday smokers were top coded to 40 cigarettes, meaning that, for example, someone who reports smoking 50 cigarettes a day to the TUS-CPS will have their answer coded as 40 cigarettes a day. According to the TUS-CPS technical documentation, there are relatively few smokers who reported smoking more than 40 cigarettes a day, with a mean of 42.65 cigarettes a day. Somedays smokers’ responses were top coded at 20 cigarettes (with a reported mean of 22.19 for the top-coded responses). Somedays smokers’ responses were averaged across 30 days. The committee then aggregated the data on daily self-reported consumption into an annual number of packs consumed (i.e., [daily self-reported consumption] × 365). The committee then multiplied this annualized estimate of cigarette consumption by the estimated state-level smoker population to create a measure of total self-reported consumption of packs of cigarettes for each state (i.e., [annual self-reported consumption] × [total number of adult smokers]).
As discussed above, one of the limitations of comparing tax-paid sales with self-reported consumption is that people tend to underreport their levels of smoking. To control for this phenomenon, the committee adjusted for underreporting of consumption by comparing total sales nationally with the national self-reported consumption. The ratio between total self-reported national consumption and total national sales represents the extent of under-
reporting (i.e., 0.65). The committee then inflated all state-level consumption estimates by the inverse of the ratio of self-reported consumption to the national tax-paid sales of cigarettes. The committee classified a state as a net importer (exporter) of cigarette sales if its adjusted consumption was greater (less) than its tax-paid sales. Summing the net exports or the net imports gives an estimate of the total net flows of cigarette sales between states.
Results
Nationally, self-reported consumption totaled 9.38 billion packs of cigarettes in 2010-2011. State tax-paid sales accounted for 14.51 billion packs of cigarettes. The ratio of total consumption to sales nationally is 0.65. When adjusted by the consumption/sales ratio, the national consumption totals 14.51 billion packs of cigarettes.
Overall, using this method, the estimated number of packs subject to tax evasion and avoidance (i.e., the difference between adjusted consumption and sales) amounted to 1.24 billion packs of cigarettes, or 8.5 percent of national tax-paid sales: see Table 4-2. These cigarettes are those for which the proper state and local taxes have not been fully paid; for almost all of them, however, the federal tax has been paid. The committee classified 22 states and the District of Columbia as net exporters and 28 states as net importers of illicit cigarettes.
Figure 4-1 shows that, according to the committee’s calculations, the net percentage of sales subject to tax evasion and avoidance has grown over the 18 years studied, from 3.2 percent in 1992-1993 to 8.5 percent in 2010-2011. In the most recent year (2010-2011), the net importing states lost an estimated $2.95 billion in excise taxes and roughly $2 billion in sales taxes, while net exporting states gained an estimated $0.82 billion in excise taxes. These figures can be compared with total tobacco tax revenue collections, which were $17.65 billion at the state and local levels in 2011 (Tax Policy Center, 2013). It is important to note, however, given that smoking rates declined over this time period, some of the increase in the percentage of sales subject to tax evasion and avoidance could be due to the 30 percent reduction in total market size if smokers who do not use illicit markets are more likely to quit.5
At the state level in 2010-2011, the adjusted ratios of consumption to sales ranged from a low of 0.56 in New Hampshire to a high of 1.83 in
_______________
5 For example, the TUS-CPS estimates that there were 38,700,000 smokers in the United States in 2006, 17.7 percent of the population. If 7.7 percent of them used illicit markets exclusively, that would imply there are 2,980,000 illicit market users, or 1.32 percent of the population smokes illicit cigarettes. The same calculations in 2010-2011, when 16.1 percent of the population smoked, also implies about 1.36 percent of the population smokes illicit cigarettes.
TABLE 4-2 Estimates of U.S. Cigarettes Subject to Tax Evasion and Avoidance, 2010-2011
| Measure | Net Exporters | Net Importers | Difference |
| States (and the District of Columbia) | 23 | 28 | — |
| Self-Reported Consumption (millions of packs) | 4,590.7 | 4,786.0 | –195.3 |
| Adjusted Self-Reported Consumption (millions of packs) | 7,106.9 | 7,399.3 | –292.4 |
| Tax-Paid Sales (millions of packs) | 8,336.8 | 6,169.3 | 2,167.5 |
| Difference Between Adjusted Consumption and Sales | –1,230.0 | 1,230.0 | –2,459.9 |
| Sales Subject to Tax Evasion and Avoidance | –8.48% | 8.48% | — |
SOURCE: Data from the Tobacco Use Supplement to the Current Population Survey and Orzechowski and Walker (2012); see text for discussion.
Washington: see Table 4-3. In other words, nearly twice as many cigarette packs were sold in New Hampshire than were consumed in the state, while in Washington consumption was nearly twice that of sales.
Figure 4-2 illustrates the correlation between the ratio of adjusted consumption to sales to state cigarette excise tax for 2010-2011. The fitted line in this figure shows that the higher the state cigarette excise tax, the higher the ratio between adjusted consumption and tax-paid sales or tax evasion and avoidance.
In terms of revenue, states that are net importers are losing excise and sales tax revenues due to tax avoidance and evasion; states that are net exporters are gaining excise and sales tax revenues. Total revenues gained or lost by a state can be estimated by multiplying the difference between the tax-paid sales and the adjusted self-reported consumption by the state excise tax per pack of cigarette. Table 4-4 shows the estimated state excise taxes gained and lost for 2010-2011 for the top five net exporting and importing states.
The committee estimates that the state of New York loses the most revenue due to illicit tobacco purchases, nearly half of all revenue lost nationwide. Those losses constitute roughly 2 percent of annual New York tax revenue, or 9.7 percent of total sales tax revenue. As context for comparison with other revenue losses, the Internal Revenue Service estimates that $450 billion in income tax, every year, is not remitted to the federal government on time, which is a roughly 17 percent initial noncompliance
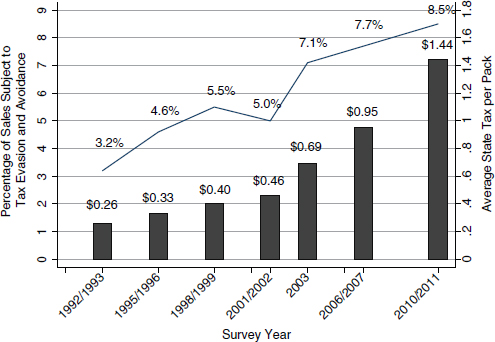
FIGURE 4-1 Trend in net tax evasion and avoidance in the United States, 1992-1993 through 2010-2011.
NOTE: Years on the X-axis represent the date of the TUS-CPS from which the data were derived.
SOURCE: Data from the TUS-CPS and Orzechowski and Walker (2012); see text for discussion.
rate with the U.S. Income Tax Code.6 At the state level, roughly 18 percent of taxes go unpaid, constituting a loss of roughly $136 billion.7 As another comparison, the Insurance Research Council estimated that in 2007, auto insurance companies paid between $4.3 and $5.8 billion dollars in fraudulent claims, between 11 and 15 percent of the dollar value of all claims.8
_______________
6 Once criminal prosecutions and late payments are taken into account, the total amount of tax revenue lost each year, primarily due to underreporting of business income, is $385 billion a year, or about 14.5 percent. See http://www.irs.gov/uac/IRS-Releases-New-Tax-Gap-Estimates;-Compliance-Rates-Remain-Statistically-Unchanged-From-Previous-Study [January 2015].
7 See http://www.reuters.com/article/2012/09/06/us-usa-tax-newyork-crackdownidUSBRE88514M20120906 [January 2015].
8 See http://www.insurance-research.org/research-publications/fraud-and-buildup-auto-injury-insurance-claims-2004-edition [January 2015].
TABLE 4-3 Self-Reported Consumption and Tax-Paid Sales by State, 2010-2011
| State | Self-Reported Consumption (millions of packs) | Tax-Paid Sales (millions of packs) | Ratio of Tax-Paid Sales to Self-Reported Consumption | Adjusted Self-Reported Consumption (millions of packs) | Ratio of Adjusted Self-Reported Consumption to Tax-Paid Sales |
| Alabama | 180.02 | 322.09 | 1.79 | 300.14 | 0.93 |
| Alaska | 22.80 | 31.10 | 1.36 | 38.01 | 1.22 |
| Arizona | 135.97 | 163.43 | 1.20 | 226.70 | 1.39 |
| Arkansas | 131.46 | 180.45 | 1.37 | 219.17 | 1.21 |
| California | 474.43 | 960.82 | 2.03 | 790.99 | 0.82 |
| Colorado | 103.38 | 203.91 | 1.97 | 172.36 | 0.85 |
| Connecticut | 85.89 | 132.30 | 1.54 | 143.20 | 1.08 |
| Delaware | 27.52 | 79.93 | 2.90 | 45.88 | 0.57 |
| District of Columbia | 9.00 | 13.57 | 1.51 | 15.00 | 1.11 |
| Florida | 542.79 | 935.66 | 1.72 | 904.98 | 0.97 |
| Georgia | 243.79 | 523.18 | 2.15 | 406.46 | 0.78 |
| Hawaii | 29.37 | 45.40 | 1.55 | 48.97 | 1.08 |
| Idaho | 38.36 | 71.89 | 1.87 | 63.96 | 0.89 |
| Illinois | 404.93 | 574.96 | 1.42 | 675.13 | 1.17 |
| Indiana | 271.31 | 453.79 | 1.67 | 452.34 | 1.00 |
| Iowa | 108.38 | 150.11 | 1.39 | 180.69 | 1.20 |
| Kansas | 94.64 | 124.67 | 1.32 | 157.79 | 1.27 |
| Kentucky | 244.62 | 465.97 | 1.90 | 407.84 | 0.88 |
| Louisiana | 163.82 | 337.11 | 2.06 | 273.12 | 0.81 |
| Maine | 49.49 | 68.51 | 1.38 | 82.50 | 1.20 |
| Maryland | 121.00 | 199.95 | 1.65 | 201.74 | 1.01 |
| Massachusetts | 158.42 | 223.10 | 1.41 | 264.13 | 1.18 |
| Michigan | 317.40 | 463.99 | 1.46 | 529.20 | 1.14 |
| Minnesota | 139.68 | 243.03 | 1.74 | 232.88 | 0.96 |
| Mississippi | 99.76 | 208.44 | 2.09 | 166.33 | 0.80 |
| Missouri | 296.12 | 548.88 | 1.85 | 493.71 | 0.90 |
| Montana | 31.27 | 45.76 | 1.46 | 52.13 | 1.14 |
| Nebraska | 52.44 | 98.33 | 1.88 | 87.43 | 0.89 |
| Nevada | 79.19 | 124.49 | 1.57 | 132.03 | 1.06 |
| New Hampshire | 42.31 | 126.60 | 2.99 | 70.54 | 0.56 |
| New Jersey | 168.22 | 279.19 | 1.66 | 280.47 | 1.00 |
| Adjusted Self-Reported Consumption – Tax-Paid Sales (millions of packs) | State Tax per Pack | Average Retail Price per Pack | Smoking Prevalence (%) | Lost Revenue (millions of dollars) | Percentage of Consumption Subject to Tax Avoidance and Evasion | ||
| –21.95 | $0.43 | $4.35 | 18.39 | $(9.33) | –7.31 | ||
| 6.91 | $2.00 | $7.38 | 21.15 | $13.82 | 18.18 | ||
| 63.26 | $2.00 | $6.07 | 14.98 | $126.53 | 27.91 | ||
| 38.72 | $1.15 | $4.95 | 22.50 | $44.53 | 17.67 | ||
| –169.82 | $0.87 | $4.89 | 10.32 | $(147.75) | –21.47 | ||
| –31.55 | $0.84 | $4.86 | 14.26 | $(26.50) | –18.31 | ||
| 10.89 | $3.00 | $7.00 | 14.47 | $32.68 | 7.61 | ||
| –34.05 | $1.60 | $5.07 | 16.83 | $(54.48) | –74.22 | ||
| 1.44 | $2.50 | $6.29 | 12.99 | $3.59 | 9.57 | ||
| –30.68 | $1.34 | $5.00 | 14.60 | $(41.08) | –3.39 | ||
| –116.72 | $0.37 | $4.31 | 14.94 | $(43.19) | –28.72 | ||
| 3.57 | $3.00 | $7.05 | 13.38 | $10.72 | 7.30 | ||
| –7.93 | $0.57 | $4.39 | 16.26 | $(4.52) | –12.40 | ||
| 100.17 | $0.98 | $5.46 | 17.23 | $98.17 | 14.84 | ||
| –1.45 | $1.00 | $4.63 | 20.88 | $(1.45) | –0.32 | ||
| 30.58 | $1.36 | $5.12 | 19.14 | $41.59 | 16.92 | ||
| 33.12 | $0.79 | $4.58 | 18.36 | $26.16 | 20.99 | ||
| –58.13 | $0.60 | $4.30 | 24.99 | $(34.88) | –14.25 | ||
| –63.98 | $0.36 | $4.32 | 19.50 | $(23.03) | –23.43 | ||
| 14.00 | $2.00 | $6.08 | 18.16 | $28.00 | 16.97 | ||
| 1.79 | $2.00 | $6.04 | 13.07 | $3.59 | 0.89 | ||
| 41.03 | $2.51 | $7.04 | 12.99 | $102.98 | 15.53 | ||
| 65.21 | $2.00 | $5.96 | 18.04 | $130.41 | 12.32 | ||
| –10.15 | $1.23 | $5.46 | 15.88 | $(12.49) | –4.36 | ||
| –42.12 | $0.68 | $4.26 | 19.24 | $(28.64) | –25.32 | ||
| –55.18 | $0.17 | $3.88 | 23.56 | $(9.38) | –11.18 | ||
| 6.37 | $1.70 | $5.58 | 18.84 | $10.83 | 12.22 | ||
| –10.89 | $0.64 | $4.46 | 16.57 | $(6.97) | –12.46 | ||
| 7.54 | $0.80 | $4.74 | 17.74 | $6.03 | 5.71 | ||
| –56.05 | $1.78 | $5.51 | 16.10 | $(99.77) | –79.46 | ||
| 1.28 | $2.70 | $6.92 | 12.36 | $3.46 | 0.46 | ||
| State | Self-Reported Consumption (millions of packs) | Tax-Paid Sales (millions of packs) | Ratio of Tax-Paid Sales to Self-Reported Consumption | Adjusted Self-Reported Consumption (millions of packs) | Ratio of Adjusted Self-Reported Consumption to Tax-Paid Sales | |||
| New Mexico | 41.55 | 57.79 | 1.39 | 69.28 | 1.20 | |||
| New York | 424.47 | 389.45 | 0.92 | 707.70 | 1.82 | |||
| North Carolina | 320.85 | 579.85 | 1.81 | 534.93 | 0.92 | |||
| North Dakota | 21.78 | 46.45 | 2.13 | 36.32 | 0.78 | |||
| Ohio | 484.43 | 659.94 | 1.36 | 807.67 | 1.22 | |||
| Oklahoma | 176.20 | 264.17 | 1.50 | 293.76 | 1.11 | |||
| Oregon | 94.16 | 176.11 | 1.87 | 156.98 | 0.89 | |||
| Pennsylvania | 409.06 | 713.97 | 1.75 | 682.01 | 0.96 | |||
| Rhode Island | 31.14 | 39.95 | 1.28 | 51.92 | 1.30 | |||
| South Carolina | 159.27 | 458.87 | 2.88 | 265.55 | 0.58 | |||
| South Dakota | 26.97 | 37.38 | 1.39 | 44.97 | 1.20 | |||
| Tennessee | 305.27 | 455.59 | 1.49 | 508.96 | 1.12 | |||
| Texas | 611.06 | 953.41 | 1.56 | 1,018.79 | 1.07 | |||
| Utah | 38.71 | 63.79 | 1.65 | 64.53 | 1.01 | |||
| Vermont | 20.95 | 30.27 | 1.44 | 34.93 | 1.15 | |||
| Virginia | 213.57 | 545.93 | 2.56 | 356.08 | 0.65 | |||
| Washington | 162.10 | 147.43 | 0.91 | 270.27 | 1.83 | |||
| West Virginia | 102.21 | 199.44 | 1.95 | 170.41 | 0.85 | |||
| Wisconsin | 167.72 | 249.17 | 1.49 | 279.63 | 1.12 | |||
| Wyoming | 21.38 | 36.60 | 1.71 | 35.65 | 0.97 | |||
SOURCE: Data from the 2010-2011 Tobacco Use Supplement to the Current Population Survey and Orzechowski and Walker (2012).
Analysis and Conclusions: U.S. Estimates
Because it is important to consider estimates from multiple methods to obtain a comprehensive picture of the scale of the illicit tobacco market, the committee used its estimate, based on a residual method, and viable estimates from other methods to establish an estimated range of the size of the illicit tobacco market. The high range of the estimate represents data from a pack return survey in the United States conducted by Fix and colleagues (2013).
The estimated size of the U.S. illicit tobacco market, represented by the proportion of illicit purchases of cigarette packs through tax avoidance and
| Adjusted Self-Reported Consumption – Tax-Paid Sales (millions of packs) | State Tax per Pack | Average Retail Price per Pack | Smoking Prevalence (%) | Lost Revenue (millions of dollars) | Percentage of Consumption Subject to Tax Avoidance and Evasion | |||
| 11.49 | $1.66 | $4.88 | 16.27 | $19.07 | 16.58 | |||
| 318.25 | $4.35 | $7.39 | 13.17 | $1,384.39 | 44.97 | |||
| –44.92 | $0.45 | $4.25 | 18.34 | $(20.21) | –8.40 | |||
| –10.13 | $0.44 | $4.03 | 17.72 | $(4.46) | –27.90 | |||
| 147.73 | $1.25 | $5.15 | 21.77 | $184.67 | 18.29 | |||
| 29.60 | $1.03 | $4.95 | 24.22 | $30.49 | 10.08 | |||
| –19.13 | $1.18 | $4.90 | 15.57 | $(22.57) | –12.19 | |||
| –31.96 | $1.60 | $5.20 | 16.92 | $(51.13) | –4.69 | |||
| 11.98 | $3.46 | $7.25 | 17.04 | $41.44 | 23.06 | |||
| –193.31 | $0.57 | $3.81 | 17.80 | $(110.19) | –72.80 | |||
| 7.59 | $1.53 | $5.22 | 20.63 | $11.61 | 16.88 | |||
| 53.37 | $0.62 | $4.42 | 22.91 | $33.09 | 10.49 | |||
| 65.38 | $1.41 | $5.28 | 15.93 | $92.18 | 6.42 | |||
| 0.75 | $1.70 | $4.51 | 10.45 | $1.27 | 1.16 | |||
| 4.66 | $2.24 | $6.39 | 16.67 | $10.44 | 13.35 | |||
| –189.85 | $0.30 | $4.30 | 14.81 | $(56.96) | –53.32 | |||
| 122.84 | $3.03 | $6.35 | 15.69 | $371.58 | 45.45 | |||
| –29.03 | $0.55 | $4.31 | 22.38 | $(15.97) | –17.04 | |||
| 30.46 | $2.52 | $6.45 | 17.38 | $76.77 | 10.89 | |||
| –0.96 | $0.60 | $4.48 | 21.24 | $(0.57) | –2.68 | |||
evasion, is between 8.5 and 21 percent. The national percentage represents 1.24 to 2.91 billion packs and between $2.95 and $6.92 billion lost in gross state and local tax revenues.
The illicit tobacco market is not evenly distributed across the country. It may account for as much as 45 percent of all cigarettes in high-tax states (e.g., New York and Washington), while in other parts of the country participation in the illicit tobacco market appears to be negligible. Some states, such as New Hampshire, are big winners in tax revenues gained, while others such as New York are tax revenue losers. Of the total tobacco taxes collected by states and localities in 2011 of $17.65 billion, the net import-
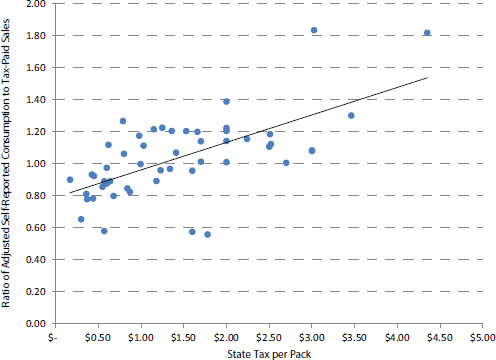
FIGURE 4-2 Ratio of tax-paid sales to adjusted self-reported consumption by state cigarette excise tax.
SOURCE: Data from the 2010-2011 TUS-CPS and Orzechowski and Walker (2012).
ing states lost an estimated $2.95 billion in state cigarette excise taxes, and the net exporting states gained an estimated $0.82 billion. New York State accounted for nearly half of the total revenues lost.
Overall, the total amount of tax revenue lost to the illicit tobacco market is roughly 10 percent of the total tobacco tax due, which is smaller than estimates of the “income tax gap” of 17 percent at the federal level and 18 percent at the state level. Looking internationally, the U.S. illicit tobacco market is slightly larger as a share of the total market than the illicit market in Canada, which the committee estimates to be between 7.6 and 14.7 percent of the total market (see Box 4-2, above).
The Mackinac Center for Public Policy also has produced state-level estimates of the prevalence of the illicit tobacco trade in the United States. However, it is difficult to reconcile the differences between the Mackinac Center’s and the committee’s estimates at the state level.9 The committee
_______________
9 The committee used data from the Mackinac Center for Public Policy; see http://www.mackinac.org/18128 [January 2015] and http://taxfoundation.org/article/cigarette-taxes-and-cigarette-smuggling-state [January 2015].
TABLE 4-4 Top Five Net Exporting and Importing States
| State | SRC (millions of packs) | TPS (millions of packs) | Adjusted SRC (millions of packs) | Adjusted SRC:TPS | Adjusted SRC-TPS | 2011 State Cigarette Excise Tax (per pack) | Estimated State Revenue Gained or Lost | ||
| Top Five Net Exporters | |||||||||
| New Hampshire | 42.31 | 126.60 | 70.54 | 0.56 | –56.05 | $1.78 | $99,770,000 | ||
| Delaware | 27.52 | 79.93 | 45.88 | 0.57 | –34.05 | $1.60 | $54,480,000 | ||
| South Carolina | 159.27 | 458.87 | 265.55 | 0.58 | –193.31 | $0.57 | $110,190,000 | ||
| Virginia | 213.57 | 545.93 | 356.08 | 0.65 | –189.85 | $0.30 | $56,960,000 | ||
| Georgia | 243.79 | 523.18 | 406.46 | 0.78 | –116.72 | $0.37 | $43,190,000 | ||
| Top Five Net Importers | |||||||||
| Washington | 162.10 | 147.43 | 270.27 | 1.83 | 122.84 | $3.03 | –$371,580,000 | ||
| New York | 424.47 | 389.45 | 707.70 | 1.82 | 318.25 | $4.35 | –$1,384,390,000 | ||
| Arizona | 135.97 | 163.43 | 226.70 | 1.39 | 63.26 | $2.00 | –$126,530,000 | ||
| Rhode Island | 31.34 | 39.95 | 51.92 | 1.30 | 11.98 | $3.46 | –$41,440,000 | ||
| Kansas | 94.64 | 124.67 | 157.59 | 1.27 | 33.12 | $0.79 | –$26,160,000 | ||
NOTE: The measure used is the ratio of adjusted self-reported consumption (SRC) to tax-paid sales (TPS).
SOURCE: Data from the 2010-2011 Tobacco Use Supplement to the Current Population Survey and Orzechowski and Walker (2012).
converted the 2012 Mackinac Center estimates into packs subject to tax avoidance or tax evasion for all available states (all but Alaska, Hawaii, North Carolina, and the District of Columbia). Summing the total packs sold from net importing states (i.e., relatively high-tax states) and dividing by total packs in all available states suggests that 13.5 percent of sales are avoiding taxes. However, the total packs sold from the net exporting states should be roughly equal (minus North Carolina, which is considered by the Mackinac study as the primary source of “commercial smuggling”) to the total sold from net importing states, but they are not: instead of roughly 13 percent, these sales only represent 3.2 percent of total packs sold. This discrepancy suggests some systematic bias in the estimates—likely overstating tax evasion from importing states and understating tax evasion from exporting states.
The Mackinac estimates of revenue losses for the committee’s top five importing states are significantly larger than the committee’s estimates, with the exception of Kansas ($17 million in comparison with the committee’s $27 million). Collectively, the revenue losses are 45 percent higher than the committee’s estimates. Conversely, the Mackinac estimates for revenue gains for the committee’s five top exporter states are 71 percent lower than the committee’s estimates. Some of this latter difference reflects the assumption in the Mackinac study that attributes long-distance (in contrast with cross-border) smuggling exclusively to North Carolina. Although the two sets of estimates differ by a year, there were no significant cigarette tax increases during that time.
The significant difference in sales subject to tax avoidance and evasion between importing and exporting states found in the Mackinac study suggests a very high volume of illicit trade with Canada and Mexico—a conclusion the committee did not reach. Furthermore, the Mackinac study relies on a number of assumptions that may help explain differences with the committee’s estimates. Specifically, the Mackinac study assumes (1) daily cigarette consumption for current smokers is constant across states; (2) all long-distance smuggling originates in North Carolina; and (3) systematic differences in sales for states bordering Mexico or Canada are attributable to tax avoidance and evasion.
The committee’s estimate of the size of the illicit tobacco market in the United States also differs from other recent studies, and there are a number of possible explanations for these differences. First, the committee’s estimates are likely lower because they reflect net transfers of cigarette packs between states. In other words, for states with both positive and negative tax differentials with neighboring states (e.g., Indiana10), the difference
_______________
10 Indiana, for example, borders Illinois (including the high-tax jurisdictions in and around Chicago), Michigan, and Ohio, which have higher cigarette excise taxes. But, to the south, Indiana also borders low-tax Kentucky.
between the tax-paid sales and self-reported consumption represents the net differences and therefore underestimates total cross-border illicit trade. There may also be a downward bias if underreporting of consumption is not the same across states, with greater underreporting in higher-tax states where the social norms against smoking are stronger. Second, the estimates by Fix and colleagues (2013) may be biased slightly upward because they reflect tax avoidance and evasion for smokers who smoke a minimum number of five cigarettes per day.
A limitation of other recent studies and the committee’s estimate is that they do not account for incidental differences in sales and consumption that may result from patterns of commuting and tourism. To improve the committee’s estimates, one would have to account for patterns of commuting and tourism and develop econometric methods for estimating the total flow of illicit trade in states that border states with both higher and lower cigarette excise tax rates.
The three basic methods for estimating the size of the illicit tobacco market—residual methods (including trade gaps, comparing tax-paid sales and self-reported consumption, and econometric modeling), direct measurement (surveys, empty pack studies, and pack observation, return and swap studies), and expert opinion—have different sources of error. The various studies also differ in the time periods covered, sample sizes, and scientific rigor. They also yield different estimates, partly because different approaches capture different combinations of tax avoidance and tax evasion, activities that are difficult to separate. Because of these limitations, researchers should use multiple methods to obtain the most comprehensive picture of the scale of the illicit tobacco market for a specific location and time. The improvements to existing methods recommended by the committee (see below) would also help researchers to distinguish between tax evasion and tax avoidance.
As detailed in Table 4-1 (above), the strengths and weaknesses of each method affect estimates in both directions: some aspects of each method tend to overestimate the size of the market, and some aspects tend to underestimate the size of the market. Importantly, however, all three methods are based on consumers, on the demand side of the market. There has been virtually no research on the supply side. If such supply data become available, they would add important information for estimating the overall size of the illicit tobacco trade.
Using its own estimate and plausible estimates from other methods to establish a range for the size of the illicit market, the committee determined that the percentage of the total market represented by illicit sales in the
United States is between 8.5 and 21 percent. This range represents between 1.24 to 2.91 billion packs of cigarettes annually and between $2.95 and $6.92 billion in lost gross state and local tax revenues. The high end of the range (21 percent) is consistent with a national pack return survey conducted in the United States; the low end of the range (8.5 percent), which is the committee’s own estimate, reflects the net level of tax avoidance and evasion at the state level, aggregated nationally, using the method of comparing tax-paid sales and self-reported consumption.
The committee’s calculations show that the net percentage of sales subject to tax evasion and avoidance grew from 3.2 percent in 1992-1993 to 8.5 percent in 2010-2011. For states with both positive and negative tax differentials with neighboring states, the difference between tax-paid sales and self-reported consumption will underestimate total cross-border illicit trade. Nevertheless, the committee’s estimate has a clear interpretation (the comparison is with a counterfactual where smokers bought all their cigarettes in their state of residence, from a source that paid state taxes), the quantity that it is estimating can be defined precisely, and there are no issues with selecting a credible national sample of survey sites.
The committee’s state-level estimates show that the illicit tobacco market is not evenly distributed across the country. It may be as high as 45 percent in high-tax states, such as New York; in other parts of the country it is not a significant part of the tobacco market. The committee classified 22 states and the District of Columbia as net exporters, and the remaining 28 states as net importers. Of the total tobacco taxes collected by states and localities in 2011 of $17.65 billion, the net importing states lost an estimated $2.95 billion in state cigarette excise taxes, and the net exporting states gained an estimated $0.82 billion. New York State accounts for nearly half of the total revenues lost.
As a point of reference, the (low end of the) total amount of tax revenue lost to the illicit tobacco market is roughly 10 percent of the total tobacco tax due, which is smaller than estimates of the “income tax gap” of 17 percent at the federal level and 18 percent at the state level. Looking internationally, the U.S. illicit tobacco market is slightly larger as a share of the total market than the illicit market in Canada, which the committee estimates to be between 7.6 and 14.7 percent of the total market.
RECOMMENDATION 4-1 The Tobacco Use Supplement to the Current Population Survey should be expanded in both the number of questions and specificity of questions currently asked regarding tobacco use and illicit tobacco market participation. The survey should continue to include questions that garner information about price paid and location and place of purchase; it should add questions on frequency of purchase at certain locations, last purchase location and price, and
nature of the purchase (i.e., licit or illicit). Other questions that should be added would cover the particular factors contributing to one’s seeking out lower-priced products and what price levels might influence a consumer’s decision to switch between the legal and illicit markets.
RECOMMENDATION 4-2 A large-scale pack swap survey that is representative of the U.S. population should be conducted. This survey could be integrated into a current nationwide survey capable of also providing state-level estimates, such as the Tobacco Use Supplement to the Current Population Survey, so that questions regarding a customer’s last purchase would be coupled with a pack swap component that would allow researchers to examine stamps and markings to determine if appropriate taxes were paid, and conduct an analysis of the product’s design characteristics and chemistry in order to determine if counterfeits or illicit whites had entered the market.
RECOMMENDATION 4-3 Methods should be improved in order to better differentiate between tax evasion and tax avoidance. More accurate estimates of the size of the illicit market separately attributable to tax avoidance and tax evasion could be obtained by combining more systematic data collection on discarded packs in states with significant illicit trade with (1) an expansion in the number and specificity of questions currently asked in representative population surveys regarding tobacco use and illicit tobacco market participation and (2) a large-scale pack swap survey that is similarly representative of the U.S. population.
This page intentionally left blank.


